HSI1! trade ideas


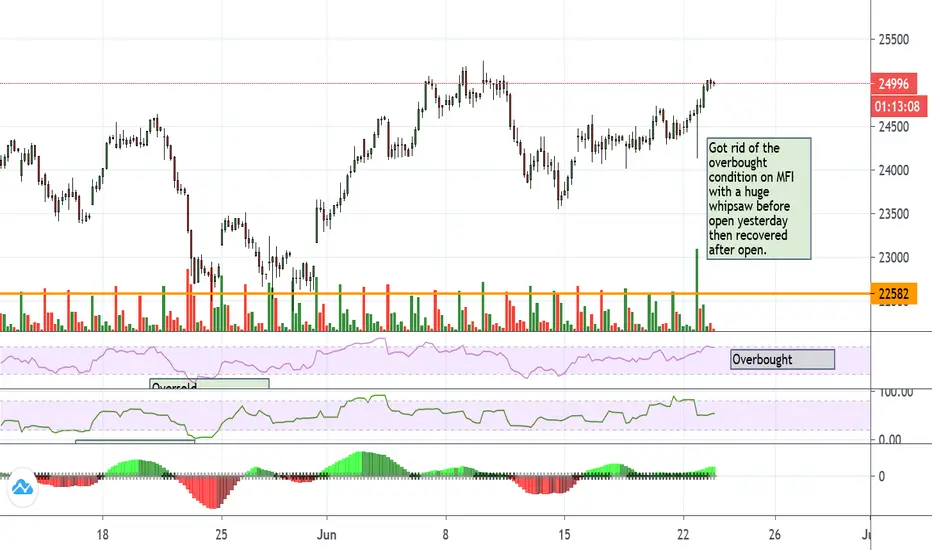
And in China...Got rid of the overbought condition on MFI with a huge whipsaw before their market opened yesterday and recovered as soon as HS opened.
Looks like RSI is touching overbought now, but I don't think it drops until tomorrow afternoon.
Breaking up with HUGE VolumeToday saw a huge surge in volume in the morning hour. Double the usual.
Next few days are critical.
From a bullish POV, HSI is now breaking out of a 10 week range with a high volume but to predict whether it truly is a break to the top or a trap, it is important to know what happened within the range and how the market approached the breakout.
To my understanding, it was distribution(as i have been pointing out in my previous posts) and there is very little left in it.
2 possible scenarios to top out are as drawn on the chart. Triangle(Blue). Ending Diagonal(Orange).
Regards

Low Volume Consolidation and a break up.As updated on 16th, selloff last week from 25255 seemed uncharacteristic of a markdown. Gaps were quickly being filled and volume in the morning hour on 3 days following the top showed minimum enthusiasm from either side.
Too early to call but low volume consolidation may mean a developing triangle.
I am seeing something along the lines drawn at the chart. Keep an eye on S&P. It may coincide with S&P filling the gap from Feb or making new ATH.
If wrong, selloff should start in next couple of days. If so, refer to post "HSI Update" on Jun 13th for the anticipated path.
Regards

Bears. Wait some more.Very uncharacteristic of a mark down so far. Take profit, close half the position or move your SL to 24850 and let the market play itself out. If there is one more up move to go, it should be quick, ending with a buying climax.


HSI UpdateTop did come albeit 2 days late, important or not, we will know in next few days. Ideally, i would like to hv seen more distribution between 25k-26k but as pointed out in previous posts, there was high volume selling in the last move up from 22400 so it was bound to run out of gas real soon.
Pullbacks should be capped below 24500. Definitely dont want to see 24800 tested anytime soon. 22900-22400 will be key and if the markdown has started, this area needs to be quickly overcome perhaps with an acceleration gap.
I am not of a view that it is the start of deflationary crash as many expect and fear. NOT YET at least. Refer to my 23 May post, "Markdown or Shakeout?" linked below.
Quickly down to 20k and back to 25k-26k :D. One can dream.

Hang Seng Futures : Long ==> + % 4.97Hi.
Reference Length = 337 bars (56 1D Bars)
Percentage change of General Terminal in the process of 337 bars:
Parameters
Position Size : %1 (0.01)
Leverage : 50x
Risk/Reward Ratio : 3.00
Stop-Loss : 24556
Goal : 26210
NOTE : Must pay attention to the current internal factors of Hong Kong.
Therefore, stop-loss must be established.
Regards.

Top in place.Fed midweek so gotta give it some room. Expect it to accelerate below 24k.
For detailed thoughts on this short, kindly refer to previous posts.
Regards


The Honey Badger Market: $HSI1 time to take money off the tableThe last time I did a chart series was in mid-Mar warning of a bounce in the markets. Since then, markets have been on a tear and behaving somewhat like a honey badger, it doesn't care if there are still 1,000 daily Covid-19 deaths in the US, race riots and Trump reigniting the Sino-US trade wars. Maybe markets are optimistic there are only 5 more months of Trump-induced madness and you never bet against an election year and a Fed with a printing press.
Perhaps, maybe, if, but I prefer to let the weight of the evidence influence my course of action. So here goes...the Honey Badger Market chart fest!

Important TOP just ahead.
Didn't get the pullback before run for new highs as anticipated in the last analysis but on the flip side it means very little left to distribute. A pullback would have meant more to distribute above but now it looks like a quick up and back down.
We have 7 weeks of distribution mainly between 23750 - 24250(See previous posts)
Without volume, the last few days may seem like a start of a strong uptrend but zoom in and it appears very much like a SL hunt. Trends can't start without first accumulation/distribution and i see very little accumulation below for it to keep going for long.
Initial plan was to go short at 25300-500 but not sure if we will get there so i will look for reversal signs as soon as it gets above 24800. Target 20500 - 20000.
Some news will follow real soon as always but markets only move when those who control them are ready to move.

Strong Head WindsWe did gap up and didn't fill, trapping the late sellers but high volume selling in this up move. Unlikely that accumulation below was enough to carry it to new HIGHS in one go.
It can come crashing down at any moment but if it can get to 25300-500, that will be a very good short opportunity.
Regards

Interesting Monday ahead
All set for a very interesting Monday's opening.
Channel support held on for whole week while the sellers kept up the pressure and are now just above the accumulation zone. Gap up will trap the sellers and may not fill in near term with price quickly marching towards 25k. Gap down will open the door towards first the gap at 21882 and then towards march low at 20968.
If Monday opens near the current prices then watch out for trap(First move usually being a trap)
Volume was high whenever price came back in the accumulation zone which is often the case prior to a significant move.
Short term = Neutral,
Medium Term = Bullish,
Long Term = Bearish.

HSI to extend downside for Fibonacci targetSimple chart, simple Fibonacci, simple target to the downside for the Fibonacci target.
MACD is support of the downdraft.
Apparently Trump is going to have a release on US actions, and surely will be returned with China’s response.
Trigger for downside there...

Markdown or shakeout?
Markets are controlled by very few. They manipulate as they please. They own everything. banks, hedge funds, media, governments. They are the culprits behind social unrest, Wars, Pandemics. No new law is passed without their approval. They have mastered the art of deceiving the masses and they are looking to further enslave the common. Big changes are on the way for which they will create global chaos the likes never seen before by mankind. Many things will be blamed as reasons. Do what they may but a Supreme power watches. Tyrants days are numbered.

Hang Seng OversoldLooks to me like this is going to be the determining factor for Tuesday open....
Hang Seng is oversold, I would expect it to bounce off support Sunday and Monday, which would mean a gap up Tuesday morning.
Of course, the virus thing is unpredictable and if China shuts everything down again we could see a double bottom. Not to mention they're trying to clamp down on Hong Kong which usually tanks the Hang Seng (it's the Hong Kong index after all), so there is the possibility that it goes severely oversold.


No Clear DirectionTurns out, Yesterday's original idea of selling at 24600 could have been a masterstroke.
On Daily, we have an inside day fakeout which favors more downside over the next couple of sessions.
Levels to watch for support
24120
23750-800
Gap at 23455
For resistance,
24250,
24360
24460.
I don't have any clear bias atm. Sidelined for now.
Thank you.

Resistance to be tested shortly (Revised)*Analysis are overrated. Timing entries/exits is the real essence of Trading.*

Resistance to be tested shortly?Details at the chart.
*Analysis are overrated. Timing entries/exits is the real essence of Trading.*
