Copper started retracement moveOn Our Harmonic pattern indicator based trade setup take trade as explained below :-
Early trades Buy or sell below/ above 23.6 %, safe trades buy or sell above / below 41% , after taking trade next upside or downside levels will be target ,
When reverse buy or sell signal appear then book profit on Target or trail SL to 23.6 % If trailing SL hit then early trade can be taken above or below 23.6 and safe trade can b taken above/ below 41% ..
Please note:-
It's working on news based and volitile market very well so exit if SL hit
LRC1! trade ideas

The Wiseguy Report : December Copper HGZ2023The Wiseguy Report : December Copper HGZ2023
HGZ2023 -- COMEX:HGZ2023
NEAR TERM : NEUTRAL
VOLUME STRUCTURE
So far, for the month of September, 70% of the December Copper volume has occurred between 3.8400 & 3.7100, with the highest volume occurring near 3.7900.
PRICE ACTION
December Copper has rejected all its previous interest inside the Value Zone & is seeking price balance somewhere near 3.6000 support. While this may appear Bearish at first, which it is, I am taking caution & anticipating an upside correction from this over-sold condition before becoming truly Bearish.
FUNDAMENTAL FACTORS
- Weak USA Housing Market.
---High USA Mortgage Rates
---Low demand for New & Existing Homes
- China's declining demand due to weak economy

HG1! Copper Day Trade 26-Sept-2023TRADE DIRECTION: Downtrend; as indicated by the red trendline
KEY LEVELS: Daily Pivot and the red trendline
TRIGGER SIGNAL: Dark Cloud Cover and Bearish Pin Bar closed below the Daily Pivot


Copper near at reversal zone can go up For all trade on my Auto Harmonic patterns indicator trade setup -
Risky trades can take trade after crossing 23.6% on either side and safe traders can take trade after 41% We can start buying when our Trailing SL hit at 23.6% with SL of recent low our Target will be 41%, 78.6% , 127.2% 161.8% and 223.6 % , when reversal pattern appears on chart we have to trail our SL if trailing SL hit exit from long trade and initiate sell trade ,

HG1! Copper Day Trade 25-Sept-2023
TRADE DIRECTION: Downtrend; as indicated by the red trendline
KEY LEVELS: Daily Pivot and the red trendline; price failed to break and close above it.
TRIGGER SIGNAL: Bearish Engulfing (red arrow)

Copper Futures - Short - BearishSeeing a rising wedge pattern forming.
Trading bearing with thought breakout to the downside soon
***Always use proper risk management***

Copper ready for upside move For all trade on my Auto Harmonic patterns indicator trade setup -
Risky trades can take trade after crossing 23.6% on either side and safe traders can take trade after 41% We can start buying when our Trailing SL hit at 23.6% with SL of recent low our Target will be 41%, 78.6% , 127.2% 161.8% and 223.6 % , when reversal pattern appears on chart we have to trail our SL if trailing SL hit exit from long trade and initiate sell trade ,

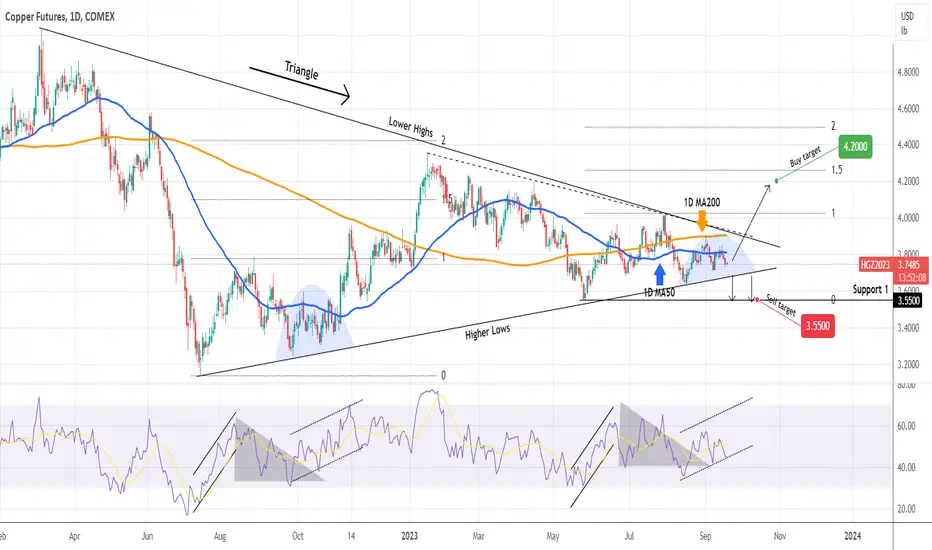
COPPER Two year Triangle is about to break out!Copper (HG1!) has been trading within a Triangle pattern for more than 2 years and recently the price action has gotten so narrow that it prompts to a break-out soon. The 1D MA50 (blue trend-line) has been acting as the Pivot level while the 1D MA200 (orange trend-line) had the last rejection on record on September 01.
The 1D RSI since the May 24 Low has been printing a similar price pattern to July - October 2022 (so far). That fractal was also using the 1D MA50 as the Pivotand after it broke its Resistance, it rose aggressively almost as high as the 2.0 Fibonacci extension. We will purse a more modest target, below the 1.5 Fib at 4.2000. The R/R is worth it as a break below the Higher Lows (bottom) of the Triangle will make us close the trade on minimum loss and open a sell instead targeting 3.5500 (Support 1).
-------------------------------------------------------------------------------
** Please LIKE 👍, FOLLOW ✅, SHARE 🙌 and COMMENT ✍ if you enjoy this idea! Also share your ideas and charts in the comments section below! **
-------------------------------------------------------------------------------
💸💸💸💸💸💸
👇 👇 👇 👇 👇 👇
Copper fresh downtrend startedFor all trade on my Auto Harmonic patterns indicator trade setup -
Risky trades can take trade after crossing 23.6% on either side and safe traders can take trade after 41% We can start buying when our Trailing SL hit at 23.6% with SL of recent low our Target will be 41%, 78.6% , 127.2% 161.8% and 223.6 % , when reversal pattern appears on chart we have to trail our SL if trailing SL hit exit from long trade and initiate sell trade ,

Copper ready for Upmove 740 again For all trade on my Auto Harmonic patterns indicator trade setup -
Risky trades can take trade after crossing 23.6% on either side and safe traders can take trade after 41% We can start buying when our Trailing SL hit at 23.6% with SL of recent low our Target will be 41%, 78.6% , 127.2% 161.8% and 223.6 % , when reversal pattern appears on chart we have to trail our SL if trailing SL hit exit from long trade and initiate sell trade ,

COPPER: Neutral. Wait for a breakout.Copper is technically neutral, as also dipicted by the 1D outlook (RSI = 50.817, MACD = -0.013, ADX = 24.251) inside the HL trendline of the Bullish Megaphone and the LH trendline of the January High. This movement can only offer scalping opportunities.
If you want to commit beyond those, buy over the LH and target R2 on the medium term (TP = 4.1950) and sell under the HL and target S2 (TP = 3.5450).
## If you like our free content follow our profile to get more daily ideas. ##
## Comments and likes are greatly appreciated. ##

Industrial metals continue to face headwinds as Chinese data disIndustrial metals were the worst performing commodity sector last month and were down 2.7%1. Over the last six months, the sector is down 15.2% and has created the biggest drag on the overall performance of commodities.
China's real estate sector, once the engine of its economy, is now teetering on the edge of crisis because of excessive borrowing, overbuilding, and a housing slowdown. The government's crackdown on risky practices and sudden intervention in 2020 to prevent a housing bubble have led to over 50 Chinese developers defaulting or failing to make debt payments in the last three years. The consequences include reduced consumer spending due to falling housing prices, disappearing jobs tied to housing, and decreased business confidence. While policymakers have taken modest steps to address the situation, the real estate turmoil has spread to financial institutions and the broader economy, prompting concerns of a larger crisis. A build-up in industrial metal inventories over the last 3 months is consistent with market expectations of ample supply of the metals for the rest of the year, given relatively modest demand. Zinc inventory is up 96% while lead inventory is up 85% compared to 3 months ago.
This is clearly weighing on sentiment towards industrial metals. Copper (COMEX) was down 2.8%1, and aluminium down 2.8%1. The only bright spot in the basket was lead, which was up 3.7% last month. Speculative positioning in COMEX copper has been oscillating between positive and negative territories in recent months and entered negative territory again last month after briefly becoming positive2. COMEX copper inventory is up around 46% compared to 3 months ago. And although copper held in COMEX is one of the smaller stores of the metal, when combining London Metal Exchange, Shanghai Futures Exchange and COMEX, copper inventory is still 27% above where it was 3 months ago.
Nickel was down 5.7% last month1. Although nickel is widely known for its use in electric vehicle batteries, a growing market, it still draws around two-thirds of its overall demand from the production of stainless steel. China's steel market has been facing pressure in August due to continued high steel production despite sluggish end-user demand. Blast furnace utilization rates have risen, but some local mills in key steelmaking provinces like Hebei and Jiangsu have not received official communication about output reductions. Uncertainty surrounds the extent of China's steel output cuts for the rest of the year, with expectations of smaller scale cuts targeting environmentally sensitive regions. Rising steel inventories are attributed to robust production and weak demand. Despite potential production cuts, market sentiment remains cautious due to these challenges, and steel prices have declined. This, in turn, is weighing on nickel.
Source:
1 Bloomberg as of 21 July 2023 to 21 August 2023
2 Commodity Futures Trading Commission (CFTC) as of 15 August 2023
3 change in inventory over the past 3 months by United States Department of Agriculture
This material is prepared by WisdomTree and its affiliates and is not intended to be relied upon as a forecast, research or investment advice, and is not a recommendation, offer or solicitation to buy or sell any securities or to adopt any investment strategy. The opinions expressed are as of the date of production and may change as subsequent conditions vary. The information and opinions contained in this material are derived from proprietary and non-proprietary sources. As such, no warranty of accuracy or reliability is given and no responsibility arising in any other way for errors and omissions (including responsibility to any person by reason of negligence) is accepted by WisdomTree, nor any affiliate, nor any of their officers, employees or agents. Reliance upon information in this material is at the sole discretion of the reader. Past performance is not a reliable indicator of future performance.

Copper's Perfect PennantWhile the concerns of a Global Recession are not entirely out of the question, the supportive economic activity we have seen in the U.S. should indicate that the Fed may be closer to achieving its soft landing goals. Construction and housing remain robust where mined resources such as copper are in peak demand. Asia and India have also seen a pick-up in activity where China has stepped in to address its recent economic setbacks by cutting interest rates and backstopping its real estate market.
Let's look at the charts
The Technical landscape indicates a near-perfect pennant formation after carving out a bottom in mid-August and forming a flagpole up to the August 23rd highs. Traders will see the market has consolidated throughout the week, generating the pennant before blasting off on weaker Jolts and ADP payroll data.
The stochastic momentum indicator shows that prices have breached overbought levels, telling you that a new bull market may be in store. Traders will want to use $4 as their upside target, last seen in July, and $3.75 as their first level of support.
www.tradingview.com
CME Real-time Market Data help identify trading set-ups and express my market views. If you have futures in your trading portfolio, you can check out on CME Group data plans available that suit your trading needs
Disclaimers
*Trade ideas cited above are for illustration only, as an integral part of a case study to demonstrate the fundamental concepts in risk management under the market scenarios being discussed. They shall not be construed as investment recommendations or advice. Nor are they used to promote any specific products, or services.
Futures trading involves substantial risk of loss and may not be suitable for all investors. Trading advice is based on information taken from trade and statistical services and other sources Blue Line Futures, LLC believes are reliable. We do not guarantee that such information is accurate or complete and it should not be relied upon as such. Trading advice reflects our good faith judgment at a specific time and is subject to change without notice. There is no guarantee that the advice we give will result in profitable trades. All trading decisions will be made by the account holder. Past performance is not necessarily indicative of future results.


Copper needs China.As everyone knows, China is one of the largest consumers of copper. And it is the demand for copper from China that largely forms the market for this metal. For some time now, demand has fallen sharply and pushed copper quotes down. Copper is a very interesting trading instrument. That's just to sell more in all likelihood, if you have to, then only on very short time periods. Traders are waiting for the resumption of demand from China. When this happens, it will be possible to open long positions and earn. So far, we are watching how the price interacts with the formed support level and the long-term resistance line. Probably the outcome with the growth of copper is already close.

Copper: Letting go🕊️The copper price is slowly but surely breaking away from our blue target zone between $3.7730 and $3.5445. Since the price has already placed its low of the magenta wave (x) within this zone, we expect significant rises above the resistance at $4.19. It should then go down to our green target zone between $3.0860 and $2.5965.

Copper - Did Social Media Tell You To Long The CCP Again?They call copper "Doctor Copper" because it's said to forecast the overall world economic conditions on account of being tightly wed to manufacturing.
Well, what people are really yammering about with that over the last 20 years is whether or not the Chinese Communist Party is healthy, and the world by proxy being healthy because it tied itself to the most heinous regime in history, the one responsible for the 24-year persecution of Falun Gong by former Chairman Jiang Zemin and the accompanying organ harvesting and genocide.
Unfortunately for all the blind bulls, the early 2021-2022 price action was a pretty good indication of a top, and that top is really confirmed by the fact that since October of '22, this bounce has been pretty weak, and starting this month, with all the drama surrounding the slow collapse of the Chinese economy, took out the previous two months' lows.
Monthly shows you that August price action took both the July and June lows.
Like, that's not the kind of "signal" you want to see to get long for a new all time high.
When something is retracing to take out major highs, you want to see lows rarely violated with something of a freight train towards the old highs.
Weekly bars show us something of a subtle pattern where it looks like it's just taken some lows and is consolidating and continually flirting with going back up.
But in reality the market makers are, most likely, just selling more under the previous $4.00 area.
And if that's really true, it means another gap down is imminent, especially after an entire quarter of ranging.
If you ask me, the first area that you can look for a long that is more than a scalp on copper is under $2.8, which is a critical pivot from September.
And a more likely target in the next 12 months is the $2.00 mark, which was barely swept out in the COVID drama.
The reality is, my friends, the Chinese Communist Party is going to fall overnight in our lifetimes. Not five or ten years from now. But very shortly, and everything is going to change.
Whether that is caused by Xi Jinping throwing away the CCP to protect himself and China from being taken over by the International Rules Based Order as it uses Taiwan as a soft proxy war, or because the whole world collapses under the results of the persecution of Falun Dafa, since everyone's been going to Shanghai to worship the toads and the Devil Red to get financial benefits.
This is the danger.
The danger is imminent.
But copper trades painfully slowly, so if you want to do this you have to have long duration, ignore the noise, and be willing to suffer some drawdown.
China under the CCP is never going to recover. Things are never going to be okay ever again.
Things will be okay once mankind returns to tradition.
But there won't be an international stock market like this anymore that day.

Copper Scalping trade setupMorning Star pattern is observed which hints buying in the counter. Expecting a move to 738 with the support of 732

Copper - rebound from support.Copper, in my opinion, undeservedly has low popularity in the trading community. I heard the opinion that there are few trading situations on the chart of this metal. I do not want to argue, but I think it depends on what angle we look at the chart from, and also on what trading methods we use. Recently, copper quotes bounced off the support level of 3.7. I think it will soon be time to prepare for an uptrend.

COPPER - ON MAKE OR BREAK ZoneCopper - Level 710 Is big Big deciding Points
Time Frame - MONTHLY
Objective - TRENDLINE major Support LINE
Make or Break area 710.
1. till respect demand Zone line 710 we can see Again bounce towards 740 to 785+++
2. If Break demand Zone than we can see free fall as like water fall 680 660 to 600
3. long term we can see Again 450 400 level too.
Disclaimer - View just for Educational purposes

CopperCopper is in point that we can set a long order with min risk. Also it is finishing wave e Elliott wave basically.
