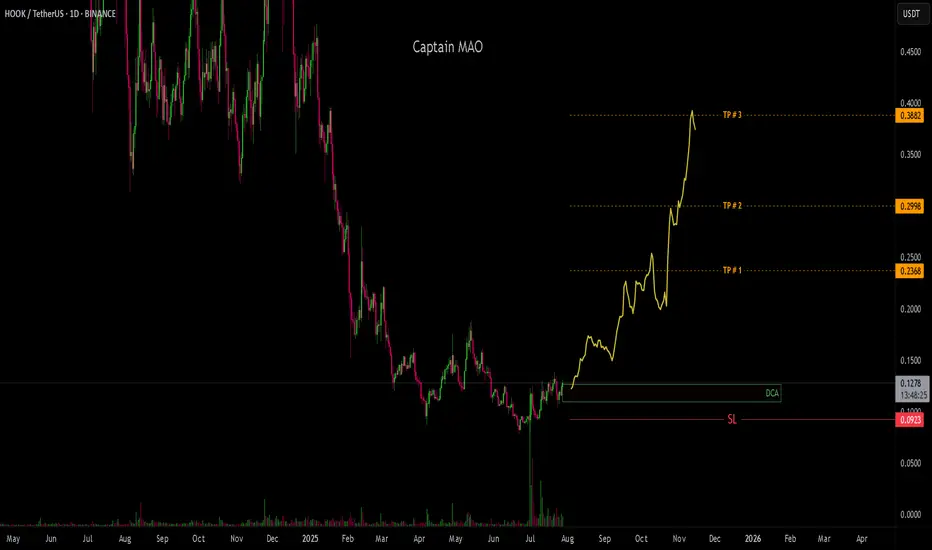
HOOK/USDTHas successfully reclaimed the critical $0.10–$0.11 zone, which previously acted as major resistance and is now flipping into new base support. This reclaim is a significant technical signal, suggesting that sellers are being absorbed and buyers are stepping back in with strength.
The pair is now hovering above this reclaimed zone, consolidating tightly—a classic early sign of a potential trend reversal. This structure often precedes a bullish leg upward as confidence returns to the market.
HOOKUSDT trade ideas
HOOK Testing Red Resistance & Forming Double Bottom🚨 HOOK Testing Red Resistance & Forming Double Bottom 🔴📈
HOOK is currently testing the red resistance trendline and has formed a bullish double bottom pattern, which could indicate a potential reversal.
🎯 If breakout is confirmed:
✅ First Target – Green line level
📊 A confirmed breakout of both the resistance trendline and the double bottom structure could signal strong bullish momentum.
Watch for confirmation before entering! 💼💸
HOOKUSDT 1D#HOOK has broken the long-term descending trendline and is currently moving inside the Ichimoku Cloud. Consider buying some #HOOK near the support level at $0.1216.
In case of a successful bounce from the support and a breakout above the Ichimoku Cloud, the targets are:
🎯 $0.1554
🎯 $0.1794
🎯 $0.2033
🎯 $0.2375
🎯 $0.2810
⚠️ Always use a tight stop-loss and practice proper risk management.

#HOOK/USDT | Long Bias ?#HOOK
The price is moving within a descending channel on the 1-hour frame, adhering well to it, and is on its way to breaking it strongly upwards and retesting it.
We have a bounce from the lower boundary of the descending channel. This support is at 0.0882.
We have a downtrend on the RSI indicator that is about to break and retest, supporting the upside.
There is a major support area in green at 0.0857, which represents a strong basis for the upside.
Don't forget a simple thing: ease and capital.
When you reach the first target, save some money and then change your stop-loss order to an entry order.
For inquiries, please leave a comment.
We have a trend to hold above the 100 Moving Average.
Entry price: 0.0941
First target: 0.0989
Second target: 0.1045
Third target: 0.1121
Don't forget a simple thing: ease and capital.
When you reach the first target, save some money and then change your stop-loss order to an entry order.
For inquiries, please leave a comment.
Thank you.

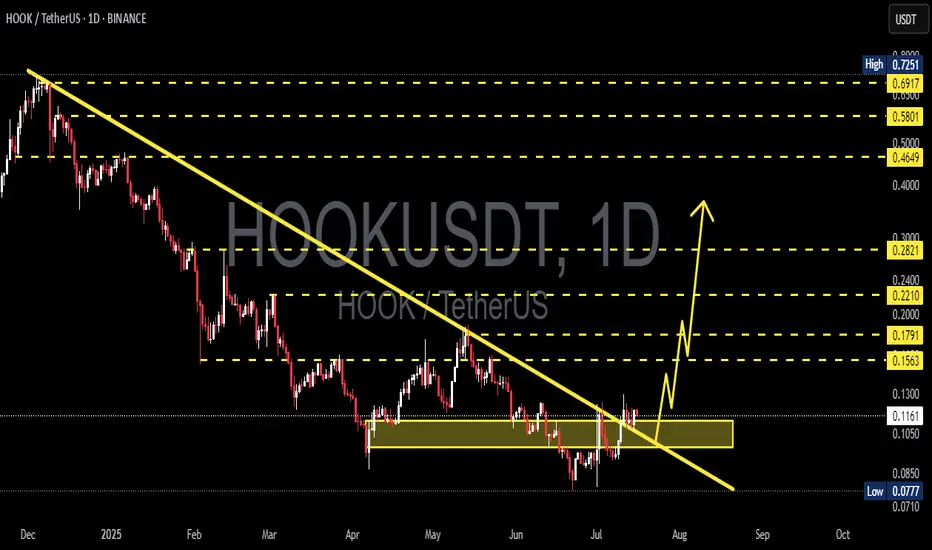
HOOK/USDT Major Downtrend Breakout — Reversal in Play🔍 Chart Overview
HOOK/USDT has finally broken out of its macro downtrend, which had been holding the price down since December 2024. This breakout is not just a technical move — it could mark the beginning of a mid- to long-term reversal. The price is now retesting the breakout area (yellow box), offering an ideal entry point before a potential rally.
📈 Pattern & Technical Structure
🟡 1. Breakout from Long-Term Downtrend
The yellow trendline shows a 7-month-long bearish trendline.
Price has now closed daily candles above this line, indicating a clear shift in market structure.
The breakout occurred after a sideways accumulation phase between $0.1050 – $0.1200, which also acts as a demand zone.
🟢 2. Inverse Head and Shoulders (IH&S) Pattern
Left and right shoulders formed around $0.1050
Head formed at the $0.0710 – $0.0777 zone
Price has broken above the neckline, validating the IH&S reversal pattern
📊 3. Volume & Momentum
Increased volume during the breakout confirms strong buying interest
If the retest holds, bullish momentum could accelerate toward key resistance levels
🟢 Bullish Scenario (Positive Outlook)
If price holds above the retest zone ($0.1167 – $0.1200) and confirms support:
Bullish Targets:
1. $0.1300 – Nearest minor resistance
2. $0.1563 – Breakout confirmation zone
3. $0.1791 – Psychological and fib confluence
4. $0.2210 – IH&S pattern target
5. $0.2821 – Key horizontal resistance
6. $0.4649 – $0.5801 – Golden pocket zone (Fibonacci retracement)
✅ Potential ROI: 100%+ from current levels
🔴 Bearish Scenario (Negative Outlook)
If HOOK fails to hold above $0.1050:
The breakout may become a false breakout (bull trap)
Price could fall back toward $0.0850
A deeper drop toward $0.0777 – $0.0710, the last major demand zone
🚫 Breakdown below this zone would re-enter a long consolidation phase
🎯 Conclusion & Strategy
HOOK is at a critical turning point. A confirmed breakout from the macro downtrend + IH&S pattern signals a high-probability bullish reversal. The current pullback serves as a textbook retest — a prime area for entries.
Aggressive traders can consider entering now with SL below $0.1050. Conservative traders may wait for confirmation candles above $0.1300.
✅ Quick Checklist:
✅ Confirmed breakout from macro downtrend
✅ Inverse Head and Shoulders pattern active
✅ Volume spike supports breakout
✅ Retest in progress at key demand zone
#HOOKUSDT #HookBreakout #CryptoReversal #AltcoinSeason #InverseHeadAndShoulders #TechnicalBreakout #CryptoAnalysis #ChartPattern #TradingSignals #HookAnalysis #BreakoutCrypto
#HOOK/USDT#HOOK
The price is moving in a head and shoulders pattern on the 1-hour frame, adhering well to it, and is heading for a strong breakout upwards and retesting it, forming the right shoulder.
We have a bounce from the lower channel line to the right shoulder, which is support at 0.0890.
We have a downtrend on the RSI indicator that is about to be broken and retested, supporting the upside.
We have a trend of consolidation above the 100 moving average.
Entry price: 0.0970
First target: 0.1000
Second target: 0.1039
Third target: 0.1096

Will #HOOK Continue to Rise or a Trap is Being Set? Must Watch Yello Paradisers! Have you seen the recent price action of the #HookedProtocol or not? Let's see what's happening with #HOOK and its next move:
💎#HOOKUSDT has been moving in a clear falling wedge pattern, with price respecting both the descending resistance and support levels since late April. After multiple rejections from the lows, we finally saw a breakout from the wedge, which is a potential sign that bulls are preparing for a shift in structure.
💎Currently, #HOOKUSD is trading near 0.1120, and the 50EMA is now acting as support, which increases the probability of a continued move higher. The first area we are watching is 0.1242, which now acts as the moderate resistance. If the market manages to hold above this level, it opens up the path toward 0.1938, the next strong resistance, and a level where profit-taking becomes critical.
💎However, if bulls fail to hold the structure and price breaks back below 0.0779, then the entire bullish setup becomes invalid. In that case, we’ll likely revisit the 0.0600 region, and the trapdoor opens for late buyers who ignored the warning signs.
Stay sharp, Paradisers. The market is about to pick a side and we’ll be on the right one.
MyCryptoParadise
iFeel the success🌴

HOOK/USDT – Successful Retest of BreakoutHOOK has successfully retested its downtrend breakout zone and is now attempting a fresh leg up, signaling renewed bullish strength. The previous resistance is now acting as solid support.
Analysis Highlights:
Breakout from multi-week downtrend line
Sharp pullback → clean retest of the breakout line
Buyers are stepping back in from the $0.095 zone
Support Levels:
$0.0950 – Immediate support (trendline retest zone)
$0.0996 – Strong horizontal support
$0.0890 – Key invalidation level (SL zone)
Resistance / Targets:
$0.1063 – First target
$0.1234 – Mid-term resistance
$0.1508 – Extended bullish target
Stoploss: Below $0.0890 (close below trendline)
Structure looks bullish for continuation if HOOK holds above $0.0950 and breaks $0.1063 with volume.
DYOR
Not Financial Advice

HOOKUSDT Forming Falling WedgeHOOKUSDT is currently showing promising technical signals that have captured the attention of many traders looking for high-upside crypto setups. The recent price action has formed a classic falling wedge pattern, which is widely known in crypto trading for its bullish breakout potential. This pattern combined with a healthy volume profile indicates that buyers are stepping in at crucial levels, increasing the probability of a strong upside move.
The price projection for HOOKUSDT suggests a gain of 90% to 100%+, which is an attractive risk-reward opportunity for swing traders and mid-term investors. With the broader market sentiment slowly improving, HOOKUSDT stands out as one of the altcoins gaining fresh investor interest. As the coin tests its upper trendline resistance, a confirmed breakout could set off a rally fueled by momentum traders and fresh capital inflows.
Investor sentiment for HOOKUSDT is building steadily, supported by good volume and a clearly defined breakout structure. This makes it an ideal crypto pair for traders who prefer setups with technical clarity and strong potential for explosive moves. Keep an eye on daily closes and volume spikes to validate the breakout and secure optimal entry points.
In conclusion, HOOKUSDT is one to watch closely as it positions itself for a potential reversal that could deliver solid gains. For those looking to diversify their crypto portfolio with setups ready for a breakout, HOOKUSDT deserves a place on your watchlist.
✅ Show your support by hitting the like button and
✅ Leaving a comment below! (What is You opinion about this Coin)
Your feedback and engagement keep me inspired to share more insightful market analysis with you!

HOOK/USDT – Bullish BreakoutHOOK has successfully broken out of a long-term descending trendline on the 4H chart, signaling a potential trend reversal to the upside. The breakout is backed by strong volume and price action above key resistance.
Analysis:
After weeks of lower highs, HOOK has flipped the structure by breaking the trendline and reclaiming horizontal resistance.
Price is now holding firmly above the breakout level, indicating bullish strength.
Key Levels to Watch:
Support Zones:
$0.1063 – Retest of trendline breakout (ideal entry zone)
$0.0996 – Previous structure base and strong horizontal support
Stoploss:
Below $0.0990 (invalidate breakout setup)
Resistance/Targets:
$0.1234 – First upside target (short-term)
$0.1508 – Major horizontal resistance from May
$0.1796 – Final upside target if momentum continues
Strategy:
As long as price holds above $0.1063, bias remains bullish. A healthy pullback toward support may provide a better entry opportunity for those waiting on confirmation.
Breakout traders may ride the momentum up to $0.1234+
DYOR | Not Financial Advice

Hooked Protocol Preparing 3,000% Rise, No ATH NeededA 3,000% rise on Hooked Protocol would match prices from January-February 2023, not even an all-time high is needed for this huge potential profits.
The calm before the storm
Is it calmed? In some ways it is because people are enjoying their summer vacations. The market is calm but I can feel the energy boiling under the surface. I can see, sense, feel and even hear future FOMO building up. I am already seeing the huge market growth.
How much will it take the action to intensify?
Is it possible that everything will pick up steam, so to speak, after the 4th of July. It is possible indeed. There is something about prices going up. When the market starts to rise... See, prices first will be high and then people show up. That is because people tend to be around when the action is strong. What catches the attention of retail is the news cycle, the sharing and exchanging, and for this to happen something needs to happen and what actually happens is rising prices.
We are seeing some of this but we are looking at it up-close. People that are not in the market can't see it but they will be able to see it when the altcoins start growing 300% within days and mainly when Bitcoin breaks resistance and hit a new all-time high. Two weeks maximum but I believe the market is hot now but hard to detect for those without experience. You've seen the charts in the past few weeks, you've seen how 22-June marked a new low. Similar to 7-April but higher, the start of the next bullish impulse.
There is still time but early is best
Opportunities are endless and many more will continue to develop throughout the coming weeks and days. Early is best but the market will grow for at least 6 months so we can even say that we are still early.
3,000% profits potential
Hooked Protocol here can grow 3,000% or more. Notice the size of the candles on the chart, I am using the linear chart.
On the left, the candles are big as prices go up and then start to fall. The further we go to the right, the smaller the candles. This reveals a transition. We will have big candles again in the 2025 bull market.
1,772% is a strong but easy target. 3,000% is possible but there is also 2,420% on the chart.
This is just one pair, one project, one altcoin, one opportunity, there are plenty more. Choose wisely. Cryptocurrency is here to stay. You can change your life in a matter of years, for the better.
Thank you for reading.
Namaste.

HOOKUSDT | Long Bias | Web3 Learn-to-Earn Play | (May 12, 2025)HOOKUSDT | Long Bias | Web3 Learn-to-Earn Play + Leverage Squeeze Setup | (May 12, 2025)
1️⃣ Short Insight Summary:
Hooked Protocol (HOOK) is gaining attention in the Web3 education space with its Learn-to-Earn model. While fundamentals show promise, current technicals suggest a pullback zone where leverage and spot divergence could set up a volatile move.
2️⃣ Trade Parameters:
Bias: Long
Entry Zone: $0.145–$0.140 (key support and confluence area)
Stop Loss: Below $0.130
TP1: $0.210
TP2: $0.2865
TP3: $0.4600
Final TP: $0.8668
Partial Exits: Advised at each major resistance or psychological zone
3️⃣ Key Notes:
🔹 Fundamentals: HOOK is a Web3 onboarding protocol with gamified learning (Quiz-to-Earn), backed by Binance Labs, Animoca Brands, and others.
🔹 Strong founding team from Uber, Meituan, and top fintech backgrounds.
❌ Still relatively new and competing in a crowded Web3 education sector. Regulatory risks exist.
✅ On the 4H timeframe, money is currently flowing out and spot sellers are active—but leveraged buyers are still present, increasing short-squeeze risk.
✅ Entry around $0.145 offers a high-confluence zone with a good risk-reward setup.
❌ Be careful of volatility due to low float and leverage-driven moves.
4️⃣ Optional Follow-up Note:
I’ll monitor this zone closely. If we flush into $0.145 and see a reversal, I’ll enter with strict risk management. Will update if the momentum shift happens earlier.
Please LIKE 👍, FOLLOW ✅, SHARE 🙌 and COMMENT ✍ if you enjoy this idea! Also share your ideas and charts in the comments section below! This is best way to keep it relevant, support us, keep the content here free and allow the idea to reach as many people as possible.
Disclaimer: This is not financial advice. Always conduct your own research. This content may include enhancements made using AI.

Hook USDT SWING and Scalp TradeFor spot, try to accumulate hook from here 0.1680 and 0.12, scalp trade tp 0.19 Swing TP 0.22$. If you are taking it in future then book some on 0.19 and rest on 0.22$.

HOOK breakout 50% gain potentialsSuccessfully breakout this resistant line with a short -term target of at least +10%

HOOKUSDT 1D AnalysisHOOK ~ 1D Analysis
#HOOK Buy gradually from here if you still have conviction in this coin, with a short-term target of at least 10%+ from this point.

$HookusdtNASDAQ:HOOK is strong against btc, and we’re re expecting a leg up from btc during week. Watch out for the next pump!.

HOOK/USDT Technical AnalysisThe market is showing signs of a bullish recovery, with price pushing into a key resistance zone after a strong move up. The Fibonacci retracement levels suggest that the price might face resistance around the 0.236 or 0.382 levels, where a pullback could occur. If buyers maintain control, the uptrend may continue, but there is also a possibility of a retracement to form a lower high before the next move. The RSI is climbing, indicating strengthening momentum, but traders should watch for rejection signals at resistance before confirming further direction.

Hook (SPOT)BINANCE:HOOKUSDT
HOOK / USDT
4H time frame
analysis tools
____________
SMC
FVG
Trend lines
Fibonacci
Support & resistance
MACD Cross
EMA Cross
______________________________________________________________
Golden Advices.
********************
* Please calculate your losses before any entry.
* Do not enter any trade you find it not suitable for you.
* No FOMO - No Rush , it is a long journey.
Useful Tags.
****************
My total posts
www.tradingview.com

#HOOK/USDT#HOOK
The price is moving in a descending channel on the 1-hour frame and is expected to continue upwards
We have a trend to stabilize above the moving average 100 again
We have a descending trend on the RSI indicator that supports the rise by breaking it upwards
We have a support area at the lower limit of the channel at a price of 0.1560
Entry price 0.1700
First target 0.1800
Second target 0.1906
Third target 0.2030

#HOOK/USDT#HOOK
The price is moving in a descending channel on the 1-hour frame and is adhering to it well and is heading to break it strongly upwards and retest it
We have a bounce from the lower limit of the descending channel, this support is at a price of 0.1670
We have a downtrend on the RSI indicator that is about to break and retest, which supports the rise
We have a trend to stabilize above the moving average 100
Entry price 0.1740
First target 0.1816
Second target 0.1897
Third target 0.2000

HOOKUSDT Breakdown Incoming? Key Signals Point to Bearish Move!Yello, Paradisers! Is HOOKUSDT gearing up for a major drop? The current structure suggests a strong probability for further downside as the price follows a triple three-wave pattern within a descending channel.
💎HOOKUSDT recently faced strong resistance from multiple confluences: 50 EMA rejection, Key resistance zone, Descending channel’s trendline, Formation of an "M" pattern. These factors increase the likelihood of a wave Z move downward. However, for confirmation, we need a clear breakdown of the support level with a candle close below it and high volume.
💎The broader crypto market also leans bearish, but waiting for the actual breakdown will further strengthen our probability of a successful trade.
💎Invalidation? If the price bounces and closes candle above the resistance zone, the bearish outlook gets invalidated. In that case, it’s smarter to stay patient and wait for a stronger setup.
🎖 Discipline and patience are key, Paradisers! The market always rewards those who wait for the highest-probability trades. Stay sharp!
MyCryptoParadise
iFeel the success🌴

Is HOOK About to Bounce or Break? Critical Levels to watch!Yello, Paradisers! Are we on the verge of a bullish move with HOOKUSDT, or is a breakdown lurking around the corner? Let’s dive in!
💎HOOKUSDT is currently sitting at a key support zone, and the probability of a bullish bounce from this level is high. However, probabilities in trading are never guarantees, so here’s what you need to watch for to confirm the next move.
💎If we see a bullish I-CHoCH (Internal Change of Character) or classic bullish patterns like the W pattern or Inverse Head and Shoulders on lower timeframes, the chances of a bounce will increase significantly. These patterns indicate that buyers are stepping in at these critical levels.
💎We also need to watch TOTAL2 (the altcoin market cap excluding BTC) and TOTAL3 (altcoin market cap excluding BTC and ETH). These broader market indicators provide context for altcoin sentiment and help avoid making isolated decisions based solely on one chart. Remember, the crypto market moves as a system — you can’t ignore the bigger picture!
💎If the price breaks down and closes below this strong support zone, it will invalidate the entire bullish setup. In that case, waiting for more clear and confident price action before jumping in will be the smarter move. Chasing trades after a breakdown can lead to unnecessary losses, and patience is what separates professional traders from gamblers.
🎖 This is exactly why discipline and patience are your most powerful tools in this market. If the bounce comes, it could be highly profitable, but don’t let emotions drive your decisions if the price breaks down. Staying objective and waiting for confirmations is what makes long-term winners.
MyCryptoParadise
iFeel the success🌴

HOOK USDT - LAST CALLSo ... Following up on my latest chart, I think HOOK has struggled to keep up with the enormous momentum it got
I´ll say that was something expected, not SO much, but definetly we could have saw that ahead
I think that if HOOK manages to keep up with the pennant and finally have a positive parabolic SAR, we could still be Bullish on it
If we go below 0.20 I would call it a day, and hit the brakes if you are long positioned
NFA
