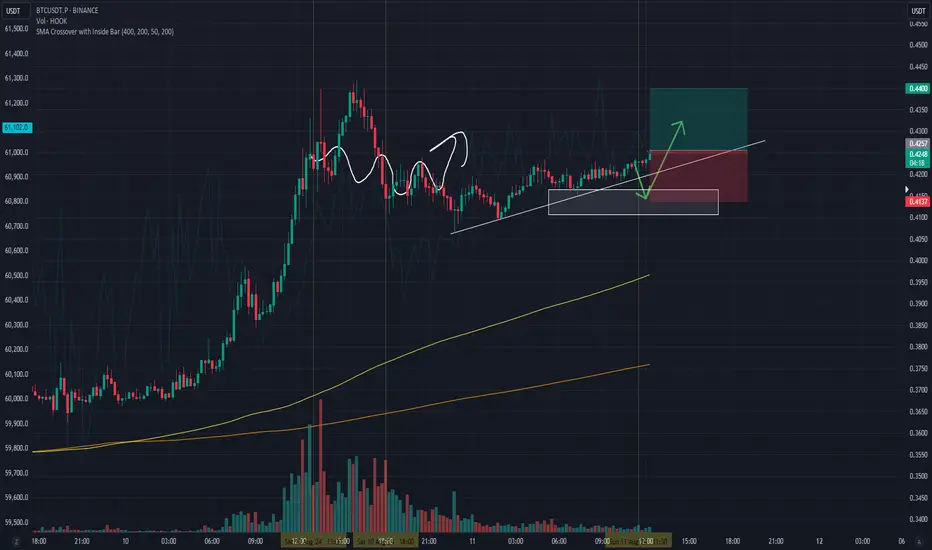
#HOOK/USDT#HOOK
The price is moving in a descending channel on the 12-hour frame and is sticking to it very well and is expected to break it upwards
We have a bounce from a major support area in green at 0.5250
We have a downtrend on the RSI indicator that was broken upwards which supports the rise
We have a trend to stabilize above the 100 moving average which supports the rise
Entry price 0.4265
First target 0.5900
Second target 0.7240
Third target 0.8600
HOOKUSDT trade ideas

Hooked Protocol --Retrace Complete?Hooked Protocol made a new high recently and decided to drop to a lower support.
A type of W shaped recovery pattern is more likely in play.
Take care now 🍀

Is #HOOK on the Edge of a Major Breakout or a Breakdown?Yello, Paradisers! Are you ready to capitalize on the next big move with #HOOK? We’ve got our eyes on a potential game-changer!
💎#HookedProtocol ( NASDAQ:HOOK ) is currently navigating a descending channel, but things are heating up as it approaches a crucial demand zone at $0.405. This level could be the catalyst for a significant bullish breakout.
💎If the price finds support here and gathers momentum, we could see #HOOKUSDT soaring towards the key supply area at $0.73. Now, this is the critical part: a successful breakout above the descending resistance could pave the way for a strong bullish run, with the next target being the major resistance zone.
💎But let’s not get ahead of ourselves—if momentum falters and #HOOK gets rejected at the supply area, we might witness a pullback. Watch closely for a potential bullish rebound from the strong support between $0.31-$0.34.
💎However, caution is key. If #HOOK slips below this support level, it could spell trouble, trapping the price within the descending channel and possibly signaling a prolonged bearish trend.
Stay Focused, Patient, and disciplined Paradisers!
MyCryptoParadise
iFeel the success🌴

HOOKUSDT 1D#HOOK is moving inside a descending channel on the daily chart. If it manages to break above the channel resistance and the Ichimoku cloud, it could trigger a 2x to 3x bullish rally. So, keep an eye on it.

HOOKUSDT Long and Short analysis / be ready for 15% price move!BINANCE:HOOKUSDT
CRYPTO:HOOKUSD
Hello Traders, At first, I was bearish on HOOK. but when the price spikes above my indicated area, I am looking for a bearish entry setup. 🎯
💥📉HOOKUDST is near important are,
as long as the price is above 0.432 area, the Bullish scenario is active. If the price stabilizes below the 0.42 level, the bearish scenario will be activated.📈💥


HOOKUSDT.PHOOKUSDT.P is in reversal mode.
Bearish divergence also shownin RSI.
We wait for the further confirmation.
It it will breakout the last HL then we will execute trade.

HOOK/USDT CAN ENTER A VOLUME BREAK ZONEDepending on the last study HOOK shows an interesting volume start which can be confirmed in the coming time frames,
We will follow this coin for the next time frames.
The last time that this coin built a trend was in FEB 2024, and it looks like Hook can show new volume.
This coin has a good chance to become a building coin.

Is a Bullish Breakout Imminent for HOOK? Here's What You NeedYello,Paradisers! Have you been tracking #HOOKUSDT? If not, now's the time! This cryptocurrency is showing promising signs of a bullish continuation from its current demand zone, and you won't want to miss it.
💎#HOOKUSDT recently broke above a critical resistance level at $0.5252, signaling a strong upward movement. This breakout is a crucial moment for potential gains. The current demand zone around $0.5528 is now our focal point.
💎If #HOOK maintains this momentum, we could see a surge toward the internal resistance at $0.7116. This level will be pivotal in determining the next phase of the market action.
💎Market sentiment also appears to be shifting, with diminishing intensity of rejections at the demand zone, suggesting a possible ease in selling pressure. If this support level holds, a bullish rebound could be imminent.
💎However, it is crucial to be cautious a breach below the strong support at $0.5037 could lead to a significant decline. This support level is critical, as it holds substantial liquidity, making it a potential point for a bullish recovery or a deeper correction.
Strive for consistency, not quick profits. Treat the market as a businessman, not as a gambler. This is the only way you will make it far in your crypto trading journey. Be a PRO.
MyCryptoParadise
iFeel the success🌴

HOOKUSDT.PHOOKUSDT.P is in reversal mode.
Bearish divergence also shown in RSI.
We did not wait for the reversal we sell at CMP

#HOOK/USDT#HOOK
The price is moving within a bearish channel pattern on the 12-hour frame, which is a strong retracement pattern and was broken to the upside.
We have a bounce from a major support area in green at 0.4000
We have a tendency to stabilize above the Moving Average 100
We have a downtrend on the RSI indicator that supports the rise and gives greater momentum, and the price is based on it to rise after it was broken upward.
Entry price is 0.4800
The first target is 0.6700
The second target is 0.7800
The third goal is 0.9240

HOOK Technical Analysis: Potential for 200% gain.Hello everyone, I’m Cryptorphic.
For the past seven years, I’ve been sharing insightful charts and analysis.
Follow me for:
~ Unbiased analyses on trending altcoins.
~ Identifying altcoins with 10x-50x potential.
~ Futures trade setups.
~ Daily updates on Bitcoin and Ethereum.
~ High time frame (HTF) market bottom and top calls.
~ Short-term market movements.
~ Charts supported by critical fundamentals.
Now, let’s dive into this chart analysis:
HOOK was under a downtrend but respected the lower support trendline and showed a decent rebound of up to 45%.
Currently, HOOK needs to break above the primary resistance, ranging between $0.6437 and $0.7172, to rally higher to the $1.16 resistance trendline.
The RSI shows a rebound from the oversold range, indicating a shift in momentum from bearish to bullish.
- Support/Entry: $0.394 to $0.483.
- Primary Resistance: $0.6437 to $0.7172.
- Higher Resistance: $1.16.
DYOR, NFA.
Please hit the like button to support my content and share your thoughts in the comment section. Feel free to request any chart analysis you’d like to see!
Thank you!
#PEACE

HOOK is bearishFrom where we entered "start" on the chart, the HOOK symbol has entered a large correction, which seems to be a diametric pattern.
Wave B has just ended and price has entered wave C. Wave C is expected to continue up to the green range.
Note that you need a trading setup to enter the position.
Closing a daily candle above the invalidation level will violate the analysis.
For risk management, please don't forget stop loss and capital management
Comment if you have any questions
Thank You

Hooked Protocol (HOOK)On the above daily chart price action has corrected 80%. A few reasons now exist to be long, including:
1) Price action and RSI resistance breakouts.
2) Price action trend reversal. Higher highs replace lower highs.
3) Support and resistance. Look left. Price action prints support on past resistance.
4) The bull flag flagpole forecasts a move to 2.50
Is it possible price action corrects further? Sure.
Is it probable? No.
Ww
Type: trade
Risk: <=6%
Timeframe for long: Yesterday
Return: Did you read the idea?

#HOOK/USDT looks heavy in 4-Hour TF!#HOOK/USDT looks heavy in 4-Hour TF!
NASDAQ:HOOK breaks the Diagonal Trendline. Wait for a successful retest in LTF to shorten it. The local support level is PWH $0.86.

#HOOK/USDT is heading towards a retest of PWL $0.85 support leve#HOOK/USDT is heading towards a retest of PWL $0.85 support level in 4-Hour TF!
Keep an eye on it. I'm expecting a pump from this support. Breaking down this level is a bearish sign for $HOOK.

HOOKUSDT 1DBuy #HOOK here and at its support zone. It may retest the trend line and then go up. Targets are:
$1.0867
$1.2066
$1.3265
Mid-term targets:
$1.4972
$1.7147
Support zone: $0.8482 ~ $0.9384

HOOK TokenThe HOOK token price trades below the key moving averages and is below its demand zone of $1 guiding bearishness on the charts

#HOOK/USDT#HOOK
The price is moving in a bearish channel on a 12-hour frame and is adhering to it well. The price has rebounded from the green zone and is expected to retest it at 0.8400.
We have a tendency to stabilize above the Moving Average 100
We have a downtrend on the RSI indicator that is expected to break higher to support the rise
Entry price is 0.8400
The first goal is 1.00
The second goal is 1.15
Third goal 1.31

HOOK/USDT shows bouncing from support and back to upward!💎 Paradisers, the recent market dynamics surrounding #HOOK have indeed been noteworthy. Currently, HOOK is bouncing from the support trendline, which aligns with historical patterns where the price has consistently bounced from this level.
💎 If this bounce proves to be valid, there's potential for the price to resume its upward trajectory, especially if it successfully breaks out above the resistance area at $1.22. The next target movement could be towards our strong resistance area.
💎 However, if HOOK fails to break out above the $1.22 resistance level and faces rejection there, it could signal a potential downward movement back towards the support trendline to establish a new momentum.
💎 A concerning scenario would be if HOOK breaks down below the support trendline, leading it to test the support area in the range of $0.7 to $0.64.
💎 In such a case, the price must bounce from this support level and reclaim the area above the support trendline. If HOOK fails to do so and also breaks below the support, it could indicate a bearish momentum, potentially leading to further downward movement.
MyCryptoParadise
iFeel the success🌴

HOOK PROTOCOL - NEW ALL TIME LOW
Call me crazy but BINANCE:HOOKUSDT will not be joining the bull run instead it will be busy on it road to creating a new ALL TIME LOW at $0.3500
PREVIOUS ANALYSIS
OTHER ANALYSIS

HOOK UPDATE - SHORT SETUP
In case you're interested in the previous analysis on BINANCE:HOOKUSDT and you are interested in taking that short here is a 5RR setup.
Although I am having a feeling price might not reach the entry precisely by tick.
OTHER ANALYSIS
