HOOK target reachedHOOK reached our first target...it was a nice pump.
●trying to find another buying level, and targets for HOOK.
HOOKUSDT trade ideas

HOOK/USDT It required bounce and to continue upward!!💎 HOOK has been capturing considerable attention in the market, currently consolidating in a zone that previously acted as resistance. Adding to this dynamic is HOOK's movement within a Bullish pennant formation in the Lower Time Frame (LTF), indicating a potential breakout. If HOOK manages to successfully break out of this pattern, the probability it could lead to a smoother trajectory toward our targeted strong resistance area.
💎 However, should HOOK fail to maintain its position above the support area or if it breaks below this level, it would be a concerning development. Such a scenario would signify a failure of the Bullish pennant formation, potentially setting the stage for HOOK to revert to a downward trend towards the strong support area.

HOOK to 3.2 $ Very Soon
this chart is based on Elliott wave theory and also according to DAW theory .. chart repeat it self again.
if you looking to the chart you will find that we are going to repeat the same move to go to 3.2$ at least
Targets:
🎯1st Target: 2.1 $
🎯2nd Target: 3.2 $

Buying some HOOK here before it moves up further!Entry: 1.1355 - 1.0721
Targets: 1.25 - 1.43 - 1.56
#HOOKUSDT #BTC #Bitcoin #BTCUSDT #Crypto #cryptocurrency #investment #binance #bullrun #altcoins


HOOKUSDT long positionHOOK has been forming a bottoming structure .
We still may get a pullback to the upsloping support, but if HOOK just pump from where it is now, we won't be surprised either.
2 targets for Q1 2024:
1,95$
2,40 $
Good luck


buy some hooki have set the target price only by market cap
entry only 1-5 % from your total investing

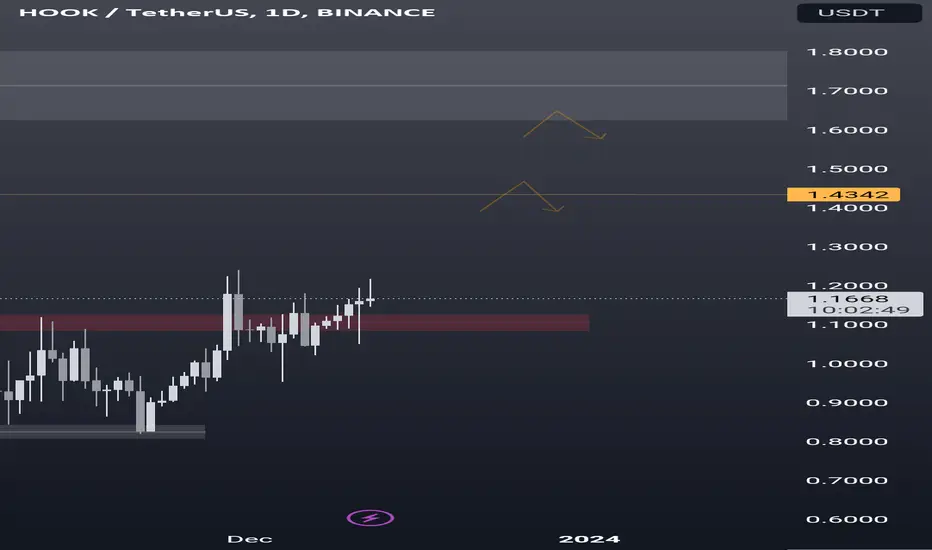
Hook HTF analysis, Main target?●Hook is set to go for $1.4342, $1.6261 & $1.7134
●Bullish on Hook as long as we don't get any weekly candle closing below $1.1050 & $1.0865.
●HTF target will be 1.6262 level the main target
Long Hook USDTHOOK USDT follow trend-line and break supply zone because of volume...
Long HOOK USDT
Entry: 1.18, 1.15
SL: 1.12
TP: 1.25, 1.29.5

HOOK daily chart with Rounded BottomHOOK daily chart
121.5M Market Cap
aggressive entry at current price
lower entry zone on chart
a safer entry would be break / retest of weekly resistance
( 1.2512 ) ... the website has " Hot " words like " AI " and " Metaverse "
they also have a Staking option ... just to name a few things

HOOK/USDT Break the Descending Channel, Bullish Momentum ??Yello Paradisers, Attention Paradisers!
💎 HOOK has successfully break out of its descending channel, backed by impressive volume, and is currently in a retesting phase, aiming for further upward action.
💎 Prior to this breakout, HOOK made several attempts to breach the supply zone but was consistently rebuffed. However, just yesterday, HOOK shattered both the supply and the descending channel's resistance trendline, marked by a robust green candle. This signals bullish momentum for HOOK.
💎 Be on the lookout: this bullish narrative could be nullified if the price closes below the designated Bullish Invalidation level.
Keep those charts refreshed and stay tuned for more crypto updates! 🌴

$HOOKinvalidation below red line or 93ish
targeting yellow line above
rsi is turning up and has a long way to go before it gets overbought..
possible flush before the week starts so hop on if you ain't in it then closer to the red line the better

HOOK/USDT BullishTRADE ALERT! HOOK
Ticker: HOOK/USDT
Entry:1.1100-1.1160
Take Profit: 1.25-1.30
Stop Loss: 1.0200
Risk to reward: 1:2
Technical Thesis:Hook moving in a symmtrical traingle formation.
If price breaks out with good volume then we can look for long.A good breakout is needed before going for long.

Hook looks ready The structure of Hook/usdt looks highly bullish. I anticipate the price to potentially surge by at least 40-100% in the upcoming days.
Please do your own research (DYOR)."

Long Setup Opportunity for HOOKUSDTTrade Setup Overview:
I've identified a compelling long setup for the HOOKUSDT crypto pair, presenting an excellent opportunity for potential profits.
Entry Point: 1.01
Stop Loss: 0.92
Take Profit: 1.313

HOOK RETURNSBack to $HOOKUSDT. In the past months, all the prediction from top to bottom vice versa have been called and right now I believe according to technical analysis (Elliott Wave and Classical) we are either in a new trend entirely (long term bullish) or we are in some kind of correction (temporal bull run).
Hook should start dropping from this moment at the resistance of the ascending channel to the support to complete wave C of wave X-yellow.
It is too early to place an invalidation level just at the current swing high because price might still retest there even though it is expected to go down in coming days by at least 7%, however I will keep updating.

Hook 1d met our analysis and very bullishThis is an update with this harmonic analysis
If it maintains the level C then, expect a move to point d between the two green lines
Hope someone got some gains so far!
All the best insha Allah!

🔥HOOK Is Breaking the Wedge: This Fresh Altcoin Has PotentialHooked broke the wedge. The test of the wedge will be a bullish signal and return to the wedge will be strong bearish signal. Also the test of $1.04 will be the bullish signal as well.
$1.04 and 2.6 are the key resistance levels and the main targets for Hooked.
As you remember guys, this is just the local targerts and it will grow much in price during the Bitcoin bull market.
💥$44M is very low cap for this altcoin on Binance
like❤️ and follow
Check the links and get a BONUS🎁 from me👇


HookUSDT Descending Correction with Key Levels in SightHookUSDT remains in a corrective phase, seemingly confined within a descending channel. An immediate resistance zone is on the horizon, closely aligning with a significant trend pivot at 1.0928.
Our projection suggests a touch of this zone before embarking on a descent to complete the correction's remaining leg, aiming for the BULL DEMAND ZONE.
We should tread cautiously in this area. If the price persists in its downward movement, we might witness a test of the Potential Extended Bearish Target.
However, it's paramount to observe the price's behavior upon reaching the immediate resistance. A breakthrough to the upside could signify a trend reversal.
Always remember to trade with discretion and ensure thorough analysis. If you found this analysis helpful, please consider leaving a like. Your support is appreciated!

#HOOK/USDT - Long - Potential 26.02%Strategy: Long
Exchange: BINANCE
Account: Spot
Entry mode: Market order in range
Invest: 2.5%
Exit:
⎿ Target 2 : 1.4150
⎿ Target 1 : 1.2612
Entry: 1.1207
Stop: 0.9932
Breakout active.

Hookusdt letsgoooo🚀🚀🚀🚀🚀🚀🚀🚀🚀🚀🚀All the downsides are opportunities to buy.
With leverage 10 and 20 preceding towards the specified goals.
