ACB Bank: A Powerhouse for Value and Growth Investors?Historical Analysis Suggests a Potential Breakout and Long-Term Accumulation Opportunity in ACB Stock
Examining ACB's historical monthly chart reveals a pattern of successful breakout from cup formations on two occasions. Based on this historical trend, a similar scenario is anticipated for the current third cup formation. Following the recent breakout, ACB is currently undergoing a correction phase, retracing towards two critical support zones highlighted in blue around the 15-24k range. These support zones present a compelling opportunity for long-term accumulation, aligning with the completion of Elliott wave 5 and preceding a potential corrective wave following ACB's target achievement.
ACB trade ideas


ACB-B Corrective wave in Monthly chartACB is in its B corrective wave when we look at the monthly chart. It's Elliott principle that there is a possibility for a B expanded flat where the end point of B might be over the peak 5th wave, then it will move down following a C with 5 waves downward in smaller wave level (W frame)

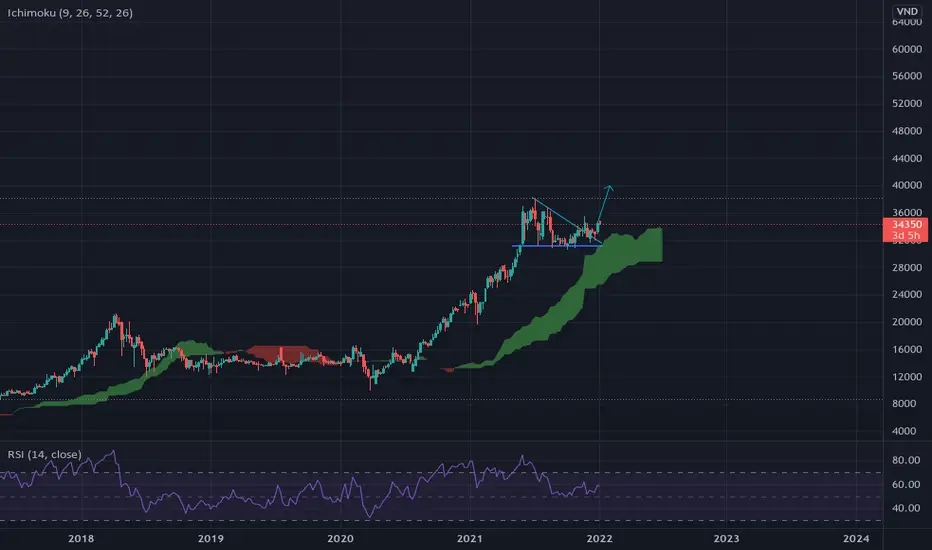
ACB-LONG-TERM- Happy new year 2022. This is my idea for ACB in long-term.
- Buying range : Current price.
- Stop--loss : Below 30.
- TP: 40-42