Saucepan activationHi Holonauts!
A nice saucepan or teacup is forming at this moment. We are about the fly!
HOTUSDT trade ideas

#HOT #Holochain retracement I'm not a TA "expert" here is a simple idea following btc market and what I think

$HOT #Holo Trading IdeaHOT Holo needs to close above this red supply zone to get that buying strength to keep going upwards. The next target could be a $0.007377 level DYOR.

HOT CAN SHOW HISTORICAL INCREASEHot seems to have an interesting volume, which could increase with the coming time frames, we will follow the trend to see for new changes in data.
will the trend follow FLoki, SHIBA's last hype? The chance is there high.
we did update before about Floki with same update

HOTUSDT_1WHello 👋
📊 Analysis of HOTUSDT
The analysis style is based on price action levels.
According to the past and due to the failure of the upward trend line, the market can enter a new rising wave
Main support 0.002000
Target 0.150000
💰 6000% growth

Hot Looks HotHi Guys
Hot/USDT looks very bullish and ready to breakout of this falling wedge .
Actually it broke out an important trend line ( white trend)
till now and before the close of the weekly candle , I see a bearish divergence on RSI maybe it will cause a fast correction next week.
Even if it did some correction to retest the white trend line again it still very bullish.
Plz DYOR.
Disclaimer: This article is for informational purposes only and not financial advice. Conduct thorough research and consult with professionals before making investment decisions.
Good luck.

HOTUSDT.PHOTUSDT.P is in bearish trend.
Potentially printing LH and LL.
Double Top reversal pattern also form.
We sell short at CMP.

HOTUSDT | BREAKOUT ALERT!!Hotusdt has submitted a breakout of inverted head and shoulder on weekly scale. If bulls manages to sustain above neckline, it has a potential of giving hefty gains.
Manage your risk accordingly.

HOLOCHAINGood morning
what?? montly.
if you can see bollinger banda are very close, Rsi is above 50 line.
(i wont explain, what means this 2 things)
my espectation is that holo will reach 0.03$ again.
-take your time and do your own reseach-
dont blane me when you were rich

HOT/USDT, change of characterHello my friends. I have returned after many years of silence.
I hope everyone is doing well.
Hot is just sitting on the edge of the ICloud. Time to start looking. I only trade longterm these days and most of my charts are weekly time-frames.
So, the Tenkan-sen (Conversion Line): green line is about to cross the Kijun-sen (Base Line): red. This would be a strong signal for longer-term trends change. Kumo (Cloud): is still red but edge is facing upwards. Thee chikou Span is still under cloud and is edging free of past trend noise. This could be an interesting time to monitor and start thinking about putting a few percent of your portfolio into hot. To play it safe, wait until price has moved out and retested the saucepan handle, wait until the Kumo cloud has rolled green and the Chikou Span is free from past noise and pointing skyward. Once these options are filled buy some hot at each zone until trend reversal. Price is also out of TAD see screen grab below. I have had good long term results following these two chart indicators and only enter when all conditions are met and those conditions are edging closer for hot. Okay, good luck all.

✴️ Holo Bull-Market + New ATH (296%-747% Growth Potential)Holo (HOTUSDT) is already in a bull-market.
➖ The bear-market is depicted here as a huge ABC correction.
➖ The consolidation phase is depicted here as an ending diagonal.
➖ The bull-market is what is happening now, higher highs and higher lows.
While the action is already in progress, there is plenty of room and time left for additional growth.
👉 While 747% might seen high, this is still below the old All-Time High.
HOTUSDT (Holo) will move to hit a new All-Time High in early 2025 or late 2024 ... Mark my words.
Wishing you profits and success with your life and trades.
Thank you for reading.
Namaste.

HOTUSDTHM signal v3.0 (High momentum) spotted. Looking good with previous wave up with increasing volume and momentum.
- Heathy retracement and support well at good level @ 0.002894-0.002942
- Trending slow and steady if able to hold above the support zone
It is at extremely good reward to risk level now if able to hold above the support level.


HOT Cup and HandleLet se how far HOT will run !
The Team introduce New Tech about Holochain in Danver.

HOTUSDT IDEAUPDATE
Broken Falling Wedge in 3D Time frame Positively.
If holds over broken level, 100-140% increase in price may be seen .
COIN DETAILS
The live price of Holo is $ 0.00239 per (HOT / USD) with a current market cap of $ 413.30M USD. 24-hour trading volume is $ 12.07M USD. HOT to USD price is updated in real-time. Holo is +0.33% in the last 24 hours with a circulating supply of 172.93B.

HOTUSD 1WLSE:HOT ~ 1W
#HOT Successfully Breaking this Resistance Line, Bulls Seem to be Taking Control, Buy Gradually from Here, Target at least 20%++

HOTUSDT 3DBuy a bag of #HOT and keep it patiently. This is one of the coins with potential of 350% target. I think Golden Cross will occurs soon on 3-days timeframe. So be ready for the fly🚀 if it happen.
🎯Targets are:
$0.002438 $0.003357 $0.004844 $0.005902 and $0.007250


HOTUSDT1. trend line not breakout.
2. prices above bol band.
3. 4 hr, daily, weekly RSI higher
4. ADX trending
5. Avg. volume good.
6. buy range 0.0017-0.0019

Starting to hit that hard 0.002. Nice moves to comeHOT is hitting the 0.002 levels again. With current conditions of the market we can expect some nice moves to make it a new supporting level.

Long from Day level, accumulation before level, free zone afterLong from Day level, accumulation before level, free zone after

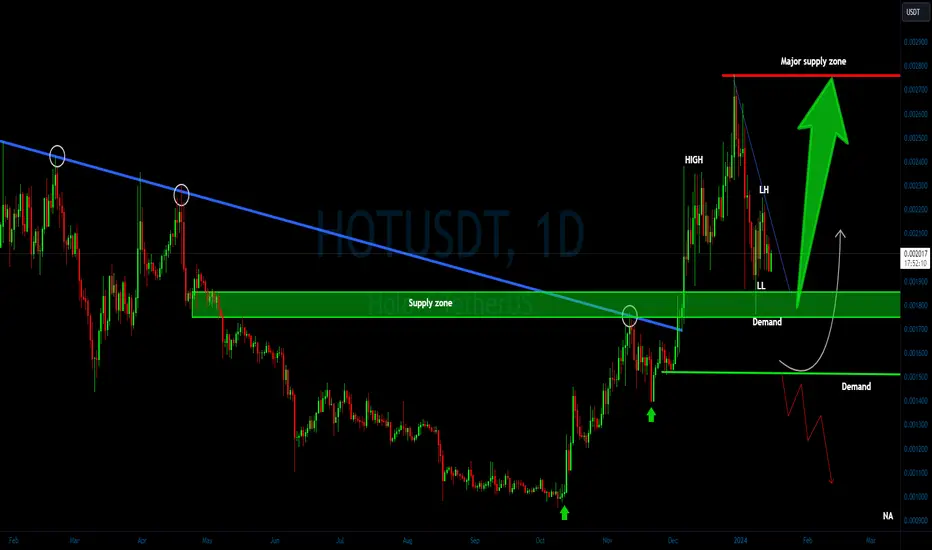
HOT/USDT upward momentum ? 👀🚀 HOLO Today Analysis💎 Paradisers, observe the current pattern of #HOTUSDT, which is showing promising signs of a bullish continuation from its current demand zone.
💎#HOLO has recently been on a downward path, marked by lower highs and lower lows, following a rejection from its supply zone. This trajectory suggests a strong possibility for a bullish turnaround, particularly once the price reaches the demand level at $0.001752. If #HOT manages to maintain its momentum at this critical juncture, we could witness a significant bullish leap.
💎 However, as astute traders, we also keep an eye out for alternate bullish rebound points. Should the aforementioned demand level not hold, the next key area to watch is the demand level at $0.001517. This level is notably significant, having previously spurred a robust bullish response, and is backed by considerable liquidity.
💎 Staying vigilant and adaptable is key, as the evolving market conditions may necessitate shifts in our trading strategy.
The Aireport is HOTHappy New Year!
We're analyzing Holochain using AIREPORT, a strategic navigation tool created to assess digital asset value and positioning. There's plenty to be excited about! To begin, let's use one facet of the app to evaluate 'cool air' price support for a favorite project:
s1 $0.002285
s2 $0.001960
s3 $0.001429
Cheers to a great 2024.
Aireport version c2485308f032e8cee4be4360d9bde92923f45f6b
