pull back of HK50 1. bearish BOS
2. after the bearish breakout retest did not go back to the last breakout momentum.
3. tend to sell around 25417 and TP 25212
HSI trade ideas

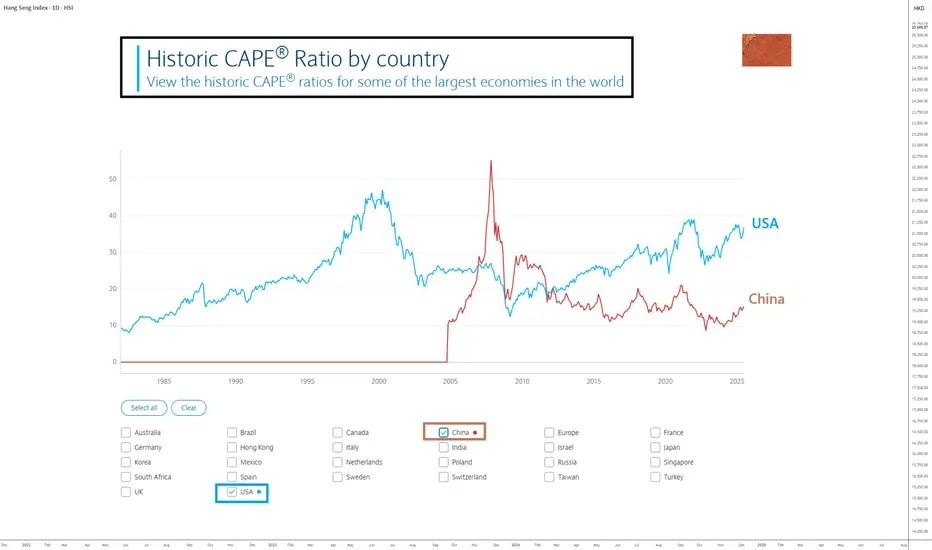
CHINA: Catch-Up Potential Remains AttractiveAs the U.S. stock market trades at all-time highs and has returned to its valuation levels of late 2021 (before the 2022 bear market), it may be wise to look at the Chinese stock market as a way to diversify your portfolio.
Regarding the analysis and potential of the S&P 500 Index, I encourage you to read my latest forward-looking study by clicking on the image below. Don’t forget to subscribe to our Swissquote account to be notified every morning when our new daily market analysis is published.
Let’s now turn back to the Chinese stock market. I believe Chinese equities still offer medium to long-term upside potential, both technically and fundamentally.
1) Strong catch-up potential from a fundamental valuation perspective
The Chinese stock market presents an interesting diversification opportunity from a valuation standpoint, with a Shiller PE ratio (CAPE) of 15 compared to 36 for the S&P 500.
Chinese equities are significantly cheaper than U.S. equities and also benefit from an ultra-accommodative monetary policy from the People's Bank of China and an expansionary fiscal policy by the Chinese government. These are key fundamental factors that support strong upside potential for Chinese equities.
2) From a technical standpoint, the ATH is the natural target for Chinese indices
Focusing on the technical analysis of the Shenzhen Composite Index (weekly chart), the setup is clear: a trading range between support at 7,500 points and resistance at 16,000 points. The market has recently built a bullish reversal pattern at the lower bound, making the upper range the natural technical target.
3) Yuan strengthening in Forex is a positive signal for Chinese equities
Finally, one more factor supports Chinese equities from a diversification angle: currency effect. The Yuan Renminbi is technically strengthening, and the USD/CNY pair has just rejected long-term resistance. As a result, international investors could benefit from a stronger CNY in the coming months.
DISCLAIMER:
This content is intended for individuals who are familiar with financial markets and instruments and is for information purposes only. The presented idea (including market commentary, market data and observations) is not a work product of any research department of Swissquote or its affiliates. This material is intended to highlight market action and does not constitute investment, legal or tax advice. If you are a retail investor or lack experience in trading complex financial products, it is advisable to seek professional advice from licensed advisor before making any financial decisions.
This content is not intended to manipulate the market or encourage any specific financial behavior.
Swissquote makes no representation or warranty as to the quality, completeness, accuracy, comprehensiveness or non-infringement of such content. The views expressed are those of the consultant and are provided for educational purposes only. Any information provided relating to a product or market should not be construed as recommending an investment strategy or transaction. Past performance is not a guarantee of future results.
Swissquote and its employees and representatives shall in no event be held liable for any damages or losses arising directly or indirectly from decisions made on the basis of this content.
The use of any third-party brands or trademarks is for information only and does not imply endorsement by Swissquote, or that the trademark owner has authorised Swissquote to promote its products or services.
Swissquote is the marketing brand for the activities of Swissquote Bank Ltd (Switzerland) regulated by FINMA, Swissquote Capital Markets Limited regulated by CySEC (Cyprus), Swissquote Bank Europe SA (Luxembourg) regulated by the CSSF, Swissquote Ltd (UK) regulated by the FCA, Swissquote Financial Services (Malta) Ltd regulated by the Malta Financial Services Authority, Swissquote MEA Ltd. (UAE) regulated by the Dubai Financial Services Authority, Swissquote Pte Ltd (Singapore) regulated by the Monetary Authority of Singapore, Swissquote Asia Limited (Hong Kong) licensed by the Hong Kong Securities and Futures Commission (SFC) and Swissquote South Africa (Pty) Ltd supervised by the FSCA.
Products and services of Swissquote are only intended for those permitted to receive them under local law.
All investments carry a degree of risk. The risk of loss in trading or holding financial instruments can be substantial. The value of financial instruments, including but not limited to stocks, bonds, cryptocurrencies, and other assets, can fluctuate both upwards and downwards. There is a significant risk of financial loss when buying, selling, holding, staking, or investing in these instruments. SQBE makes no recommendations regarding any specific investment, transaction, or the use of any particular investment strategy.
CFDs are complex instruments and come with a high risk of losing money rapidly due to leverage. The vast majority of retail client accounts suffer capital losses when trading in CFDs. You should consider whether you understand how CFDs work and whether you can afford to take the high risk of losing your money.
Digital Assets are unregulated in most countries and consumer protection rules may not apply. As highly volatile speculative investments, Digital Assets are not suitable for investors without a high-risk tolerance. Make sure you understand each Digital Asset before you trade.
Cryptocurrencies are not considered legal tender in some jurisdictions and are subject to regulatory uncertainties.
The use of Internet-based systems can involve high risks, including, but not limited to, fraud, cyber-attacks, network and communication failures, as well as identity theft and phishing attacks related to crypto-assets.
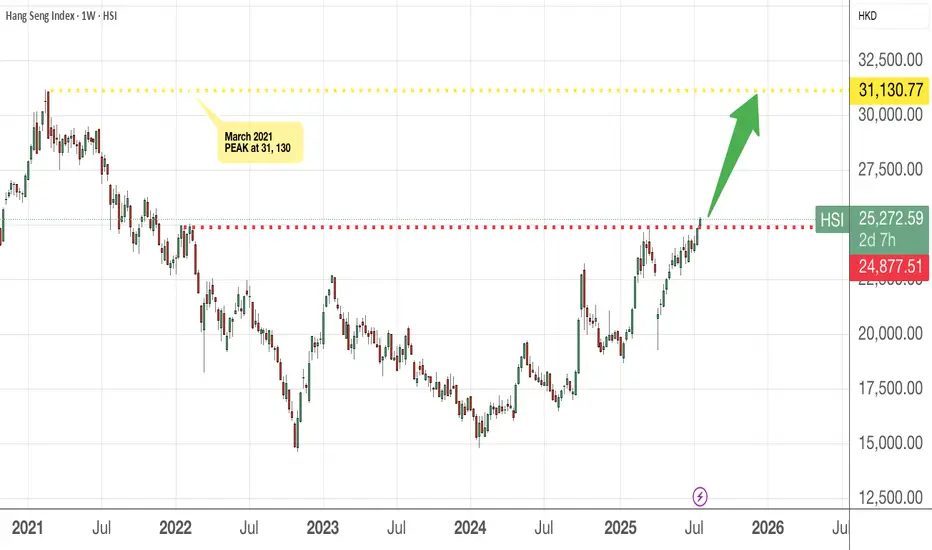
HSI has finally cleared the 25,000 level !!!!Congrats to all who are invested in the HSI index , ETF or individual stocks in HK. You should be smiling as the index crossed the 25k mark.
The next level I am looking at will be 27k mark and this will not be a straight line (as usual). Buy on pullback.
Of course, there are still many who think HK/China markets are not investable, to each his own. Everyone is entitled to your own opinion and you may have a different risk profile, time horizon and way of looking at market.
To those on board, let's ride it higher to the moon, haha!
Dont predict&anticipate the market - ask indicators for hints! Hello everyone! how was the HSI trade so far?
Apologies for not updating as I was allowing myself to take a pause journaling my trade also to pay attention on my own personal growth journey. However, am continue to trade HSI in sustainable and profitable way and have had trying and test using different combination of indicators that bring quite positive results since.
Sharing this with anyone that reading this.
Please note that this is just for my own experiences and please DYODD.
For Swing Trade Test: (some steps to consider for entry set up - setting your time frame)
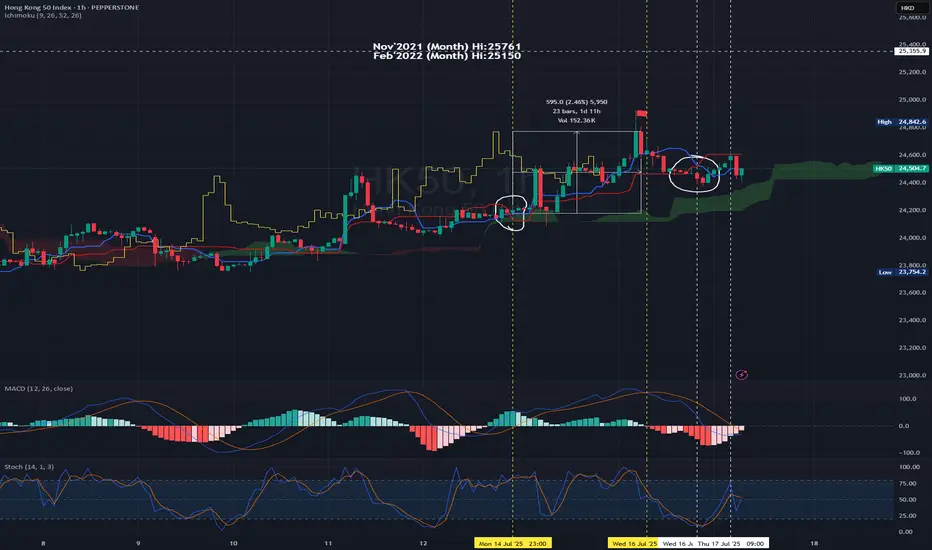
E.g using 1H Chart - 14Jul2025 23:00
MACD - entering the above zero line - it breaks above zero level on the next candle. Turned bullish confirmation.
Using Ichimoku Cloud for trend confirmation.
Once the MA9>MA26 the blue line crosses above red line (circled in white). This is a bullish confirmation and it is trading above green cloud.
You may pay attention to set your entry point.
Set Up : on the next candle open - you may open Long position - 24204.90 Set SL with R/R Ratio 1:1 or 1:1.1-1.25 (or in accordance to your risk appetite or carry out backtest and to be realistic)
Taking Profit : You may pay attention to be more aggressive to TP only when the MACD is forming DeadCross i.e 16Jul2025 11:00 (using the same timeframe chart).
For the reversed side it's the same methodology. But it's recommended to Short if and only if when the candles are closed below cloud + MACD is on the bearish zone.
So, in this case, I will not open short position as it's not the normal underlying HSI trading hour, so we wait till the underlying normal trading hour commence.
Today HK50 PEPPERSTONE:HK50 open at 24567, you may decide if you would to short and setting SL and TP.
From chart, you may open short position with R/R : 1.1.1 (TP : 24:400; SL : 24772) Entry: 24596 (the next hour candle at 10:00, of course you may cross check with shorter time frame to 'catch the high' 😂)
Trade for profit requires persistency and consistence.
There is quite a wide range to trade in between the movement.
Buy into Support Sell at resistance.
Set your TP/SL & protect your capital.
at point of writing ✍️: the Index uptrend mode is on track.
currently on D Chart -
🗝️ Resistance Level : 24600-24700
🗝️ Support Level : 24370-24400
🗝️ Strong Support Level : 24030-24300
Higher Hi🚩point marked in Chart
21May2025 -23909
11June2025 -24430
25June2025 -24531
16Jul2025 - 24842
?? ??2025 - 25907 Target
Opinion: continue Bullish and shall breaks the recent Hi of 24900 and target could break 25200-25750 pretty soon (the Gravity Line upper band).
The Index is now on the intermediate bullish trend (not far off from Gravity line and not yet touch the Gravity Upper band or beyond for D chart) - Shall publish this indicator.
From previous posts:-
W Chart:- HSI continues its Bullish mode with strong pullback! Recovery could expected to see in end Jun - early Jul'25.
14Jul2025 -
at point of writing ✍️:
Perhaps it shouldn't been said as recovery but continue the uptrend.
As we can notice from the latest chart it seems to continue its uptrend momentum even MACD have had curving down after deadcross formed 12May25.
The MACD signal line staying above zero level.
Continue the Long call for HSI with the forecast and repetitive of history the next 4-6 weeks might be a good profit to hold Long position.
🚨However, please take note that the index is moving beyond the Gravity upper brand on W chart which we should monitor closely to TP and enter again for healthy retracement.
🎯 Reminder: For long term (6-18 months) continue to accumulate China & HKG for the potential upside for the year! All retracement is a good entry point. Again, everything is impermanence. Manage your risk, position sizing. Take only the risk that you can afford.
For HSI HSI:HSI
Recent Hi : 16Jul2025 - 24867.81 (trying to test the resistance at 19March2025@24874)- this ¬6.58pts seems took quite a while to break. Let's be patience.
🔎 DYODD and don't listen to anyone.
Invest in yourself, do some study and learn along the way while you trying to verify or finding the answer if to start invest in CHN/HKG markets.
If you don't know how or where, you may ask Deepseek/Chatgpt for most reputable Trading courses nearest to you.
Let's follow your own zentradingstrategy , continue to trade; a strategy is a raft—cross the river, but do not carry it on your back forever — Stay flexible. No method is permanent. Adapt, let go, grow.
** Please Boost 🚀, FOLLOW ✅, SHARE 🙌 and COMMENT ✍ if you enjoy this idea!
Share your trading journey here to encourage the community and friends who pursing the same journey.
(UPDATE) Hong Kong rally is evident to 26,944Hong Kong is shaping up nicely for upside.
We did this analysis in June and now it has broken above the breakout point and is showing signs of a rally.
🧧 1. Mainland Money Flood
Chinese investors are pouring cash into Hong Kong stocks, hitting record levels.
🚀 2. Big IPOs
Huge listings like Shein and CATL are reviving market excitement.
🤖 3. AI & Tech Buzz
Hong Kong’s tech giants are flying thanks to the global AI hype.
And technically it's looking great.
Cup and Handle
Price>20 and 200
Target 26,944
Disclosure: I am part of Trade Nation's Influencer program and receive a monthly fee for using their TradingView charts in my analysis.

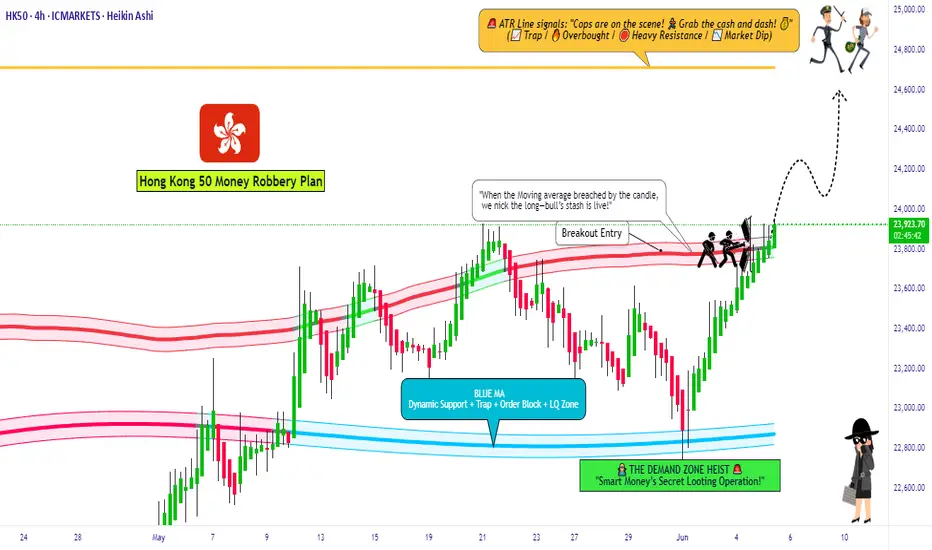
HK50 Index Robbery Plan – Bulls in Control, Load Up🚨💸💥**HK50 MONEY HEIST ALERT – Thief Trading Style Entry Plan!**💥💸🚨
"Swipe the Trend, Rob the Risk – The Hong Kong Vault is Open!"
🌍🌎Hey there, Global Money Movers, Heist Planners & Market Robbers!🕵️♂️💰
Welcome to another high-stakes operation brought to you by the Thief Trading Style – where strategy meets chaos, and profits are earned with precision. 🏴☠️📊
🎯 Mission Brief: HK50 Index Robbery – Long Entry Blueprint
Based on our exclusive blend of technical & fundamental analysis, the HK50 (Hong Kong Index) is entering the Loot Zone – bullish bias detected and price action confirming a strategic long opportunity. Here's how we execute the plan:
🔓 ENTRY – The Vault is Open!
🎯 Strike anywhere near recent swing lows/highs on the 15m or 30m timeframe.
💡 Ideal Entry Zones: Closest bullish structure or reversal support.
📌 Tip: Set alerts at key reaction zones – timing is the true thief’s edge.
🛑 STOP LOSS – Escape Hatch Point
🛡️ SL placed below nearest swing low on the 4H timeframe (~23640.0).
💡 Adjust based on your risk tolerance, lot size, and trade stacking.
🏁 TARGET – The Getaway Route
🎯 TP zone: ~25200.0
🚀 Optional: Use Trailing SL to maximize robbery exit on spikes or trap fails.
💬 “Escape before target” if market sentiment flips or volatility surges.
🧲 Scalper Alert: Ride the Bull Only!
💵 Scalping allowed on buy side only.
If you’ve got capital power – go direct. Otherwise, join the swing thieves and ride with momentum. 📈💣
🧠 Why Bullish? | Heist Justification
📊 Current momentum supported by:
🔎 Technical Trend Reversal Patterns
📉 ATR exhaustion near previous downside levels
📰 Positive Macro, Global Cues, & Institutional Sentiment
👉 For the full scoop – combine this with:
📰 COT Data & Market Sentiment
🌐 Intermarket & Geopolitical Outlook
📈 Index-Specific & Seasonal Cycle Studies
Stay ahead, rob smart! 💼💼
⚠️ Risk & News Alert – Don’t Get Caught!
🔔 Avoid entries during major news drops!
✅ Use trailing stop-losses on running trades.
🚷 Protect your loot at all costs – market volatility is the real SWAT team! 🚓
💥Support Our Robbery Crew!
📢 Smash the Boost Button 💣💥 to support the Thief Trading Style revolution!
Together, we rob with discipline, plan with clarity, and exit with satisfaction.
💰Let’s stack profits, not just candles. 📈🤑
📝 Disclaimer:
This is a high-level market outlook, not financial advice. Adjust based on your capital, risk tolerance, and analysis. Always monitor your trades and adapt to the ever-changing market landscape.
Follow for more Heist Plans – this is just the beginning! 🕶️🔐
**See you at the next vault…**🚁💼📈
#ThiefTrading #HK50 #MarketHeist #IndexAnalysis #BullishBreakout #SmartMoney #ScalpersWelcome #SwingTrading #TechnicalAnalysis #RiskReward #TradingViewElite #ProfitWithStyle

Will China's strong growth and ongoing stimulus lift the HK50?
Despite US-China trade tensions and weak domestic demand, China’s GDP growth has surpassed its 5% target for the first half of the year. According to the National Bureau of Statistics, Q2 GDP grew 5.2% YoY, with authorities noting that stimulus measures aimed at boosting consumption had some effect. Reflecting this momentum, Morgan Stanley raised its 2024 China growth forecast from 4.2% to 4.5%, while Deutsche Bank revised its outlook to 4.7%, a 0.2 percentage point increase.
HK50 maintained its steady uptrend, marking a new 4-month high. Both EMAs widen the gap, indicating the potential continuation of bullish momentum. If HK50 breaches above the recent high at 24600, the index could gain upward momentum toward the next resistance at 24900. Conversely, if HK50 breaks below the support at 24100, the index may retreat to 23730.

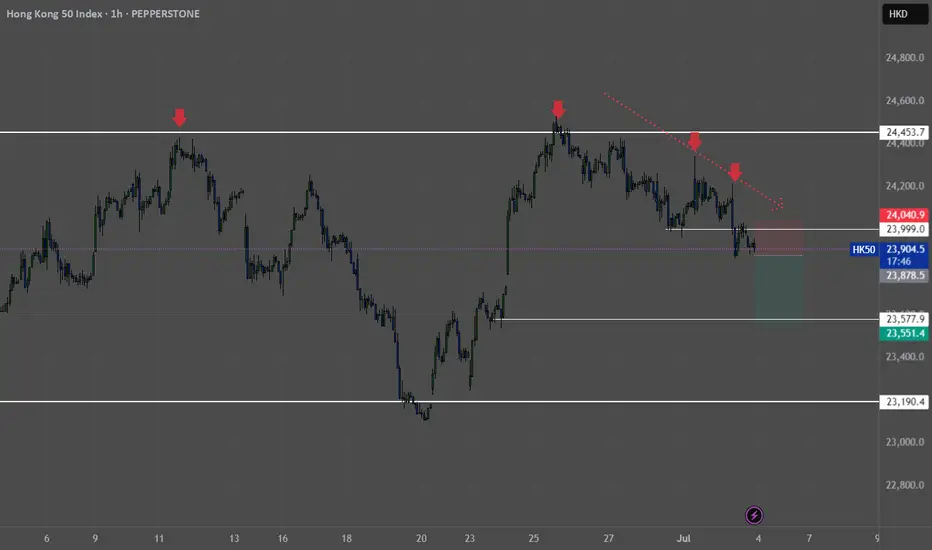
HK50 - H1 - ShortDirection - downwards rejection off 25000 level on the daily, and price moving back into the range.
Level - Price broken support and retested the 24000 level.
Price action - Multiple pin bar rejections off the daily level and hour levels.
UPDATE The future of Hong Kong is here and ready to rally 26,944Have you noticed the developments in China lately?
TOp of the market buildings, technology, self driving train stations, delivery drones and flying cars.
Out of a futuristic movie - but in reality.
It seems like China is breaking away from the dependency to produce for America, and is showing the signs of growth, development and economic independence.
And fundamentally it is looking great too.
🧱 Mainland Money Surge
Mainland Chinese investors have poured a record $90 billion into Hong Kong stocks in H1 2025, boosting liquidity and narrowing the valuation gap with A‑shares
🚀 IPO Wave & Tech Strength
A booming IPO pipeline—including DeepSeek, Shein, CATL—has lifted market sentiment, while tech giants like Tencent, Alibaba, Xiaomi ride the AI growth wave
🤝 Trade Truce Optimism
Reduced U.S.–China trade tensions, including tariff de‑escalation and diplomatic overtures, are powering a broader rebound in risk assets across Hong Kong
🏦 Monetary Tailwinds
Expectations of U.S. rate cuts and continuing PBoC easing are lowering borrowing costs and lifting dividend‑yield plays in banking and property
📈 Market Leadership & Momentum
With a ~20 % YTD gain, the Hang Seng is outperforming mainland China, and analysts expect this victory lap to keep going as global investors re‑orient into Asia
As this is an update the setup remains the same and I guess is just waiting for that boost catalyst to take it up
The Cup and Handle pattern remains with the price needing to break above the brim level and for the price to continue above 20 and 200MA the target is still 26,944.
Disclosure: I am part of Trade Nation's Influencer program and receive a monthly fee for using their TradingView charts in my analysis.

30.06.25 Morning ForecastPairs on Watch -
PEPPERSTONE:HK50
FX:EURJPY
FX:GBPJPY
FX:GBPUSD
A short overview of the instruments I am looking at for today, multi-timeframe analysis down to what I will be looking at for an entry. Enjoy!

The HK50 Robbery: Can You Grab the Cash Before the Cops Arrive?🚨 HK50 "Hong Kong 50" HEIST ALERT: Bullish Loot & Trap Escape Plan! 🚨
🌟 Hi! Hola! Ola! Bonjour! Hallo! Marhaba! 🌟
Dear Money Makers & Market Robbers, 🤑💰💸✈️
Based on 🔥Thief Trading Style🔥 (technical + fundamental analysis), we’re plotting the ultimate heist on the HK50 "Hong Kong" Index Market Cash market! Our master plan focuses on a long entry—targeting the high-risk ATR Zone (overbought, consolidation, potential reversal). Beware: Bears are lurking, and traps are set! 🏆💸 Book profits fast, stay wealthy, and trade safe! 💪🎉
🔓 ENTRY: The Vault Is Open – Swipe the Bullish Loot!
Buy Limit Orders: Place within 15-30min (recent swing low/high).
Alert Recommended! Don’t miss the heist.
🛑 STOP LOSS: Escape Route
Set near the latest swing low or below 4H MA (~23500.00).
Adjust based on risk, lot size, and multiple orders.
🎯 TARGET: 24700.00 (or Run Before It Hits!)
Scalpers: Only long-side plays! Use trailing SL to lock profits.
Swing Traders: Execute the robbery plan patiently.
📡 MARKET INTEL: Why HK50 "Hong Kong" Index Market is a Bullish Target
Fundamental Drivers: Macro trends, COT data, geopolitics, sentiment.
Intermarket & Index-Specific Factors in play.
👉 For full analysis, check the linkss below! 🔗🔗
⚠️ TRADING ALERTS: News & Position Safety
Avoid new trades during high-impact news.
Trailing SL is a MUST to protect profits.
💥 BOOST THE HEIST! Hit Like & Follow!
Support the plan → More profits → Easier robberies! 💰🚀
Stay tuned for the next heist! 🤑🐱👤🤩
Hong Kong 50: Bulls Back in Business Above 23,700Monday’s bounce from support at 23,200 has seen the Hong Kong 50 push above minor resistance at 23,700, generating a potential long setup to play the broader improvement in risk appetite seen in recent hours.
Longs could be initiated above 23,700 with a stop beneath for protection, initially targeting the June 12 high of 24,429. A break above that would open the door for a possible run towards the March 20 swing high of 24,895.
RSI (14) has broken its downtrend and remains above 50, suggesting bullish momentum may be starting to build again. While not yet confirmed by MACD, it’s beginning to curl back towards the signal line above zero, hinting that too may not be far away.
Good luck!
DS

I opt for Option 2 for HSINow, I hope the HSI will moves to option 2 instead of option 1. I think the latter is less likely to happen since the central government has already thrown in a lot of stimulus and time to prop up the market. To let it fall back to this low level will be discouraging and harder to get people interested to invest in the market once again.
I am also hoping the government will release more stimulus to people on the ground as consumer demand is still weak, crippling property market and weak job market. The silver lining seems to be the US- China trade tariffs issue which was resolved much quicker than expected. While there is no signed agreement for now, there are also no further escalation as well which is viewed positively by the market.
I am getting more ammunition to buy in those quality companies that i am eyeing on or averaging down some of the stocks that i am currently holding. No rush for now, just patiently awaiting..........

HK50 bearish momentumWe see this index coming down much lower due to Investors being underwhelmed by Beijing's latest economic support measures, with some stimulus lacking detail—similar to a previous sharp drop (~–9%) after disappointing announcements .
Mixed Chinese PMI and retail data also dampen sentiment.
U.S.–China tariff fears:
Ongoing trade tensions and tariff worries continue to pressure Chinese-connected stocks, impacting the Hang Seng disproportionately .
Foreign fund outflows & shifting global appetite:
Capital has been flowing out toward safer or higher-growth markets, especially as U.S. and European equities show more stability. A weaker yuan adds to pressure .

Hong Kong another index ready to rally to new ATHHang Seng is another index set for upside.
Seems like between Asia, America and JSE upside is inevitable along with Europe (Which seem to be the turtles of moving.) But why the upside?
We don't know for sure, but we can speculate.
China stimulus: Beijing is rolling out fresh stimulus to support its economy.
Tech rebound: Major Chinese tech stocks like Alibaba and Tencent are bouncing back.
Property relief: Easing in real estate policies is reviving investor confidence.
Cheap valuations: Hang Seng stocks remain deeply undervalued compared to peers.
Global inflows: Foreign investors are rotating into emerging and Asia-Pacific markets.
And the technicals are self evident with a breakout pattern and momentum strategy approach.
Cup and Handle
Price>20 and 200
Target 2,6944
Disclosure: I am part of Trade Nation's Influencer program and receive a monthly fee for using their TradingView charts in my analysis.

HK50 Short OpportunityHello,
The HK50 is encountering strong resistance at the upper range, with price action showing difficulty breaking through, signaling a potential loss of bullish momentum. A bearish crossover at the zero line on the MACD further supports a possible downward move.
Trade Setup:
Entry Point: Enter a short position upon confirmation of a strong bearish candle at the current resistance, indicating a clear rejection.
Target 1: HKD 19,165 – a conservative level for initial profit-taking.
Final Target: HKD 16,766 – the primary downside target, aligned with key support and historical price action.
Stop Loss: Set above the recent high to guard against unexpected breakouts, maintaining disciplined risk management.
Disclosure: I am part of Trade Nation's Influencer program and receive a monthly fee for using their TradingView charts in my analysis.


HK33 to find buyers at curren support?HS50 - 24h expiry
There is no clear indication that the upward move is coming to an end.
Although we remain bullish overall, a correction is possible with plenty of room to move lower without impacting the trend higher.
A move through 23600 will confirm the bullish momentum.
Risk/Reward would be poor to call a buy from current levels.
The measured move target is 24250.
We look to Buy at 23200 (stop at 22700)
Our profit targets will be 24200 and 24250
Resistance: 23600 / 24000 / 24250
Support: 23200 / 23000 / 22750
Risk Disclaimer
The trade ideas beyond this page are for informational purposes only and do not constitute investment advice or a solicitation to trade. This information is provided by Signal Centre, a third-party unaffiliated with OANDA, and is intended for general circulation only. OANDA does not guarantee the accuracy of this information and assumes no responsibilities for the information provided by the third party. The information does not take into account the specific investment objectives, financial situation, or particular needs of any particular person. You should take into account your specific investment objectives, financial situation, and particular needs before making a commitment to trade, including seeking advice from an independent financial adviser regarding the suitability of the investment, under a separate engagement, as you deem fit.
You accept that you assume all risks in independently viewing the contents and selecting a chosen strategy.
Where the research is distributed in Singapore to a person who is not an Accredited Investor, Expert Investor or an Institutional Investor, Oanda Asia Pacific Pte Ltd (“OAP“) accepts legal responsibility for the contents of the report to such persons only to the extent required by law. Singapore customers should contact OAP at 6579 8289 for matters arising from, or in connection with, the information/research distributed.

HK50 "HongKong" Index Market Bullish Robbery (Swing Trade Plan)🌟Hi! Hola! Ola! Bonjour! Hallo! Marhaba!🌟
Dear Money Makers & Robbers, 🤑 💰💸✈️
Based on 🔥Thief Trading style technical and fundamental analysis🔥, here is our master plan to heist the HK50 "Hong Kong" Index Market. Please adhere to the strategy I've outlined in the chart, which emphasizes long entry. Our aim is to escape near the high-risk ATR Zone. Risky level, overbought market, consolidation, trend reversal, trap at the level where traders and bearish robbers are stronger. 🏆💸"Take profit and treat yourself, traders. You deserve it!💪🏆🎉
Entry 📈 : "The vault is wide open! Swipe the Bullish loot at any price - the heist is on!
however I advise to Place buy limit orders within a 15 or 30 minute timeframe most recent or swing, low or high level. I Highly recommended you to put alert in your chart.
Stop Loss 🛑:
Thief SL placed at the Nearest / Swing low level Using the 4H timeframe (21000.0) Day/Swing trade basis.
SL is based on your risk of the trade, lot size and how many multiple orders you have to take.
🏴☠️Target 🎯: 24200.0 (or) Escape Before the Target
🧲Scalpers, take note 👀 : only scalp on the Long side. If you have a lot of money, you can go straight away; if not, you can join swing traders and carry out the robbery plan. Use trailing SL to safeguard your money 💰.
💰💵💸HK50 "Hong Kong" Index Money Heist Plan is currently experiencing a bullishness,., driven by several key factors. .☝☝☝
📰🗞️Get & Read the Fundamental, Macro Economics, COT Report, Geopolitical and News Analysis, Sentimental Outlook, Intermarket Analysis, Index-Specific Analysis, Future trend targets with Overall outlook score... go ahead to check 👉👉👉🔗🔗🌎🌏🗺
⚠️Trading Alert : News Releases and Position Management 📰🗞️🚫🚏
As a reminder, news releases can have a significant impact on market prices and volatility. To minimize potential losses and protect your running positions,
we recommend the following:
Avoid taking new trades during news releases
Use trailing stop-loss orders to protect your running positions and lock in profits
💖Supporting our robbery plan 💥Hit the Boost Button💥 will enable us to effortlessly make and steal money 💰💵. Boost the strength of our robbery team. Every day in this market make money with ease by using the Thief Trading Style.🏆💪🤝❤️🎉🚀
I'll see you soon with another heist plan, so stay tuned 🤑🐱👤🤗🤩

Head and shoulder formation - HSI The fun part of charting is painting across different scenarios and see how it pans out in the near future. If you get it right more often than wrong, it gives you both satisfaction and rewards (financially).
Like the saying, there is many ways to slice a fish , be it steamed, fried or charcoal grilled. The same thing for charting - some like to use indicators like EMA, RSI, MACD while others swear by candle stick patterns, Fibonacci , support and resistance and the list goes on. There are probably more indicators in the market that you can ever use in your chart but whatever make sense to you that is the most important.
Now that it has broken out of the resistance at 22, 701 , I believe the rally will continue, never mind if it is at snail pace. If you examine closely , since Apr 22, it has been 5 times that the price action attempt to break out but unsuccessfully. This time, I believe it will sustain the rally and move up higher.
What happens after 90 days pause for the tariffs? Your guess is as good as mine. It could be a further kick down the road to extend another 60 to 90 days or perhaps some sorts of mutual agreements between US and China.
Let's take one step at a time, enjoy the ride up and not worry excessively.........
As usual, please DYODD


HK50 Short 1. This trade is against the H4 trend however, there is a pattern on M15 and M30
2. All timeframes are overbought, and there is a triple top with divergence
3. This is the week's high, and it will have a lot of resistance at this level.
4. Stop loss of 200 pips
5. 1st target is at 23150

HK50 Heist Alert: Snatch the Bullish Loot & Escape the Red Zone!🌎 Greetings, global fortune hunters! Bonjour, Shalom, Salut, Hola! 🌟
Dear Cash Commanders & Market Marauders, 💰⚡️
Forged in the 🔥 Rogue Trader’s crucible of technical and fundamental sorcery 🔥, here’s our sly scheme to plunder the HK50 “HongKong50” Index Market. Stick to the chart’s blueprint, homing in on long entries. Our endgame? Sneak out near the perilous ATR Red Zone, where overbought signals, consolidation, trend reversals, and traps await, with bearish outlaws ready to pounce. 🏴☠️💸 “Lock in profits and spoil yourself, traders—you’re unstoppable!” 🎉💥
**Entry 📈**: The safe’s wide open! Grab the bullish treasure at any price—the raid’s in motion!
For sharper moves, place buy limit orders on a 15 or 30-minute chart at the most recent swing low or high. Hot tip: set chart alerts to stay one step ahead!
**Stop Loss 🛑**:
📍 Rogue SL anchored at the recent swing low on the 4H timeframe (22700.00) for day or swing trades.
📍 Adjust SL based on your risk tolerance, lot size, and number of open orders.
**Target 🎯**: Aim for 24700.00—or slip away early if the market turns dicey!
🧲 **Scalpers, stay sharp!** 👀: Focus on long-side scalps only. Big bankroll? Jump in now! Smaller stack? Team up with swing traders for the heist. Use trailing SL to guard your gold 💰.
💵 **HK50 Market Heist (Swing Trade Breakdown)**: Sitting in a neutral zone with a bullish spark, driven by key market currents. ☝
🗞️ **Dig into the details**: Explore Fundamental Insights, Macroeconomic Trends, COT Reports, Geopolitical Shifts, Sentiment Signals, Intermarket Connections, Index-Specific Factors, Positioning, and Future Targets for the full picture! 👉🔗🌍
⚠️ **Trading Alert: News & Position Tactics** 📰🚨
News events can rattle markets like a tempest. To protect your profits:
- Steer clear of new trades during news releases.
- Deploy trailing stop-losses to secure gains and shield open positions.
💖 **Power up our raid!** 💥 Tap the Boost Button 💥 to amplify our profit-snatching prowess. Join the Rogue Trading Style posse and rake in riches daily with finesse. 🏆🤝🚀
See you at the next market ambush—stay vigilant! 🤑🐱👤🎯
