$HYPER Tarde Setup 2H Chart$HYPER Trade Setup 2H Chart
- Entry: CMP
- Stop-Loss: $0.1320
Targets:
• TP1: $0.1950
• TP2: $0.2400
• TP3: $0.2900
The setup looks solid, watch for a strong candle close above $0.158.
DYRO, NFA
HYPERUSDT trade ideas

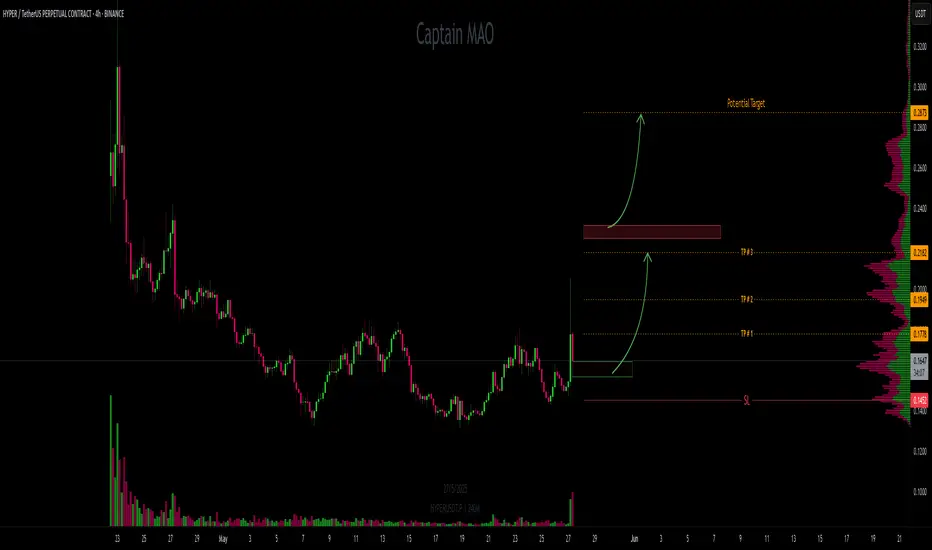
HYPER/USDT 30–40% UpsideHYPER has shown strong bullish momentum recently with a significant price spike accompanied by high volume, signaling strong interest. The price is now retracing toward a major support zone, presenting a potential high-reward DCA (Dollar-Cost Averaging) opportunity.
Entry Zone: Start DCA within the green box
Target: 30–40% upside from entry
Stop Loss: $0.143 (just below major support)
After the spike, HYPER is pulling back in a healthy retracement. The current zone offers a strong support base, and the setup looks primed for the next leg upward if volume returns.
if see strong 4hr candle close above 0.23 will targeting $0.287
$HYPERUSDT Breakout in Progress Eyes on Key Levels!BINANCE:HYPERUSDT is bouncing from a strong demand zone.
If support holds, the price could target $0.1823, $0.2370, or $0.3201.
Watch for a clean retest around $0.170 to confirm the move.
It looks bullish for now.
DYRO, NFA

Hyperlane Short-Term (134% Profits Potential)Hyperlane (HYPERUSDT) produced a v shaped bottom recently as it broke out of a major downtrend. This chart is not very strong as there isn't much volume but the action is already happening above EMA55 which is a strong bullish signal.
The low volume signal can be ignored because price action is more important when it comes to reading a chart. Volume can be low, or high, for a number of reasons. The volume indicator can be a great tool but it doesn't work without a context and it can be easily misinterpreted.
We can use it to support other signals but never in isolation nor to make a decision based on what the trading volume of a pair is doing.
Current price action, the break above this mid-term moving average, marketwide action and Bitcoin trading above $100,000 are all bullish signal. So we can easily make the assumption that HYPERUSDT will continue to grow. Not that it will grow, but that this is the most likely scenario in the coming weeks and months.
Market conditions can always change and they already changed from bearish to bullish last month. it will take a while before the market goes back into bearish mode. A bullish cycle can last anywhere between 6 to 12 months.
Namaste.

HYPER Analysis (4H)From where we placed the red arrow on the chart, the HYPER correction has started.
This corrective pattern might be diametric, with wave E near completion.
By maintaining the green box, it could move toward the targets, which are marked on the chart.
A daily candle closing below the invalidation level will invalidate this analysis.
For risk management, please don't forget stop loss and capital management
When we reach the first target, save some profit and then change the stop to entry
Comment if you have any questions
Thank You
