Hyperliquid (HYPE): Good Buying Opportunity or Great Dump ?Hyperliquid coin has been gliding the EMAs too smoothly, where we are seeing strong buyside dominance. Just like last time we are going to keep an eye on EMAs (Specially the 200) for any possible breakdowns that might trigger bigger movement to lower zones, but while price stays above that EMA we are looking for further movement to upper zones, just like previouse times.
Swallow Academy
HYPEUSDT.P trade ideas

Lingrid | HYPEUSDT bullish Momentum Continuation LikelyKUCOIN:HYPEUSDT is consolidating after a breakout and forming a flag pattern, riding an established upward channel. Price has consistently respected the dynamic support from the trendline and the key horizontal level near 40.00. The recent higher low suggests momentum is intact for a bullish continuation toward the 49–50 target zone.
📈 Key Levels
Buy zone: 39.3–40.0
Sell trigger: breakdown below 39.0
Target: 50.0
Buy trigger: breakout above 43.0 with volume
💡 Risks
Failure to hold above 39.3 could invalidate bullish setup
Divergence signs may emerge on lower timeframes
Overall market sentiment could disrupt the clean trend formation
Traders, if you liked this idea or if you have your own opinion about it, write in the comments. I will be glad 👩💻

Hyperliquid Correction Exposed, $16.6-$22.5 Range To Be TestedAfter a strong rise there is always a strong correction and I will call this normal market behavior.
Hyperliquid entered the TOP20 altcoins by market capitalization and now sits at #11. Amazing feat.
In a matter of 65 days, between 7-April and 11-June, HYPEUSDT grew a very nice 373%.
A correction can take prices back below the 0.618-0.786 Fib. retracement support range. Which means between $16.7 and $22.5.
As usual, after the bearish wave is over, we can expect a new wave of growth. This one should unravel fast.
Thank you for reading and for your continued support.
Additional details can be found on the chart.
Namaste.

Hypeusdt.pLets wait to short it.
If the current level shows some bearish candles and retest we can short from entry 1 else entry 2
Tp1 has been marked for both of the trades.
DYOR

HYPE/USDT – 4H Chart Analysis PUMP TO $50??HYPE/USDT – 4H Chart Analysis
Volume (OBV Indicator):
The On-Balance Volume (OBV) has broken above its local resistance level, indicating a notable increase in bullish volume inflow. This supports the current upward momentum.
Market Structure:
High Time Frame (HTF): Still bullish.
Lower Time Frame (LTF): Currently consolidating within a bullish pennant pattern.
Price has recently closed just above the pennant’s resistance line, suggesting a potential breakout and continuation of the bullish trend.
Key Zones & Levels:
Supply Zone: Price is currently testing this zone. A successful hold and breakout above the previous swing high would confirm bullish continuation.
Fair Value Gaps (FVGs):
A small FVG exists just beneath current price between key support/resistance levels. This may act as a short-term magnet for price (potential retracement).
Two larger FVGs on the 1D time frame lie below the current support and prior swing low. If price moves into these levels, it would likely be a liquidity sweep, trap, or fakeout scenario.
Psychological Levels: $40.00 and $45.00 are the next logical upside targets if bullish momentum continues beyond the swing high.
Trade Setup:
Entry: At the 0.28 Fibonacci retracement level.
Stop Loss: Just below the 0.5 Fibonacci level.
Take Profit (Partial): At the 0.618 Fibonacci extension, aligning with a psychological resistance zone.
Summary:
The breakout from the bullish pennant, combined with increasing volume (OBV breakout), suggests strong bullish momentum. As long as price holds above the pennant and key support, continuation toward $40–$45 remains the probable scenario. Any dip into the lower FVGs would likely be a liquidity event rather than a trend reversal.
(NOTE: This is not financial advice, it is recommended to always (DYOR) (Do Your Own Research)

Hyperliquid HYPE price analysis🧐 This idea regarding the price of #HYPE is based more on our "intuition", as the project's tokenomics are excellent:
there will be no major coin unlocks this year, and 97% of the commission income of the #hyperliquid exchange will be directed towards the repurchase of its own token.
🤖 We previously managed to “predict” the growth of the #HypeUSDT price, so maybe our forecast will come true again) 👇
❗️ But this is by no means a call to shorts!
This idea is more about the opportunity to buy #Hype for $22-23 for your investment portfolio.
_____________________
Did you like our analysis? Leave a comment, like, and follow to get more

HYPE can it keep us hyped ?Mastering Zones: Your Quick Trading Guide!
Remember the core logic:
🔵 Blue Zone:
PUMPS FROM BLUE (Look for buys!)
DUMPS IF BREAKS BLUE (Consider sells/exit longs!)
🔴 Red Zone:
DUMPS FROM RED (Look for sells!)
PUMPS IF BREAKS RED (Consider buys/enter longs!)
Apply this to your charts for clear signals. Stay sharp!

HYPE Precision Trading — Pattern, Patience, ProfitHYPE has shown strong performance since early April, maintaining a clear uptrend. Currently, the market is consolidating in a range between $30 and $40 and it’s setting up for something interesting. Let’s break it down and map the next high-probability trade setup.
Potential Gartley Harmonic Pattern Forming
A valid Gartley pattern may be developing, with point D potentially forming around the $29 level. This zone offers solid confluence for a high-probability long setup.
🟢 Long Setup – Gartley Harmonic Pattern Completion at around $29
Confluences around $29–$28.3:
0.786 Fib retracement of XA
Trend-based Fib Extension 1:1
Negative -0.618 Fib as take-profit level for prior short
Anchored VWAP (0.666 band multiplier) acting as dynamic support
200/233 EMA/SMA support on the 4H TF
FVG + liquidity pool resting just below $30
Setup Details:
Entry Zone: Trend-based Fib Extension 1:1 or laddered between $30–$28.3
Stop Loss: Below $27.5 (adjust depending on where point D forms)
Target: 0.618 of CD leg ≈ $34.4
R:R ≈ 1:3.5
🔴 Short Setup – look for rejection at $36
0.618 Fib retracement from previous move (ideal short entry)
Invalidation: Break above $38.2 (above point C)
Take Profit: $30-$29
R:R ≈ 1:3
🧠 Educational Insight:
Harmonic patterns offer precise entries and targets by aligning Fibonacci levels with market structure. When combined with tools like Anchored VWAP and liquidity analysis, they become powerful tools for swing trading.
Summary:
HYPE continues to respect structure beautifully, offering repeated swing setups in the 10%–20% range. With clear fib symmetry and predictable behaviour, it remains one of the more technically sound altcoins.
Stay patient. Wait for the pattern to complete. As always — don’t chase. Let the trade come to you.
_________________________________
If you found this helpful, leave a like and comment below! Got requests for the next technical analysis? Let me know.

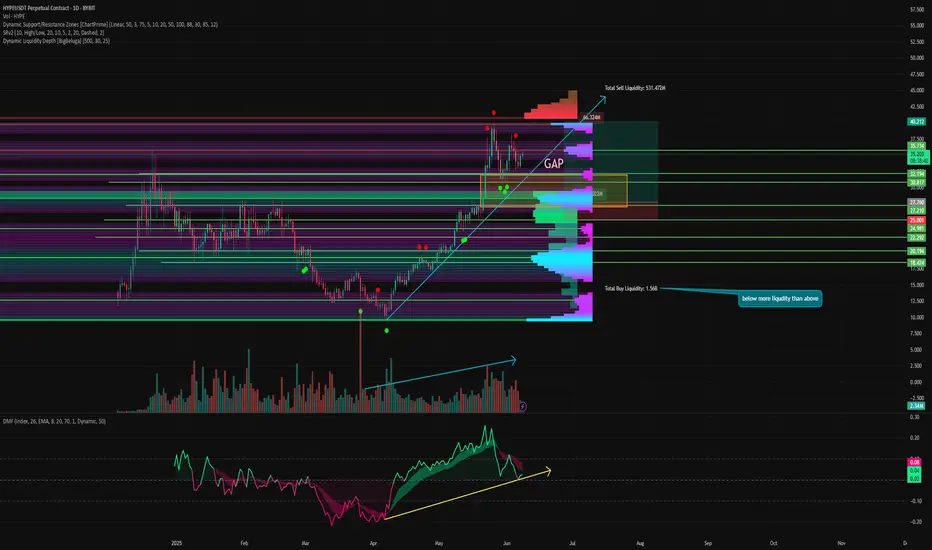
Hyperliquid's next move has already been defined, and here it is⚡️ The weekend is coming to an end, and we continue to look at altcoins ahead of the new week!
Hype is an interesting token that literally rose from the ashes and is one of the few that updated its ATH on this momentum. But the question remains: should we expect an ATH reset or will we see a correction?
Let's figure it out!
📊 Technical Analysis:
Hype continues to move in an upward momentum. It has not yet encountered any major corrections and has not even tested its sloping support. Locally, the token has now shown a Lower High and is likely to go lower without encountering sufficient buyer interest.
In addition, there is a small GAP below us in the range of 32-27. And as we know, 99% of GAPs close sooner or later.
⚙️ Metrics and indicators:
Volume - purchase volumes are decreasing, gradually forming a divergence, while sales volumes are growing. This indicates that many are now fixing their profits at these levels.
Money Flow - is in a neutral state. Positions are being fixed, and no fresh liquidity is currently observed in the asset.
DSRZ - we see the first major support level at 29-27. This is just below the GAP level. The next major support level is at 20-17.
At current prices, there is virtually no interest in trading in the market.
Liquidity Depth - there is currently significantly more liquidity in longs than in shorts. And the price tends to move from one liquidity zone to another, with liquidity serving as fuel for price movement.
📌 Conclusion:
HYPE is clearly overheated right now. It is one of the most overheated assets on the market. And when a real correction begins on the market, it will be one of the first to fall. Since it is currently holding at the ATH level, profit-taking has not really begun yet. Many expect it to continue.
I don't really expect us to see a new ATH, even if Bitcoin updates its own.
Right now, everything points to HYPE awaiting a correction. In particular, due to a lack of liquidity, as summer is approaching, which is traditionally a quiet period.
💡 Personally, I expect the GAP to close and the first support point to be reached. There will be high buyer demand and we may see a short squeeze to shake out early short sellers.
Have a great week, everyone!
HYPE/USDT – Symmetrical Triangle BreakoutHYPE/USDT – Symmetrical Triangle Breakout
HYPEUSDT has broken out of a symmetrical triangle pattern, which often signals a strong upcoming move. If the breakout holds above the structure with consistent volume, we could see a continuation toward higher targets.
Symmetrical triangles are neutral patterns, but a breakout to the upside usually indicates bullish momentum building up.
Key levels to monitor:
– Breakout confirmation zone
– Immediate resistance above
– Retest of the triangle (if it happens)
Keep an eye on it — if HYPE sustains above the breakout level, a solid upward move may follow.

Hype's path to $55BYBIT:HYPEUSDT.P is currently forming a wedge shape pattern, is it indicating that it will break out and follow Path A, the blue path? I'm not so sure, I am sure we'll hit $55 either way.
If we take the red path, Path B, we'll come down to some heaviy support which could give us the fuel needed to get to $55
Out of all of the oscillators I was using, all except the chop zone on the daily mind you, were in bearish mode. So logically one would choose the red Path B right?
I can't wait to see how this plays out, shall we dip some and buy some more BYBIT:HYPEUSDT.P on Path B or experience more of a continuation of the current trendline to $55?
Let me know what you think in the comments, that'ls all for today, let's go HYPE!!! straight to $55!

$HYPEUSDT Long Setup 6H Chart$HYPE/USDT – Long Setup (6H Chart)
- Entry Zone: $37.8 – $38.2
- Target: $45.8
- Stop Loss: $37.2
Price is bouncing off strong demand and an ascending trendline.
If support holds, we expect a bullish continuation
Break below $37.2 invalidates the setup.
DYRO, NFA

Where Is The Real HypeThis latest crypto cycle has been the hardest to navigate for even the most experienced crypto traders. No real Altcoin season has transpired, maybe best reflected by the fact that over 2 years into it, Ethereum still has not seen a new All-Time-High. That is not to say that there have not been winners. Hyperliquid, the 'decentralized' perpetuals exchange has taken the market by storm. The word 'decentralized' is in inverted commas as the extent of decentralization for the platform is debatable but starting with UX and product first, and arguably bringing in decentralization later, has so far proven to be winning strategy. The performance of the project's native token HYPE has been one of the few bright lights in this market.
HYPE, the token, launched in what is an immaculate conception in crypto terms: no VCs who got in at better price levels, an airdrop that heavily rewarded the community, revenue-driven token buybacks. The project is a case-study on how to succeed in today's crypto world. Perpetuals trading is one of the core use-cases for crypto. Enabling perpetuals trading for jurisdictions where it is banned for retail via 'decentralization' is regulatory arbitrage at its best. Luckily, regulation-wise, the stars seem to have aligned. At the same time, crypto traders have been overwhelmed by large supplies of tokens dumped on the market at unfavorable terms for retail investors. Non-crypto retail on the other hand has been burned one too many times by mingling in our industry and has so far stayed out. Consequently, the vast majority of crypto tokens has simply not gone anywhere in this cycle so far.
Where non-crypto retail funds go becomes visible when looking at the performance of various stock indices, pennystocks and even crypto-related stocks including Microstrategy. Even despite economic uncertainty and war, stocks are at all-time highs. On the institutional side, funds and tradfi have been playing the crypto-leverage game via instruments they are familiar with. We have spoken about Michael Saylor's strategy of borrowing funds to buy more Bitcoin many times in this newsletter previously. Other companies have copied the Microstrategy playbook in increasing numbers. 151 publicly traded companies now hold Bitcoin.
Meanwhile, the less 'degen' side of tradfi has focused its attention on stablecoins. The so-called 'GENIUS' Act to regulate stablecoins has just passed the US Senate with bi-partisan support. The performance of Circle's stock after its recent IPO is the best example for the growing Tradfi excitement over Stablecoins. A 5x return in a little over a week may remind crypto traders of happier days. It is certainly not the norm in Tradfi world. Stripe, the Fintech giant, has been acquiring crypto infra players including Bridge and Privy. Shopify has enabled stablecoin payments. Adoption comes slowly, then all at once.
As the worlds of crypto and Tradfi continue to merge, opportunities for traders will continue to present themselves. We may be facing a quieter period in crypto markets right now. But the lessons of HYPE's immaculate conception are being studied by teams and founders around the industry. Inevitably, the possibilities of permission-less onchain finance will sooner or later lure back the traders. Until then, good luck looking for the next hype.

$HYPE - Attention Extreme reached. Now it is over.RSI divergence. On weekly + 3D
+ 3d gravestone.
Good short setting up, back to $20/.


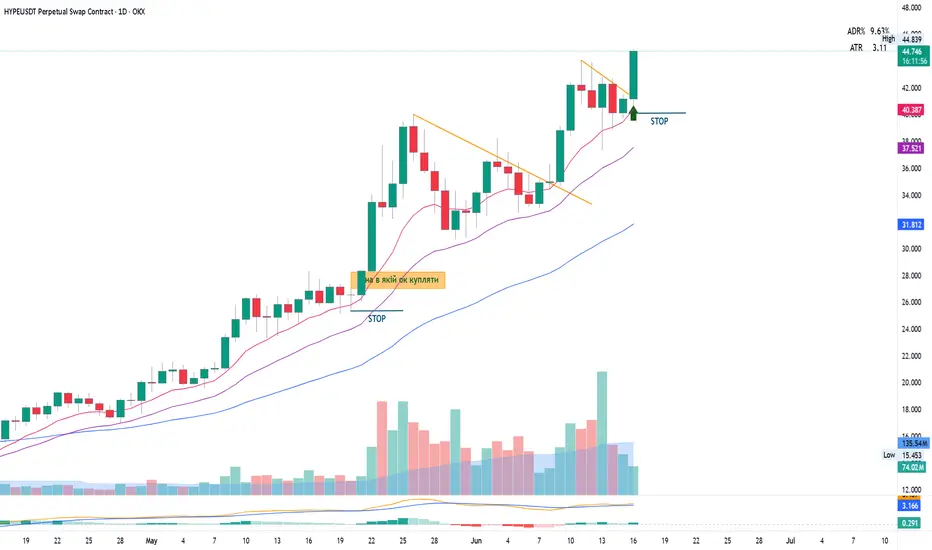
$HYPE Trade!!GETTEX:HYPE is testing the crucial support zone at $40.0–$40.5, right along the ascending trendline and 200 EMA on the hourly chart.
If this zone holds, we could see a rebound toward the $44.5–$46.0 resistance area.
However, a breakdown below $40.0 might trigger further downside toward the next major support at $38.0–$37.4.
Monitor closely—this zone will decide the next move.

Breakout dayGood setup, good chart.
Surfing 10 and 20 ema`s (1D).
Seems like a breakout day.
Stop below 1D low.
Target ? Sky is a limit )
Hypecoin scalp long to $42.29Just went long on Hype coin
Stop: $40.583
TP: $42.29
Entry: $41.16
2RR scalp
Anticipating a retest of $42.29 before further selloff.

Is it worth the HYPE!!Hype! Typical liquidity chase and then fall down, observe for the momentum and then go for the play

HYPE BUY TARGET 15-25 SPOT + STAKE - YAHIAHYPE ANALYSIS. BUY WAVE 2 OF 3 15-25$
I do not know what else to type to make it work, I rlly dont know, im just typing for the sake of it being approved.


HYPE correction scenarioI case we get a deeper correction on BTC I could see HYPE doing a bit deeper correction similar to last time it did after setting a new ATH

Phemex Analysis #87: Pro Tips for Trading Hyperliquid (HYPE)Hyperliquid ( PHEMEX:HYPEUSDT.P ) has rapidly become one of the most talked-about cryptocurrencies over the past two months. Impressively defying broader market uncertainties, HYPE soared from a low of $9.313 on April 7 to a remarkable high of $40.019 on May 26—achieving an astounding growth of approximately 329%.
However, caution is advised, as recent price action has formed a classic "Head-and-Shoulders" pattern, with the third peak emerging around June 3. This technical setup often indicates weakening bullish momentum and potential trend reversal. Given this scenario, let's delve deeper into several possible outcomes that could unfold for HYPE in the upcoming days.
Possible Scenarios
1. Bearish Reversal
The Head-and-Shoulders formation signals a potential bearish reversal. If HYPE breaks below the critical support levels at $31.5, especially with increased trading volume, and subsequently breaches the $30 support, the likelihood of a sharp downward movement intensifies.
Pro Tips:
Short Positions: Consider initiating short positions upon confirmed breakdowns below $31.5 or $30. Always employ tight stop-losses to manage risk effectively.
Long-Term Accumulation: For those with a longer-term bullish outlook on HYPE, watch closely for price stabilization around lower support levels at $25.5 and $24.3, which could offer strategic entry points for buying the dip.
2. Retesting the $30 Support Level
Another plausible scenario is that HYPE might retrace to the $30 support level, characterized by declining trading volume. If volume diminishes significantly at this level, it could indicate that selling pressure is weakening, setting the stage for consolidation rather than further declines.
Pro Tips:
Grid Trading Strategy: Utilize grid trading to systematically capitalize on potential range-bound movement between clear support at $30 and resistance near $38.
Risk Management: Remain disciplined by setting clear stop-losses above the resistance or below support to protect against unexpected breakouts or breakdowns.
3. Breakout Rise (Bullish Scenario)
While considered less likely given current technical patterns, crypto markets often defy expectations. A bullish breakout above the immediate resistance levels at $37.2 and subsequently $39.7—particularly if accompanied by strong positive news or substantial trading volume—could signal another significant upward move.
Pro Tips:
Watch Resistance Levels: Stay alert for decisive breakouts above $37.2 and $39.7, validating the bullish scenario.
Confirmation Required: Only enter long positions if breakouts are confirmed by sustained volume and supportive fundamental news.
Conclusion
Hyperliquid (HYPE) currently stands at a crucial technical juncture, presenting multiple strategic opportunities for traders. Whether anticipating a bearish reversal, a consolidation phase, or a surprise bullish breakout, successful trading will depend on vigilance, technical confirmations, and disciplined risk management. Stay adaptable, carefully monitor key price levels, and remain informed about news and market developments to confidently navigate trading HYPE.
Tips:
Elevate Your Trading Game with Phemex. Experience unparalleled flexibility with features like multiple watchlists, basket orders, and real-time adjustments to strategy orders. Our USDT-based scaled orders give you precise control over your risk, while iceberg orders provide stealthy execution.
Disclaimer: This is NOT financial or investment advice. Please conduct your own research (DYOR). Phemex is not responsible, directly or indirectly, for any damage or loss incurred or claimed to be caused by or in association with the use of or reliance on any content, goods, or services mentioned in this article.
