Hyperliquid is back above $40 ┆ HolderStatKUCOIN:HYPEUSDT rebounded through the 40 handle after completing a measured drop inside a falling channel. The reclaim came right at multi‑month trend support drawn from the “growing channel,” turning 38–40 into a key demand shelf. Momentum broke the channel’s midline and the market is attempting to stair‑step higher with higher lows on 4H. If price holds above 38–40, upside targets sit at 44.2, 46.8 and the prior reaction zone near 48–50. Failure back below 38 would risk a return to 36.3 and the lower boundary; until then, the bias stays moderately bullish with dips likely to be bought.
HYPEUSDT trade ideas

Hypecoin weekend short to $35.75hypeusdt short
Sl: $36.72-38.85
Tp1: $36.34---50%
Full Exit: $35.75
2.21-3 RR
DTT strategy applied
Time sensitive

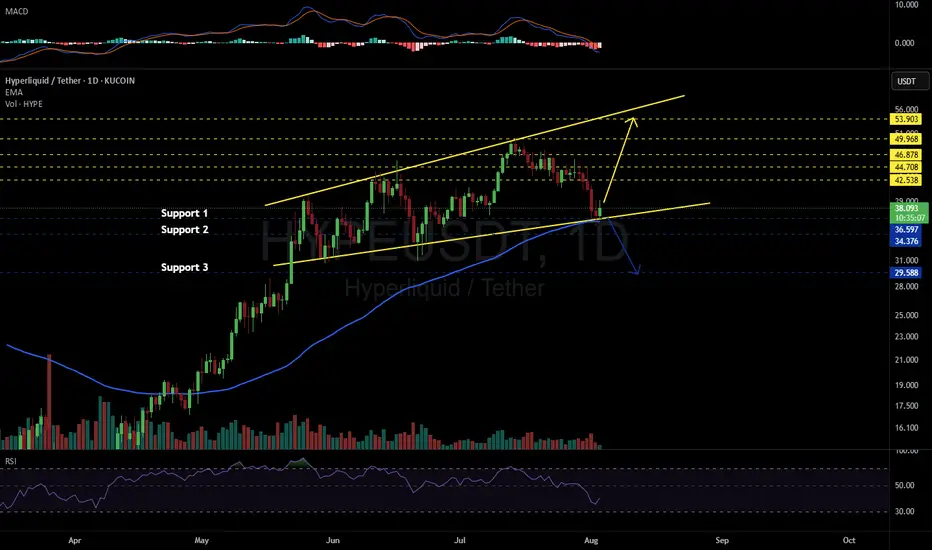
HYPEUSDT 1D#HYPE is moving inside an Ascending Broadening Wedge pattern on the daily chart — a structure that typically carries a bearish bias.
However, for now, #HYPE has bounced from the wedge support line and the daily EMA100, suggesting a possible short-term move to the upside.
If momentum continues, potential targets are:
🎯 $42.538
🎯 $44.708
🎯 $46.878
🎯 $49.968
🎯 $53.903
📉 On the other hand, if price breaks below the pattern, the daily EMA100, and the $36.597 support, deeper correction could follow toward:
🔻 $34.376
🔻 $29.588
⚠️ As always, use a tight stop-loss and apply proper risk management.
Long Hype, Looking for a retracement, we have double bottoms and double tops and then see London and NY trade to Sunday high.

Hyperliquid (HYPE): Looking For Recovery | Possible Buy AreaHYPE has had its fun with 200EMA, which recently got broken and now most likely we are going for a retest of that broken zone, which also would fill a local FVG area.
That's what we are looking for rn, a smaller recovery before another wave of sell-side movement.
Swallow Academy

HYPE/USDT 2H SETUP.HYPE/USDT 2H Setup 🔥
Price is targeting upside liquidity near internal equal highs (BSL).
Watch for a reaction inside the POI (Premium OB Zone) around $41–$42.
📌 Plan:
Expect a short-term pump to take out buy-side liquidity
Look for rejection or reversal from POI for a high-probability short setup.
Bearish scenario after liquidity sweep! 🔻

HYPE | Hyperliquid - Swing Long IdeaHYPE | Hyperliquid - Swing Long Idea
📊 Market Sentiment
Market sentiment remains bullish, supported by expectations of a 0.25% rate cut at the upcoming FOMC meeting. The weakening USD and rising risk appetite across global markets continue to favor crypto assets.
We're currently seeing a minor retracement, primarily driven by the Nasdaq’s pullback — but the overall outlook for the crypto market remains bullish in the weeks ahead.
📈 Technical Analysis
Price broke the bullish trendline that had supported the uptrend for a while.
Following the breakout, we saw a deeper retracement that grabbed the equal lows liquidity.
This area is significant — equal lows often contain large liquidity pools, which smart money tends to target for accumulation.
📌 Game Plan
Price has already broken 4H structure again and formed a 4H demand zone.
It then retested the 4H demand zone and showed a clear rejection — confirming the setup.
🎯 Setup Trigger
I entered the trade precisely at the retest of the 4H demand zone: $38.316
📋 Trade Management
Stoploss: $35.46
Targets:
TP1: $44.80
TP2: $50.00
I will trail my stop to lock in profits aggressively along the way.
💬 Like, follow, and comment if this breakdown supports your trading!
More setups and market insights coming soon — stay connected!


HYPE - a major correction can be expected One of the most interesting tokens of the HYPE cycle. It initially fell to zero, then rebounded and began to set new all-time highs one after another. During corrections, it even outperformed Bitcoin.
But all good things come to an end sooner or later, and for HYPE, the time has probably come to cool down, and here's why:
➡️ HYPE broke its ascending flag pattern for the first time in four months, signaling a potential trend reversal.
➡️ Throughout the last month, HYPE's growth has been accompanied by a divergence in purchase volumes, indicating declining interest from buyers.
➡️ Money Flow, although in harmony with the scene, began a major fix of positions at the last ATH of $51, and in just a couple of days, the indicator fell into negative territory. Potentially breaking through its sloping support.
➡️ The main areas of interest are at the top, apparently attracting limit orders for shorts. And the first major support level has already been broken at $40.
➡️ The next major support is at $30, where we can expect an upward rebound.
📌 Conclusion:
HYPE has been growing for a very long time, against all odds, against the entire market. And the moment had to come when profit-taking would begin. $50 is a major psychological level, and liquidity has begun to leak out noticeably.
So perhaps this stage is already upon us. But I would not rush to look for buying opportunities, even on the spot. The token is very young, and we do not yet know its real price; it has been both $50 and $9. It is worth giving it time to trade so that we can find out its fair price over time.
Good health and big profits to all! 🔥

HYPE/USDT: "A++" Long Setup - A Perfect Storm of ConfluenceHello traders,
This analysis covers what I consider to be an "A++" high-probability long setup on HYPE/USDT, viewed on the 9H timeframe. It is rare to see this many powerful technical factors align at once, signaling a potential major bottom and the start of a new bullish leg.
1. Trend & Context (The "Why")
The price has pulled back into a critical zone where a confluence of price, time, and momentum indicators are all screaming bullish.
Here is the checklist of the extraordinary confluences:
1. Price Action (LSOB Demand): The primary signal comes from price action. The price has entered a major Bullish LSOB (Liquidity Sweep Order Block) on the 9H chart. This is a critical institutional demand zone where we expect strong buying interest.
2. Time-Based Confluence (Fibonacci Cycle): This is a unique and powerful confirmation. The potential reversal is occurring precisely on a 144 Fibonacci Time Cycle line. When a key price level aligns with a major time cycle, the probability of a significant market turning point increases dramatically.
3. Dynamic Support : The LSOB zone is also confluent with the EMA 200, adding another layer of strong dynamic support to this area.
4. Momentum Exhaustion (MC Orderflow): The momentum oscillator provides the final, undeniable confirmation:
The MC Orderflow itself is in the OVERSOLD zone on this 9H timeframe.
THE CRITICAL CONFLUENCE: The Multi-Timeframe Cycle Table shows that the 4H and Daily timeframes are BOTH "Oversold". This trifecta of oversold signals (4H, 9H, and Daily) is the highest level of momentum confirmation we can get.
2. Entry, Stop Loss, and Targets (The "How")
This powerful alignment provides a very clear trade plan with an exceptional risk-to-reward ratio.
Entry: An entry at the current price level ($38.50 - $39.30) is ideal, as it is directly within the LSOB demand zone.
Stop Loss (SL): $37.50. This places the stop loss safely below the entire LSOB zone and the recent swing low. A break below this level would invalidate this entire bullish structure.
Take Profit (TP) Targets:
TP1: $42.50 (Targeting the cluster of short-term EMAs, which will act as the first resistance).
TP2: $45.00 (The bottom of the Bearish LSOB supply zone, a major magnet for price).
TP3: $49.90 (The major swing high of the range, for a full trend continuation).
Conclusion
This is one of the highest-quality setups I've seen. The perfect alignment of a key price level (LSOB), a major time cycle (Fib 144), and multi-timeframe momentum exhaustion (4H & Daily Oversold) creates a textbook, high-conviction environment for a significant bullish move.
Disclaimer: This is not financial advice. This analysis is for educational purposes only. Always conduct your own research and manage your risk appropriately.

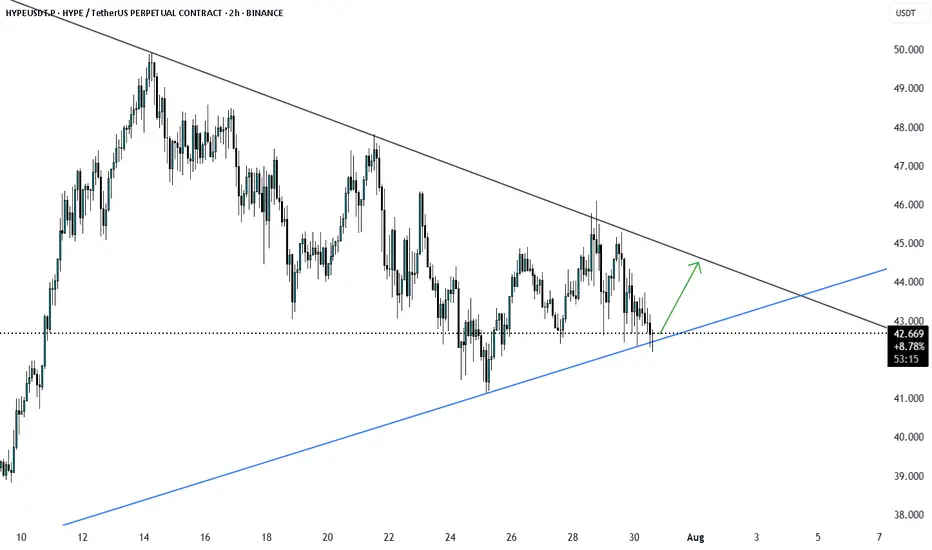
Lingrid | HYPEUSDT Potential Continuation After PullbackKUCOIN:HYPEUSDT is bouncing from a higher low near the 42.070 zone after breaking a descending flag pattern. Price action remains above the ascending support trendline while pressing into a key structure retest. As long as GETTEX:HYPE stays above 42, a bullish leg toward the 49.700 resistance remains likely. Structure suggests a resumption of the impulse phase within the broader uptrend.
📉 Key Levels
Buy trigger: Clean breakout above 45.00
Buy zone: 41.5 – 43.0 (support + flag bottom)
Target: 49.700
Invalidation: Close below 40.00
💡 Risks
Breakdown below the ascending support would weaken the bullish setup
Failure to reclaim mid-flag resistance may lead to deeper consolidation
Broader market weakness in altcoins could delay breakout momentum
If this idea resonates with you or you have your own opinion, traders, hit the comments. I’m excited to read your thoughts!

Is $Hype worth the hype?Ascending Channel:
- The price has been moving inside a rising (bullish) channel since mid-April 2025.
- If this channel holds as support, the price may bounce upward again, continuing the uptrend.
- If it breaks below the channel, this could signal a trend reversal or deeper correction.
Tips
- Trend followers may look to buy on dips near the lower channel line.
- Breakout traders should watch for moves outside the lower channel line.

Hypecoin short to $41.139Just now opened up a short position on hypecoin. Aiming for new lows around $41.139
Price is high on weekly tf and seems to be in a correction phase of the market. Lower tf likely to dump down to facilitate this.
Sl: $44.665
Tp1: $42.061
tp2: $41.139

HYPE/USDT Is moving sideways in a tight consolidation rangeHYPE/USDT is moving sideways in a tight consolidation range between $41.00–$45.90. Moderate whale activity is evident from on-chain data, alongside ecosystem factors like TVL at ~$800M and a 54% fee revenue allocation program, but broader market sentiment (e.g., Bitcoin correlation) adds caution.
Key points with real chart zones:
The recent pullback was likely a "liquidity sweep": Price dropped to test ~$41.00-$41.05 support levels, triggering liquidations and enabling accumulation at lower prices, though this is common in volatile markets.
Bounce and consolidation: After the low, price reclaimed ~$42.00-$43.00, showing buyer interest, but volume remains flat, suggesting potential for either direction without strong conviction.
Ascending channel structure remains intact: The 1D ascending channel holds if price stays above $39.00-$40.20 (lower boundary, golden pocket) and below $46.00-$48.00 (upper boundary). Additional indicators: RSI at neutral 50 (no divergence yet), and OBV trending flat—watch for shifts.
If price breaks above the range: A confirmed H1/H4 close above $45.90 with rising volume could target $48.00 and $50.00-$52.00, but only if BTC holds above $65K (high correlation risk).
If price breaks down and holds below: Action below $41.00 may test $39.00-$40.20, with extension to $37.20-$38.00 if supports fail—amplified by macro factors like upcoming Fed decisions.
Bottom line: HYPE is in a neutral consolidation zone between $41.00–$45.90. Upside to $48.00+ possible with confirmation, but downside to $39.00 equally likely amid flat indicators and external risks. On-chain favors mild positivity, but balance with stops and macro monitoring—ranges can fake out in either direction.
Tip: Avoid chasing moves without confirmation. Set alerts at $45.90 (upside) and $41.00 (downside), track RSI for divergences, volume for accumulation, and news like Fed updates or BTC trends. Position size small (<2% portfolio)—trade safely and always do your own research!
This is not financial advice!

HYPEUSDT Potential Continuation After Pullback
HYPEUSDT
is bouncing from a higher low near the 42.070 zone after breaking a descending flag pattern. Price action remains above the ascending support trendline while pressing into a key structure retest. As long as
HYPE
stays above 42, a bullish leg toward the 49.700 resistance remains likely. Structure suggests a resumption of the impulse phase within the broader uptrend.
📉 Key Levels
Buy trigger: Clean breakout above 45.00
Buy zone: 41.5 – 43.0 (support + flag bottom)
Target: 49.700
Invalidation: Close below 40.00

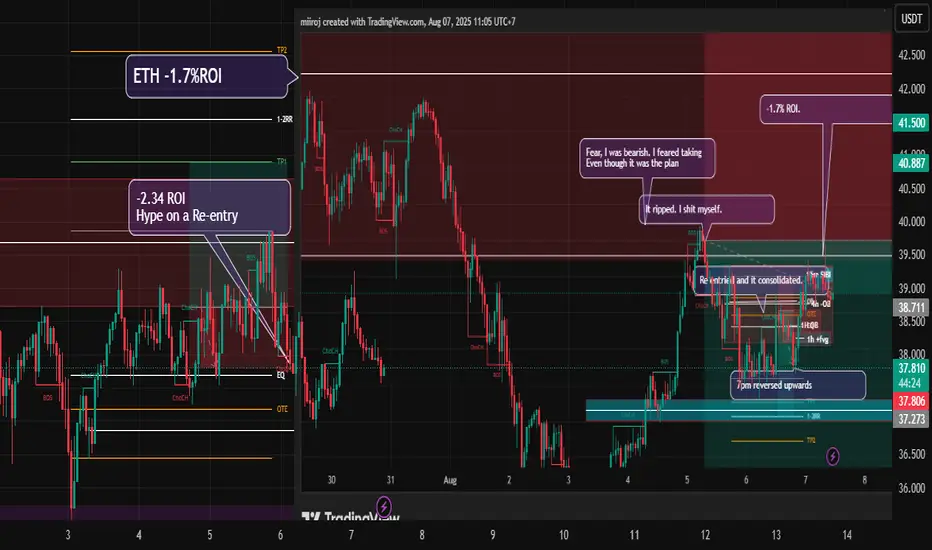
The Loosing TradesI've had 3 in the last 3 weeks.
Popcat *can't trace the ROI info* back in July.
Hype -2.4ROI
Eth -1.7ROI
What's common with them? Chicken out on the first move and taking the second waves.
Fear when I should be puling the trigger, Second attempts are hurting me.
Hyperliquid held the support at $36 ┆ HolderStatOKX:HYPEUSDT.P has pulled back to a critical support zone near $36.00 while staying inside a falling channel. Previous triangle and sideways zones preceded major breakouts, and the current setup could be a repeat. A breakout above $40.00 would shift structure bullish again.

You are not bullish enough on $HYPEBuilding a Bullish Case for \ GETTEX:HYPE (Hyperliquid)
1. Tokenomics: Deflationary Supply & Incentive Alignment
Fixed Supply & Fair Distribution : HYPE has a hard-capped supply of 1 billion tokens, with \~333.9 million (33%) circulating as of mid-2025. Notably, the token was launched via a large airdrop rather than a VC presale – about 310 million HYPE (31%) were distributed to \~94,000 early users at genesis. In total, 69% of HYPE is allocated to the community (airdrop + future rewards), underscoring a grassroots distribution with no early VC unlock overhang. The remaining allocation goes to core contributors (23.8% vested), a foundation budget (6%), grants (\~0.3%), etc., aligning the team’s incentives with long-term network success. This community-centric supply structure contrasts with many meme coins that often concentrate supply in dev or whale wallets, fostering greater trust in HYPE’s tokenomics.
Emissions & Staking Rewards : About 38.9% of HYPE supply is reserved for future emissions and community rewards. HYPE secures its own Layer-1 blockchain via a proof-of-stake consensus (“HyperBFT”), so staking is integral. Validators must self-delegate 10,000 HYPE each, and users can stake HYPE to help secure the network and earn rewards. This incentive design encourages holding: stakers earn yield (likely drawn from protocol fees or emissions), while also gaining governance rights to vote on Hyperliquid’s future. The staking requirement for validators and planned reward schedule suggest a controlled release of new tokens over time, balancing network security with inflation. Importantly, HYPE’s annual inflation is expected to be offset (or even net-negative) by its revenue burn mechanisms.
Buyback & Burn Mechanism : A key bullish facet of HYPE is its deflationary pressure from platform usage. Hyperliquid’s on-chain perpetual DEX uses a portion of trading fees and profits to buy back and burn HYPE tokens, directly tying token demand to exchange volume. This model, similar to exchange tokens like BNB, means that as Hyperliquid’s trading activity grows, HYPE’s effective circulating supply can *shrink* over time. Indeed, the protocol’s HyperLiquidity Provider (HLP) vaults generate revenue from traders and use it to reward liquidity providers *and* conduct token buybacks. With Hyperliquid averaging multi-billion-dollar daily volumes (see below), these recurring burns create a strong scarcity engine for HYPE. The result is a tokenomics profile combining *growth incentives* (staking rewards, community grants) with *scarcity drivers* (fee burns and a hard cap). By contrast, older meme coins like Dogecoin have *infinite* supply and ongoing inflation (\~5 billion DOGE minted yearly), and even newer memes like PEPE or FLOKI rely on one-off burns or taxes. HYPE’s structured deflationary model stands out as more robust and sustainable for long-term value.
2. Ecosystem Growth, Usage, Development & Roadmap Progress
Explosive DEX Volume & TVL : Hyperliquid isn’t just a token – it’s a high-performance Layer-1 blockchain and decentralized exchange (DEX) for perpetual futures trading. The platform’s growth has been staggering. By July 2025, Hyperliquid was handling \$2–6 **billion in daily trading volume** on average, with peaks up to \$8.4B in 24 hours. This gave Hyperliquid an estimated 80%+ share of all on-chain perpetual futures trading, making it the dominant decentralized derivatives exchange. Such volume has driven its Total Value Locked (TVL) to new highs: over \$460–480 million in bridged assets by mid-2025. In fact, by late May, Hyperliquid’s DeFi ecosystem had grown so rapidly that its TVL (\~\$1.45 billion) ranked it among the top 10 blockchains (surpassing networks like Aptos and Polygon). This rapid user adoption – with over 500,000 users and \$88B in total deposits logged – provides real utility and value backing the HYPE token (e.g. HYPE is used for fees, collateral, governance, etc.). Unlike purely speculative meme coins, HYPE benefits from a thriving ecosystem where high demand for the network’s services translates into fundamental demand for the token.
Developer Activity & Upgrades : Hyperliquid’s team (comprising talent from Harvard, MIT, etc.) has delivered significant technical milestones on its roadmap, reinforcing the bullish outlook. The network’s HyperCore Layer-1 launched in early 2025, featuring sub-second block times and an on-chain orderbook optimized for speed. In March 2025, the HyperEVM environment went live, enabling Ethereum-compatible smart contracts on Hyperliquid. This opens the door for third-party dApps to deploy. Indeed, developers have begun integrating: for example, HyperBeat yield aggregator and Kinetiq liquid staking launched on HyperEVM, attracting hundreds of millions in deposits from HYPE holders seeking yields. In July 2025, the “CoreWriter” upgrade was rolled out, allowing HyperEVM dApps to interact directly with HyperCore’s exchange engine. This kind of innovation – bridging DeFi apps with the high-speed orderbook – showcases a *burgeoning development ecosystem*. It’s telling that established DeFi projects from outside networks are expanding to Hyperliquid: e.g. EtherFi, a leading Ethereum staking protocol, partnered to launch liquid staking for HYPE on Hyperliquid. All these signals – rising third-party TVL, partnerships with DeFi teams, continuous chain upgrades – point to healthy developer activity and a growing ecosystem around HYPE. By comparison, most meme coins (DOGE, PEPE, WIF) lack any meaningful dApp ecosystem or technical development, and even Floki’s utility projects (NFT game, etc.) are modest in usage. Hyperliquid’s real-world usage metrics (volume, TVL, users) and active development pipeline strongly reinforce a bullish investment case for HYPE.
User Experience & Adoption : Another factor driving Hyperliquid’s growth is its user-centric design in an important niche: leveraged crypto trading. The platform offers *zero gas fees* for trades, sub-1s transaction finality, and up to 50× leverage – essentially delivering a CEX-like experience in DeFi. This has attracted swarms of traders (from retail to high-volume pros) onto the network. The result is deep on-chain liquidity that even *institutions* are tapping into. For example, Tony G’s Co-Investment fund became the first public company to add HYPE to its treasury in early June 2025. And more dramatically, a legendary trader opened a 40× long \ CRYPTOCAP:BTC position worth \$1.1B on Hyperliquid in May – a trade highlighted by former BitMEX CEO Arthur Hayes as proof of the platform’s capacity. This kind of adoption by whales and notable figures not only boosts trading volume (and thus HYPE fees/burns), but also validates Hyperliquid’s tech. It’s no surprise Hyperliquid’s Layer-1 has climbed into the top tier of blockchains by activity. Summed up, *actual usage* underpins HYPE’s value: with hundreds of thousands of users and billions in liquidity engaged, the token has utility (fees, staking, governance) in a live financial ecosystem – a stark contrast to typical meme tokens that live and die by pure speculation.
3. Major Partnerships & Integrations
HYPE’s bullish narrative is further bolstered by an array of strategic partnerships and institutional endorsements that confer credibility and expand its reach:
Exchange & Wallet Integrations : In July 2025, Hyperliquid announced a partnership with Phantom, the popular Solana wallet boasting over 15 million users. Phantom’s integration of Hyperliquid will make it seamless for that vast user base to onboard and trade on Hyperliquid’s chain. This is expected to funnel a wave of new traders into the ecosystem, as evidenced by a volume surge to \$8.4B right after the Phantom partnership news. Additionally, Hyperliquid has been listed on major exchanges (e.g. Bybit added HYPE trading, Binance and others offer HYPE futures), improving access and liquidity for the token. The project’s bridge to Arbitrum and support for MetaMask/Trust Wallet connectivity further lower barriers for new users. These integrations are key to scaling adoption, much as easy accessibility helped Dogecoin and others gain users. For HYPE, each new wallet or exchange integration directly translates to a broader community and more utility, reinforcing bullish demand.
Circle & Stablecoin Support : In August 2025, Circle – the issuer of USDC – launched native USDC on Hyperliquid’s blockchain via its Cross-Chain Transfer Protocol (CCTP). This strategic partnership brings USDC stablecoin liquidity directly into the Hyperliquid ecosystem. As a result, Hyperliquid’s assets under management jumped to \$5.5 billion and HYPE’s price climbed \~3% on the announcement. Native USDC allows users to move funds seamlessly across chains without clunky bridges, making Hyperliquid more attractive for dApp developers and traders. USDC can now be used as collateral for Hyperliquid perpetuals and as a quote asset for spot markets, improving the trading experience. This partnership underscores Hyperliquid’s growing stature in DeFi – *stablecoin issuers are prioritizing it*. In contrast, most meme coins don’t attract such integrations. The Circle deal enhances HYPE’s fundamental value by expanding on-chain liquidity and signaling to the market that Hyperliquid is a serious DeFi player.
Institutional & Corporate Adoption: Perhaps most striking are the moves by traditional finance entities to get exposure to HYPE. In July 2025, Sonnet BioTherapeutics (NASDAQ: SOON) announced a deal to pivot into crypto by creating “Hyperliquid Strategies”, a new entity that will hold \$583 million worth of HYPE (12.5M tokens) as a treasury reserve. In total Sonnet and partners plan to inject \~\$888 million into the Hyperliquid ecosystem via HYPE purchases. This effectively makes Sonnet a proxy stock for HYPE – a novel bridge between equity markets and a DeFi token. The partnership involves heavyweights: Paradigm (co-founder Matt Huang praised Hyperliquid’s “real fundamentals and meteoric growth”), Atlas Merchant Capital (led by ex-Barclays CEO Bob Diamond), Galaxy Digital, Pantera Capital and others co-investing. Around the same time, Lion Group (NASDAQ: LGHL) secured a \$600M facility to accumulate HYPE and other layer-1 assets as primary reserves, aiming to build the world’s largest HYPE treasury. LGHL’s plan includes listing in Asia and underscores their conviction that “decentralized on-chain execution is the future of trading,” with Hyperliquid as a cornerstone. Additionally, biotech firm Eyenovia raised \$50M to acquire \~1 million HYPE and even rebranded to *Hyperion DeFi* in its shift toward the Hyperliquid ecosystem. This institutional traction is virtually unheard of for a meme/community coin – neither DOGE nor SHIB ever saw publicly traded companies restructure around them. Such partnerships validate HYPE’s credibility and inject significant long-term capital (and holding pressure) into the token. For bullish investors, it’s a sign that “smart money” sees Hyperliquid as a platform with enduring value, not just a passing hype.
Influencer & Industry Backing : HYPE has also enjoyed advocacy from prominent crypto figures. Most notably, Arthur Hayes (former CEO of BitMEX) has been a vocal supporter – in May he publicly predicted a dramatic upside for HYPE and disclosed he had acquired millions of tokens. Hayes’ endorsement amplified social media buzz and helped spark the “Altseason” narrative around HYPE. Furthermore, HYPE’s success has prompted integrators like EtherFi to collaborate (launching HYPE staking vaults) and data platforms like Grayscale to consider it in fund holdings. The breadth of partnerships – from big tech (Circle) to TradFi (Nasdaq companies) to crypto-native firms and influencers – sets HYPE apart. It suggests a convergence of communities (retail traders, DeFi users, institutions) coalescing around the Hyperliquid ecosystem. Each partnership expands HYPE’s reach and use cases, feeding a positive feedback loop for its value.
4. Social Traction: Community Hype & Engagement
Rapidly Growing Community : Despite being less than a year old, \ GETTEX:HYPE has cultivated a large and highly engaged community. On X (Twitter), the official Hyperliquid account has \~300,000 followers (as of mid-2025) – an impressive following for a DeFi protocol token. For comparison, legacy meme-coins like Dogecoin have \~4 million followers (built over a decade), and newcomers like PEPE reached \~700k in their viral peak. HYPE’s follower count, achieved organically through its airdrop and subsequent rally, signals strong interest among crypto traders. The community is very active on social platforms: crypto “Twitter” is flooded with HYPE discussions, memes (leaning into the ticker’s theme), and trading analysis. In fact, 46.6% of all tweets about HYPE in Q3 2025 were positive/bullish in sentiment – a notable indicator of optimism. Prominent analysts on X continue to champion HYPE even after pullbacks. For example, well-known traders like *@Ansem* urged followers to “mash the green button” and buy any dips below \$30, reflecting a widespread belief in the token’s upside. This viral enthusiasm has kept HYPE trending on crypto forums and helped attract new buyers during each consolidation.
Narrative of “Next Big Thing” : The social narrative around HYPE combines elements of both a meme coin and a serious altcoin, which has fueled its momentum. On one hand, the ticker “HYPE” and meme-able nature (it’s literally named HYPE) lend themselves to viral marketing – the community often jokes that “the hype is real.” On the other hand, community members frequently share stats about Hyperliquid’s real usage (TVL, volumes) to justify that *“this isn’t just a meme, it’s fundamentally strong.”* This narrative of HYPE being the leading alt of the next cycle has taken hold. Influencers like Arthur Hayes calling for a new “Altseason” led by HYPE have further catalyzed FOMO on social media. Notably, HYPE’s Reddit and Discord communities have also swelled, with users sharing technical governance proposals and how-to guides – indicating an engaged base not just holding for price, but using the network. The community’s energy is reminiscent of early Dogecoin or SHIB days, but with a more “professional” twist (many HYPE supporters are seasoned DeFi users). This blend of grassroots meme energy and informed advocacy creates a potent bullish force: *hype about HYPE* attracts more hype. As long as the community remains excited and active, it provides a steady stream of new entrants and holding support for the token.
Comparative Engagement : It’s worth noting where HYPE’s social traction stands relative to other community tokens. Dogecoin, of course, has the broadest mainstream recognition – boosted by Elon Musk’s occasional tweets and a 10+ year history of internet meme culture. Doge’s community (the “Shibes”) is massive and enduring, but Doge’s social engagement tends to spike only during major news (e.g. Musk changing Twitter’s logo to a Doge symbol) and then quiet down. Pepe (PEPE) had an explosive community growth in spring 2023, riding on the famous Pepe the Frog meme – its holders rallied to a \$1+ billion market cap in weeks purely via viral memes. However, Pepe’s engagement has been highly speculative; by 2025 its community, while still sizable, is largely composed of short-term traders and its meme appeal has somewhat normalized. Floki and WIF (DogWifHat) also have passionate bases: Floki’s “Vikings” are known for aggressive social campaigns and even real-world marketing (billboards, etc.), and WIF’s Solana community used humor (“literally just a dog with a hat”) to drive buzz. HYPE’s community momentum arguably sits between these extremes – it doesn’t yet have the pure virality of a dog or frog meme, but it enjoys credibility that draws in serious enthusiasts. The current narrative on social platforms portrays HYPE as *both* a meme (with tongue-in-cheek slogans about “ride the hype”) *and* the “next Solana” or “next BNB” in terms of growth【50†】. This narrative cocktail supports a bullish bias: it appeals to speculative meme investors and those looking for fundamentally sound altcoins, thereby broadening HYPE’s audience. As long as Hyperliquid continues to deliver growth and the community keeps beating the drum, the social hype-cycle can sustain itself, attracting new buyers on each pullback.
Volatility & Risk Management : It’s important to note that HYPE, like all crypto, remains volatile. Daily swings of 5–10% are common, and its beta is high given it’s both a DeFi altcoin and a community-driven token. For instance, in late May 2025 HYPE dropped \~24% from \~\$39 to \$30 during a broader market shakeout, before roaring back in June. Such swings require caution; traders are advised to watch Bitcoin’s trend (as HYPE tends to move in tandem with altcoin cycles) and broader market liquidity. Still, HYPE’s overall market structure is bullish – higher highs and higher lows on macro frames – as it rides both strong fundamentals and retail enthusiasm. The presence of high-profile supporters and institutional holders may also dampen extreme volatility, as these actors could step in to accumulate on dips (providing some support). The technical outlook, combined with HYPE’s growing fundamentals, suggests that *any sustained positive market environment could see HYPE outperform*, whereas negative shocks could lead to sharper corrections but likely find buyers at key supports. In summary, from a TA perspective HYPE is in a *favorable position*, with a clear uptrend, solid support levels identified, and multiple indicators pointing to continued strength if current conditions hold.
Given these factors, HYPE’s current trajectory does support a bullish bias. It has a lot of positive catalysts in play (platform growth, altcoin market tailwinds, active community) and fewer apparent weaknesses than its meme-coin peers. That said, prudent bulls will acknowledge external risks: a severe crypto market downturn or regulatory action could dampen even the strongest narrative. Meme coins notoriously implode when momentum shifts – HYPE is somewhat insulated by fundamentals, but in a panic its price could still be vulnerable to a swift correction due to how quickly it rose. Additionally, the sustainability of hype is always a question: can Hyperliquid keep delivering growth to maintain excitement? The comparison tokens show that hype can be fickle (Pepe’s flash fame, Doge’s dependence on Musk tweets, etc.). For now, however, HYPE’s blend of substance and hype appears to be striking the right chord. As long as the narrative of “Hyperliquid = next-gen DeFi + community fervor” remains intact and supported by data, the bias among investors is likely to remain bullish on \ GETTEX:HYPE relative to the more purely speculative meme tokens.
In conclusion , \ GETTEX:HYPE offers a compelling bullish case by marrying strong tokenomics (scarce, deflationary, utility-bearing) with explosive ecosystem growth and social momentum. It outshines traditional meme coins on fundamentals and matches them in community enthusiasm, even if it lacks a famous mascot. The extensive partnerships and institutional buy-in further differentiate HYPE as a meme-born token that’s maturing into a legitimate large-cap asset. While no investment is without risk – and HYPE will need to continue “delivering the hype” to justify its rapid rise – its current narrative is one of *leadership in a new market trend*. Compared to \ CRYPTOCAP:DOGE , \ CRYPTOCAP:PEPE , \ SEED_WANDERIN_JIMZIP900:WIF , or \ SEED_DONKEYDAN_MARKET_CAP:FLOKI , HYPE stands out as the most well-rounded bullish prospect. Its momentum is supported by both narrative excitement and measurable adoption, a combination that suggests its hype may have real staying power this cycle. Investors bullish on the altcoin market’s future are therefore biased to view HYPE favorably, as it encapsulates the zeitgeist of 2025’s crypto rally – high performance, community ownership, and yes, a whole lot of *hype*.

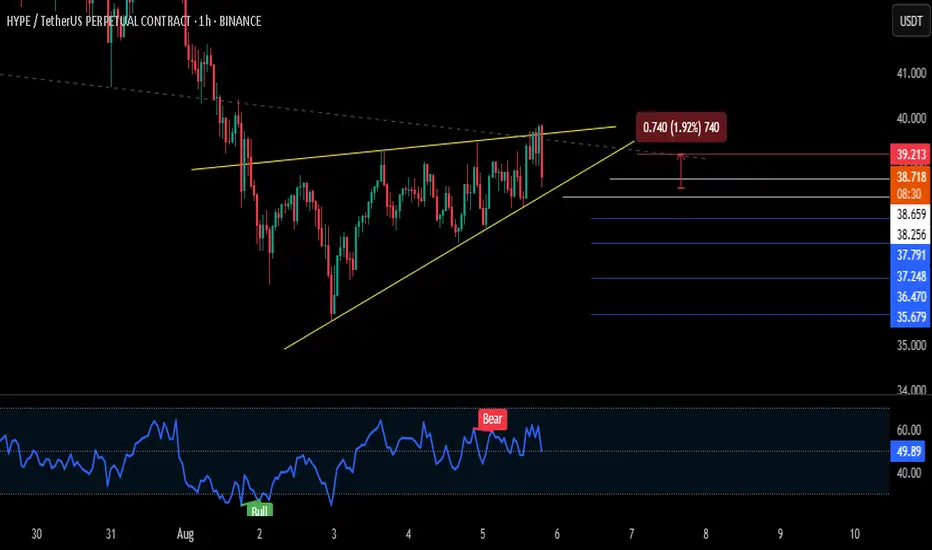
$HYPE - Short SignalBINANCE:HYPEUSDT.P
⚠️ HIGH RISK TRADE
🛑 SHORT
The price is within a rising wedge pattern and exhibits bearish divergence.
📈 Entry if breaks below (38.256), DCA (38.659).
🎯 TAKE PROFIT: Blue Lines
🛑 STOP LOSS: 39.213 (📊 4H Candle Close Above)
⚠️ High Risk – Manage Your Position Wisely!
📌 NFA – DYOR 🧠
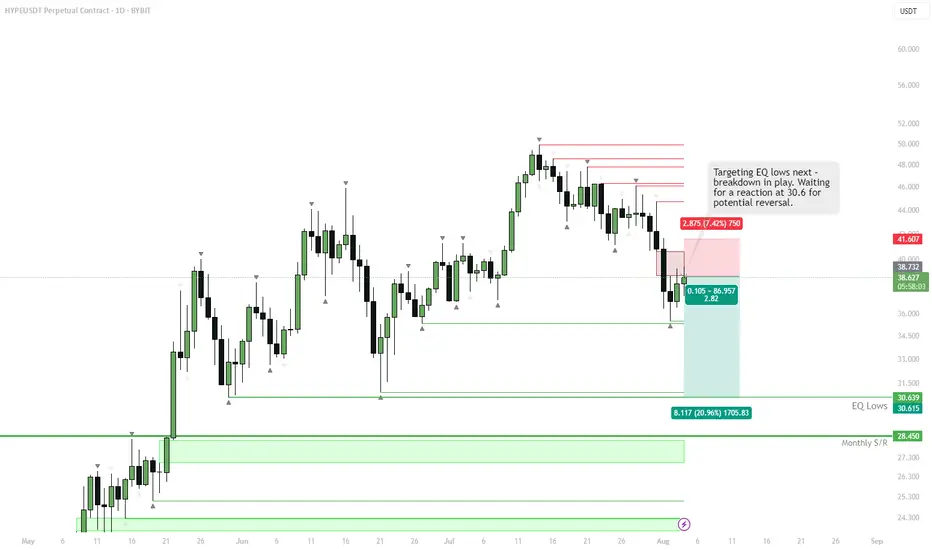
HYPE – EQ lows next Local breakdown confirmed after losing support, with no clear reversal signal yet. Structure favors a continued move lower toward the equal lows around 30.64. Momentum is still to the downside, so no reason to anticipate a bounce early.
Plan:
• Main target: EQ lows zone (~30.64)
• If monthly S/R at 28.45 doesn’t hold, further downside opens up
• No long setups until a reaction and reclaim of a key support
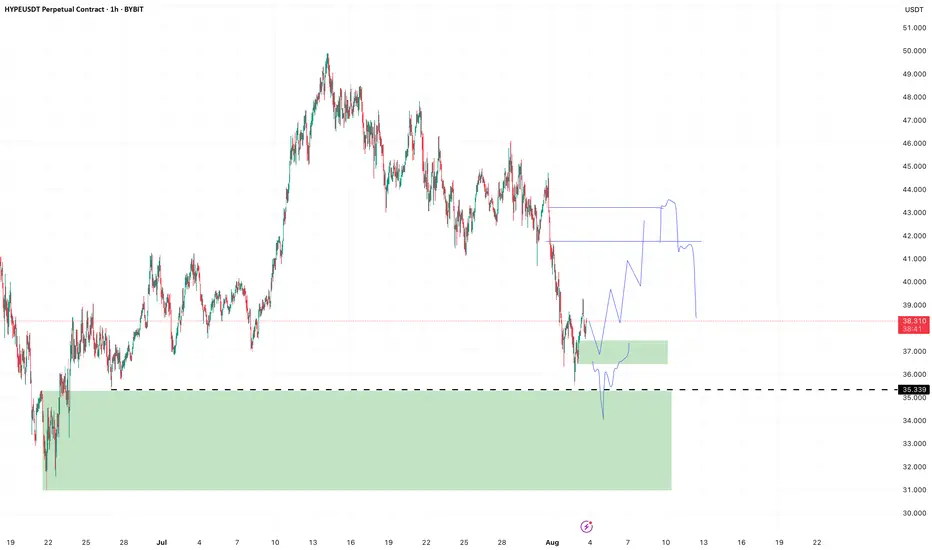
HYPE - Imbalance to be filledVery nice imbalance on HYPE here, I think there are a few different things to keep an eye on, money to be made for sure.
Technically an msb on H1, although again a strong rejection and only a very short time spent above the msb. But we can try a long on the retest in the green box, if we get it. Stop is below the low.
Second long attempt is enter where we just got stopped, but only on a reclaim OR look for ltf entry in the big green box below.
Both tps are in the imbalance shown on the chart, from where we can eye rejection for trend continuation down.
HYPEUSDT at Support HYPEUSD is trading in a symmetrical triangle and price has now reached the support trendline the price may reverse from here to reach the upper trendline resistance .
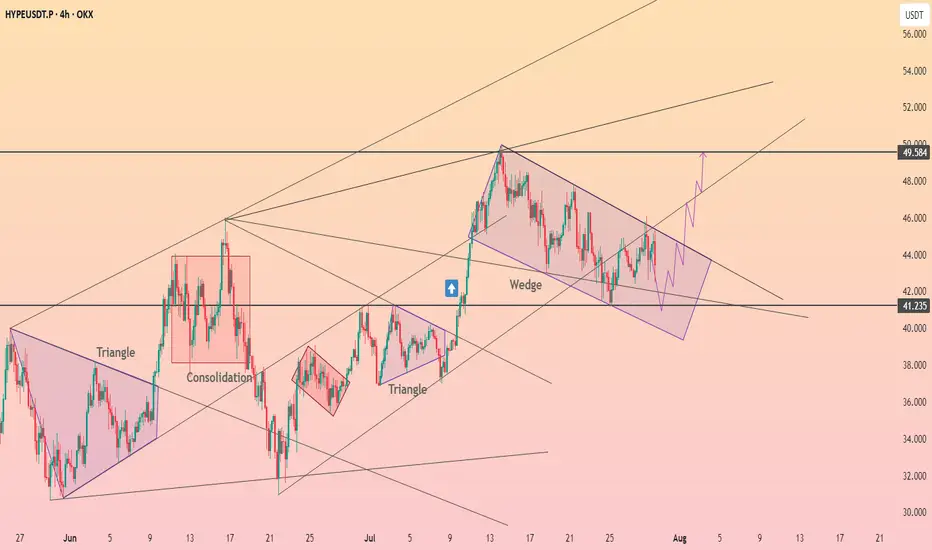
Hyperliquid reached the upper limit of the wedge ┆ HolderStat$BINANCE:HYPEUSDT is currently trading within a falling wedge after a sharp bullish move. Price is consolidating near key support around 41.2, showing signs of pressure building for a potential breakout. A clean break above the wedge resistance may open the path toward 49.5, aligning with the higher trend channel projection.