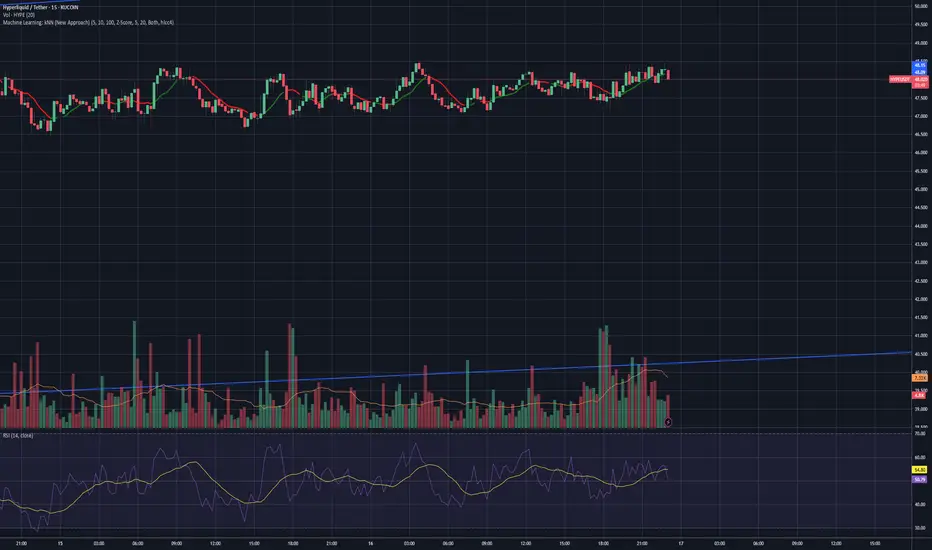
HYPE 1D SHORT SETUPGETTEX:HYPE has rallied into the Equal Highs zone at $28.470—a classic stop-run area ahead of a potential reversal. Below, unfilled weekly FVG around $16.311 and a demand cluster at $22.937–21.480 set clear targets.
Checklist & Context
Uptrend in place (HH/HL) into Equal Highs (~$28.47)
Prior moves saw liquidity grabs above highs, then swift returns
Demand sits at $22.937–21.480 (green zone)
Unfilled FVG at $16.311–16.335
Plan
– Primary: Short on a false-break or stop-run above $28.470 with a quick reclaim below
– Alternate: If price stalls < $28.47, watch $25–26 for a reversal setup
Triggers
• SFP / fake break above $28.470 followed by a close back under
• Impulsive drop into $22.937–21.480 → partial profit-taking
• Acceleration into the weekly FVG → exit remaining
Levels
• Sell Zone: > $28.470
• Take-Profits:
1️⃣ $22.937
2️⃣ $21.480
3️⃣ $16.311 (weekly FVG)
• Stop-Loss: > $31.427
Wait for clean reversal signals—no rush into the short until the high-stop reset is confirmed.
HYPEUSDT trade ideas
Hyperliquid: Your Altcoin ChoiceLow volume lower low and high volume reversal candle.
Here we do not have six months of data but the chart looks pretty clear. It is simple to read.
I can spot two perfect 5-waves pattern, one going down and another one going up.
Going down is the second one, the correction, and the session that hit a new bottom ended up as a higher low based on the close. That is, the low in December 2024 is $10. The low 7-April is $9.3 but the close happened at $11.5. ($11.5 higher than $10 ).
This can be a bullish signal.
Today's candle trades higher than the 13-March low. A full green candle.
After going down, the market tends to reverse and go up. The action is bullish on the short-term and this is a short-term chart.
Hyperliquid is good as long as it trades above support.
"Support" is clearly depicted orange on the chart.
I used this chart setup to open a short-term based trade.
The main targets are 145% & 270% as shown on the chart.
Thank you for reading and for your continued support.
You are appreciated.
Namaste.
$HYPEUSDT long trade set-up!GETTEX:HYPE is currently holding strong above both the ascending trendline and the 50 EMA, bouncing off a key support zone.
🔹 Support retest looks successful
🔹 As long as the trendline holds, bullish continuation is likely
🎯 Targets:
TP: $29.79
🛑 Stop-loss: $24.95 (below trendline & support)
Check if it can hold the price above 26.37
Hello, traders.
If you "Follow", you can always get new information quickly.
Have a nice day today.
-------------------------------------
Hyperliquid token is a decentralized exchange token.
It forms the Hyperliquid Ecosystem.
To see if Hyperliquid can survive in the coin market in the future, we will have to see if the ecosystem expands.
---------------------------------------------
(HYPEUSDT 1D chart)
We need to see if the price can be maintained by rising above the Fibonacci ratio 1 (35.51).
If so, the next target range is expected to be around the Fibonacci ratio 1.618 (51.70).
-
The HA-High indicator on the 1D chart is formed at the 26.37 point.
Therefore, if it falls, we need to check if it is supported near the HA-High indicator on the 1D chart.
The current volume profile section is formed over the 19.59-23.19 section.
Therefore, if it falls to the maximum, it is expected that the 19.59-23.19 section will act as a strong support.
-
(30m chart)
Since the chart was created not long ago, it is difficult to analyze the chart over a long period of time.
Therefore, when trading these coins (tokens), it is recommended to trade mainly in short-term trading (day trading) or increase the number of coins (tokens) corresponding to the profit by increasing the number of coins (tokens).
-
The basic trading strategy is to buy when it receives support near the HA-Low indicator and sell when it meets the HA-High indicator.
However, if it is supported and rises near the HA-High indicator, there is a possibility of a stepwise upward trend, so you should think about how to proceed with a split transaction.
If it is resisted and falls near the HA-Low indicator, there is a possibility of a stepwise downward trend, so you should also think about a response plan for this.
-
In any case, you can see that it must rise above 33.89 to continue the upward trend.
Therefore, the key is whether it can rise with support near 33.17-33.89.
Currently, OBV > OBV EMA, so when it rises above the High Line, you should check whether it can maintain the price by rising above the 33.17-33.89 range.
-
Thank you for reading to the end.
I hope you have a successful transaction.
--------------------------------------------------
- This is an explanation of the big picture.
(3-year bull market, 1-year bear market pattern)
I will explain more details when the bear market starts.
------------------------------------------------------
Hyper/USDT (1H) – Head & Shoulders Breakdown
The chart reveals a classic Head and Shoulders pattern formation, signaling a potential bearish reversal in the current trend. This is a well-known structure used by traders to anticipate market turnarounds after an uptrend.
🧩 Pattern Structure:
Left Shoulder, Head, Right Shoulder: Clearly defined, suggesting the exhaustion of bullish momentum.
Neckline Break: Price has just broken below the neckline support (circled zone), triggering a potential short opportunity.
Entry (Short Position): Ideal entry is just below the neckline confirmation, where price breaks down and retests the zone.
Stop Loss (SL): Placed above the right shoulder – a break above this level would invalidate the pattern.
Take Profit (TP): The target is projected based on the height from the head to the neckline, pointing to the 24.34 level as the main downside objective.
📉 Conclusion:
This setup presents a clean bearish opportunity with a well-defined risk-to-reward ratio. If price sustains below the neckline with momentum, we could see a continuation toward the TP level. Traders should remain cautious and manage risk accordingly. ⚠️
Hyperliquid (HYPE): Reached Zone of Rejection | Possible Drop ! Hyperliquid has reached the next resistance zone, where we are seeing some sort of weakness already. Now we are looking for a proper MSB from here, which would give us the last sign of possible downward movement so keep your eyes open for it!
Swallow Academy
Hyperliquid (HYPE) Structural Breakout: Target $60+ HYPE just broke out from a major downtrend on the weekly chart and it’s looking strong.
I’m targeting $60 as a realistic level this year, and there’s a good chance HYPE makes it into the T op 10 crypto market cap if this momentum holds.
Here’s why I’m bullish:
Price broke out of the falling channel and closed above $25 weekly resistance.
Strong buying volume shows big players are stepping in, especially after that accumulation zone between $9 and $18.
Based on Fib extension, $60 lines up perfectly as the next major target and a psychological resistance level.
The Hyperliquid narrative is strong. Positioned as a real on-chain CEX alternative with solid user growth and rising TVL.
My trade setup:
Entry around $20 to $26.
First target at $37.5, final target at $60.
Stop loss if price closes below $18 weekly (that would kill the bullish case for me).
This isn’t financial advice , just sharing how I’m seeing the market.
Always manage your risk and don’t FOMO in at the top.
Rising wedge short the “hype”This is another short using leverage on gmx plan and set risk/reward accordingly as the risk with margin trading is always very high. Anyways heres some statistics on the rising wedge.
Effectiveness of Wedge Patterns as Indicators
Statistical analyses show that rising wedges lead to price breakdowns over 76% of the time, while falling wedges signal bullish reversals about 68% of the time. The statistical results of wedge patterns serve as a guide, revealing paths to either profit or loss depending on trader interpretations. These compelling metrics highlight the effectiveness of including wedge patterns in trading strategy.
Red line is stop loss greens are targets.
We also have some divergence (bearish) going on. Bearish divergence occurs when the price of an asset makes a higher high while a momentum indicator, like the Relative Strength Index (RSI), makes a lower high. This pattern suggests that the upward momentum is weakening, indicating a potential reversal to a downtrend. This, alone with falling volume throughout the entire wedge is a recipe for a high percentage trade. As always,
GL bois.
$HYPE: The Return of the King or Another FakeoutThe $HYPE/USDT chart just broke through key resistance levels with a massive green thrust, pushing past $21.89 and rocketing above $25.50 — levels we haven’t seen since February.
Here’s why this breakout matters:
✅ Reversal Confirmation:
We’ve been in a textbook downtrend from February through early April, but notice the clean series of higher lows and higher highs building over the past month. This isn’t just a bounce — it’s a structural trend shift.
✅ Dynamic Resistance Flipped:
Both the $21.89 and $17.43 dynamic resistances (marked on the chart) were cleanly smashed and are now acting as support. This flip is crucial because it shows buyers aren’t just testing — they’re claiming territory.
✅ Volume and Candle Strength:
Look at the size of those recent green bars: big-bodied candles, minimal wicks, aggressive closes. That’s momentum money stepping in.
✅ Sentiment Surge:
The ticker is literally called GETTEX:HYPE , but this is real hype — we’re watching the market front-run the rest of retail, setting up for a potential FOMO wave once we breach $27–$28 (Yearly High region).
But Here’s the Caution:
⚠️ We’re entering a high-liquidity hunting zone between $25.50 and $28. This is where algorithms often bait breakout traders, whip back, and refill lower.
Hypecoin Flips $20 — Bullish Trend Targets $29 Next
Hypecoin has officially flipped the $20 resistance into support — a key SR level that marks bullish continuation in the current trend structure.
Market Structure: Price is printing higher highs and higher lows.
SR Flip: $20 resistance now acting as daily support.
Fibonacci Confluence: 0.618 Fib aligns with $20, strengthening support zone.
Next Target: $29 — a potential 41% move from current levels.
If price retests the $20 area and holds, it will confirm a bullish SR retest with Fib support, increasing the probability of rotation up toward $29. Traders should monitor how price reacts around the $20 mark — failure to hold could invalidate the short-term bullish setup, but as long as that level holds, momentum remains upward.
TradeCityPro | HYPE: Bullish Momentum Builds Near Resistance👋 Welcome to TradeCity Pro!
In this analysis, I’m going to review the HYPE coin for you. The Hyperliquid project is one of the DEX projects in the crypto space that also functions as a Derivatives platform, and it currently holds the highest 24-hour volume among all DEXs.
🔍 The token for this project, with the symbol HYPE, has a market cap of $7.23 billion and is ranked 20th on CoinMarketCap.
⏳ 4-Hour Timeframe
In the 4-hour timeframe, as you can see, this coin is in an uptrend with an ascending trendline, and it’s currently encountering resistance at 21.48.
📈 If the price stabilizes above this zone, a new bullish wave can begin, with the next resistance being at 22.799.
✔️ You can enter a long position using the 21.48 breakout trigger. Buying volume has increased significantly, which raises the chances of this level breaking.
📊 For short positions and a potential bearish trend in this coin, the first trigger would be a rejection from the 21.48 resistance. If the price gets rejected at this level, the likelihood of breaking the trendline increases.
⭐ A break of the trendline itself can also serve as a trigger. Breaking this trendline would eliminate bullish momentum in the market, and a breakdown below the 39.29 level on the RSI would further support bearish momentum.
🔽 The main short position can be opened upon breaking the 19.552 level. This is a very strong support, and if the price closes below it, it could drop further to 17.88.
👀 Overall, the long setup on this coin looks quite logical, and if the 4-hour candle closes as is and doesn’t turn out to be a fakeout, it could be a great entry opportunity.
📝 Final Thoughts
This analysis reflects our opinions and is not financial advice.
Share your thoughts in the comments, and don’t forget to share this analysis with your friends! ❤️
$HYPE | 1d longKUCOIN:HYPEUSDT is stalling at the Range Low zone after big moves—time to scale in smart, not chase.
• Clear reaction off Range Low resistance
• 50% of my position booked in the red zone, 50% still live in spot
• Structure remains bullish within the larger rounding base
Scenario 1: Confirmation Above Range Low
🔹 Trigger: Daily candle closes & successfully retests above Range Low (~$17.50)
🔹 Entry: Add at $16.4 - $15.1
Scenario 2: Pullback to Lower Base
🔹 Trigger: Price dips back into the lower range demand zone (~$11.50–12.50) with a bullish reversal candle
🔹 Entry: Add at $11.50–12.50
Targets:
🔹Prior supply zone (~$24–25)
🔹Long-term range high ($36)
Note: Be ready for short-term drawdown—no panic, we’re scaling in per plan.
Stay patient & follow the triggers. Good risk management wins.
HYPE | #12h Fakeout & Recovery SetupContext:
After a clean fakeout below the green demand zone, KUCOIN:HYPEUSDT reclaimed structure and is now holding above the range low — potential start of base formation before trend shift.
🔍 Local Range Setup:
✅ Fakeout confirmed
✅ Reclaim above range low
🎯 Next: Retest of red supply zone ($18.9–21) on the table
📌 Trading Strategy:
— Waiting for potential pullback to previous demand zone for a full entry
— Target: top of range ~ $20
— Invalidation: clear break below reclaim zone
🧠 Macro View:
— Short-term: Likely to tag red zone if structure holds
— Long-term: base forming. Full confirmation = break & hold above supply.
If not — a revisit to $5–10 is still on the table.
Hypecoin Hits Range High – Reversal or Breakout Ahead?Hypecoin has rallied into the range high after reclaiming the range low in a textbook failed auction setup. This area now poses a potential reversal zone unless further strength confirms.
Key Points:
Price reclaimed the range low after a failed auction, leading to an impulsive rise.
Currently testing range high resistance with decreasing momentum and volume.
Outlook:
If Hypecoin fails to break above this resistance, a pullback becomes more likely. However, a strong breakout above the range high with volume confirmation could flip the zone into support and open the door for further upside.
Hypecoin is testing key resistance at its range high after an impulsive rally. A failed auction here could trigger a reversal if bullish momentum doesn’t follow through.
Hyperliquid HYPE price analysisLooking at the OKX:HYPEUSDT.P chart, we can assume that the cryptocurrency market is likely to start #Hype's in May.
🔼 The capitalization of the #Hyperliquid project is already quite large in the current realities - $5.6 billion, so the forecast for x2 growth is quite optimistic-realistic.
And so, all the key levels are on the chart!)
🥚 Have a nice Easter holiday
_____________________
Did you like our analysis? Leave a comment, like, and follow to get more
Hyperliquid Surged 12% Today Gearing For Another Leg-upThe price of Hyperliquid surged 12% today amidst the general crypto market dip. According to data from Lookonchain monitoring, about 2 hours ago, a whale deposited 6 million CRYPTOCAP:USDC into Hyperliquid and went long on CRYPTOCAP:ETH at a price of $1,624.44 with a 5x leverage.
This data signifies a growing interest in the Hyper liquid Dex. Similarly, data from Defilama shows about $277.3 million locked in Total Value Locked (TVL) in the Hyperliquid ecosystem and this is for a project that is just 5 months from token lunch.
With the Resistant and support point already marked, should GETTEX:HYPE coin break above the $17 resistant zone, the $20 pivot will be feasible. However, failure to break above the resistant point could resort to a selling spree to the $9 support resorting to the break below the Moving averages respectively as that is the only nearest possible support point for $HYPE.
What is Hyperliquid?
Hyperliquid represents a cutting-edge blockchain platform, specifically designed to enhance the efficiency and performance of decentralized finance (DeFi) applications. At its core, Hyperliquid introduces a novel Layer 1 (L1) blockchain that is meticulously engineered from the ground up to optimize performance and scalability.
Hyperliquid Price Data
The Hyperliquid price today is $15.97 USD with a 24-hour trading volume of $141,575,547 USD. Hyperliquid is up 1.87% in the last 24 hours. The current CoinMarketCap ranking is #23, with a live market cap of $5,333,694,243 USD. It has a circulating supply of 333,928,180 HYPE coins and a max. supply of 1,000,000,000 HYPE coins.
Will This Descending Wedge Push HYPE to 22.5?If we take a closer look at the price structure, the orange and blue arrows show that BITGET:HYPEUSDT is in an overall uptrend. Meanwhile, the white arrow represents a minor pullback—just a ripple within the bigger trend.
When we connect the orange to the white, and then the white to the blue arrow, we can spot a descending broadening wedge formation. Given the current bullish structure, this pattern is more likely acting as a continuation rather than a reversal.
After the pattern is completed, the key level to watch is the resistance around 16.62, which comes from the white arrow's high. This level will decide whether price can break through and continue its bullish momentum toward the target zone at 20.52 – 22.55, or if sellers will step in and cause a rejection.
In case of a rejection, we might see some sideways movement as the market consolidates before making the next move.
$HYPE | 12h structure-based scenario longThe H12 bearish OB has been broken and now acts as a bullish breaker — a shift toward a more bullish market structure.
Currently forming equal highs just below the lower H12 swing high — potential liquidity trap setup.
📌 Potential setup:
— Sweep above local highs → retrace into the H12 bullish breaker
— Support near the range low ($10.7–12.0) could offer a long entry.
— If we hold the H12 OB + breaker zone, the move toward the H12 FVGs (up to $18–19.5) stays valid.
⚠️ Key levels:
— Support: $10.7–12.2 (bullish breaker + OB)
— Resistance: $14.6–15.6
— Target: $18–19.5