HYPE Precision Trading — Pattern, Patience, ProfitHYPE has shown strong performance since early April, maintaining a clear uptrend. Currently, the market is consolidating in a range between $30 and $40 and it’s setting up for something interesting. Let’s break it down and map the next high-probability trade setup.
Potential Gartley Harmonic Pattern Forming
A valid Gartley pattern may be developing, with point D potentially forming around the $29 level. This zone offers solid confluence for a high-probability long setup.
🟢 Long Setup – Gartley Harmonic Pattern Completion at around $29
Confluences around $29–$28.3:
0.786 Fib retracement of XA
Trend-based Fib Extension 1:1
Negative -0.618 Fib as take-profit level for prior short
Anchored VWAP (0.666 band multiplier) acting as dynamic support
200/233 EMA/SMA support on the 4H TF
FVG + liquidity pool resting just below $30
Setup Details:
Entry Zone: Trend-based Fib Extension 1:1 or laddered between $30–$28.3
Stop Loss: Below $27.5 (adjust depending on where point D forms)
Target: 0.618 of CD leg ≈ $34.4
R:R ≈ 1:3.5
🔴 Short Setup – look for rejection at $36
0.618 Fib retracement from previous move (ideal short entry)
Invalidation: Break above $38.2 (above point C)
Take Profit: $30-$29
R:R ≈ 1:3
🧠 Educational Insight:
Harmonic patterns offer precise entries and targets by aligning Fibonacci levels with market structure. When combined with tools like Anchored VWAP and liquidity analysis, they become powerful tools for swing trading.
Summary:
HYPE continues to respect structure beautifully, offering repeated swing setups in the 10%–20% range. With clear fib symmetry and predictable behaviour, it remains one of the more technically sound altcoins.
Stay patient. Wait for the pattern to complete. As always — don’t chase. Let the trade come to you.
_________________________________
If you found this helpful, leave a like and comment below! Got requests for the next technical analysis? Let me know.
HYPEUSDT trade ideas

Hyperliquid's next move has already been defined, and here it is⚡️ The weekend is coming to an end, and we continue to look at altcoins ahead of the new week!
Hype is an interesting token that literally rose from the ashes and is one of the few that updated its ATH on this momentum. But the question remains: should we expect an ATH reset or will we see a correction?
Let's figure it out!
📊 Technical Analysis:
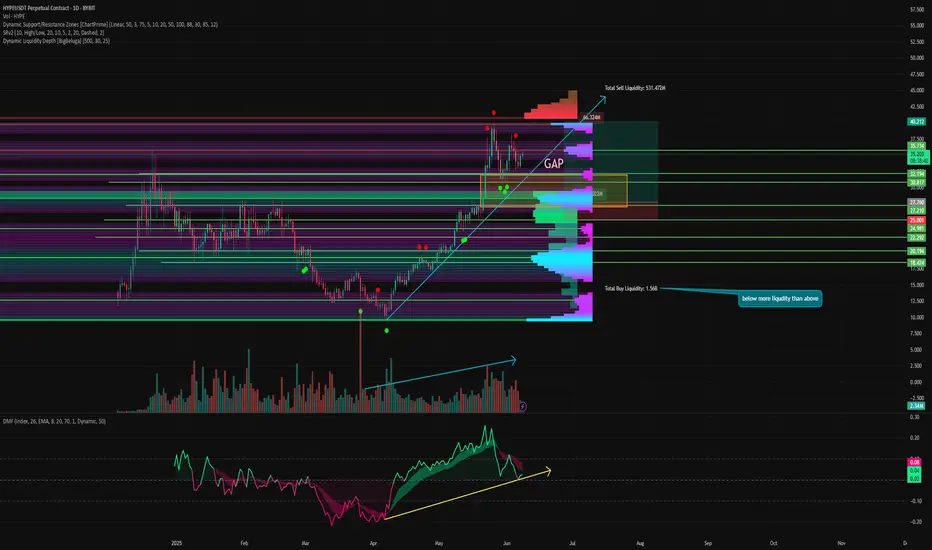
Hype continues to move in an upward momentum. It has not yet encountered any major corrections and has not even tested its sloping support. Locally, the token has now shown a Lower High and is likely to go lower without encountering sufficient buyer interest.
In addition, there is a small GAP below us in the range of 32-27. And as we know, 99% of GAPs close sooner or later.
⚙️ Metrics and indicators:
Volume - purchase volumes are decreasing, gradually forming a divergence, while sales volumes are growing. This indicates that many are now fixing their profits at these levels.
Money Flow - is in a neutral state. Positions are being fixed, and no fresh liquidity is currently observed in the asset.
DSRZ - we see the first major support level at 29-27. This is just below the GAP level. The next major support level is at 20-17.
At current prices, there is virtually no interest in trading in the market.
Liquidity Depth - there is currently significantly more liquidity in longs than in shorts. And the price tends to move from one liquidity zone to another, with liquidity serving as fuel for price movement.
📌 Conclusion:
HYPE is clearly overheated right now. It is one of the most overheated assets on the market. And when a real correction begins on the market, it will be one of the first to fall. Since it is currently holding at the ATH level, profit-taking has not really begun yet. Many expect it to continue.
I don't really expect us to see a new ATH, even if Bitcoin updates its own.
Right now, everything points to HYPE awaiting a correction. In particular, due to a lack of liquidity, as summer is approaching, which is traditionally a quiet period.
💡 Personally, I expect the GAP to close and the first support point to be reached. There will be high buyer demand and we may see a short squeeze to shake out early short sellers.
Have a great week, everyone!
Hyperliquid: Your Altcoin ChoiceLow volume lower low and high volume reversal candle.
Here we do not have six months of data but the chart looks pretty clear. It is simple to read.
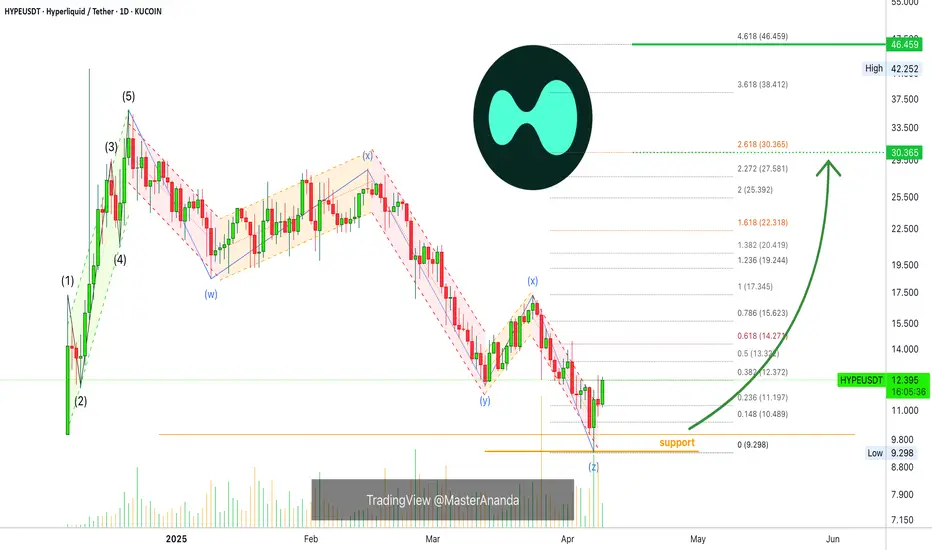
I can spot two perfect 5-waves pattern, one going down and another one going up.
Going down is the second one, the correction, and the session that hit a new bottom ended up as a higher low based on the close. That is, the low in December 2024 is $10. The low 7-April is $9.3 but the close happened at $11.5. ($11.5 higher than $10 ).
This can be a bullish signal.
Today's candle trades higher than the 13-March low. A full green candle.
After going down, the market tends to reverse and go up. The action is bullish on the short-term and this is a short-term chart.
Hyperliquid is good as long as it trades above support.
"Support" is clearly depicted orange on the chart.
I used this chart setup to open a short-term based trade.
The main targets are 145% & 270% as shown on the chart.
Thank you for reading and for your continued support.
You are appreciated.
Namaste.
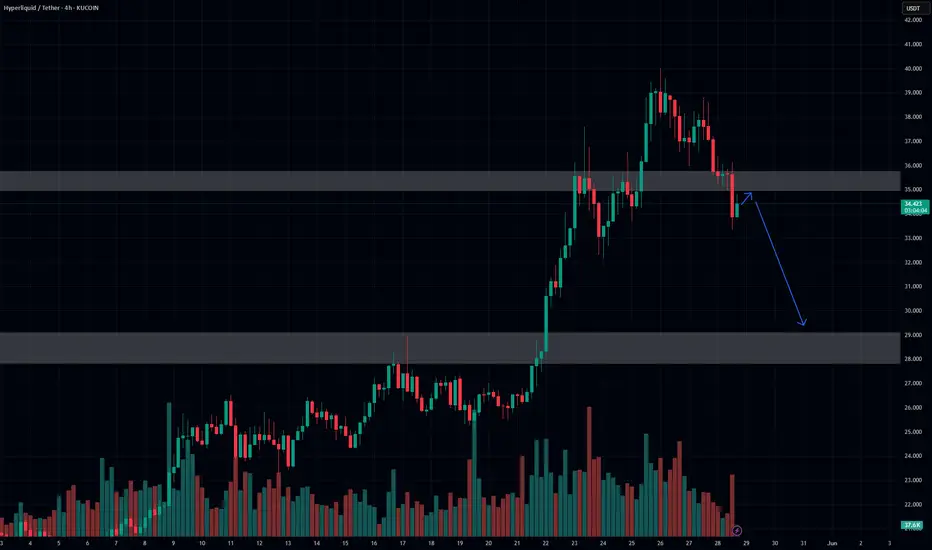
$HYPE - Short-term OutlookKUCOIN:HYPEUSDT | 4h
Price already retested the supply zone at $38
Local support is around $32, however, not sure if we'll get a bounce at this level.
If CRYPTOCAP:BTC sweeps the 100k-99k lows, KUCOIN:HYPEUSDT could revisit $30–27 range

HYPE/USDT – 4H Chart Analysis PUMP TO $50??HYPE/USDT – 4H Chart Analysis
Volume (OBV Indicator):
The On-Balance Volume (OBV) has broken above its local resistance level, indicating a notable increase in bullish volume inflow. This supports the current upward momentum.
Market Structure:
High Time Frame (HTF): Still bullish.
Lower Time Frame (LTF): Currently consolidating within a bullish pennant pattern.
Price has recently closed just above the pennant’s resistance line, suggesting a potential breakout and continuation of the bullish trend.
Key Zones & Levels:
Supply Zone: Price is currently testing this zone. A successful hold and breakout above the previous swing high would confirm bullish continuation.
Fair Value Gaps (FVGs):
A small FVG exists just beneath current price between key support/resistance levels. This may act as a short-term magnet for price (potential retracement).
Two larger FVGs on the 1D time frame lie below the current support and prior swing low. If price moves into these levels, it would likely be a liquidity sweep, trap, or fakeout scenario.
Psychological Levels: $40.00 and $45.00 are the next logical upside targets if bullish momentum continues beyond the swing high.
Trade Setup:
Entry: At the 0.28 Fibonacci retracement level.
Stop Loss: Just below the 0.5 Fibonacci level.
Take Profit (Partial): At the 0.618 Fibonacci extension, aligning with a psychological resistance zone.
Summary:
The breakout from the bullish pennant, combined with increasing volume (OBV breakout), suggests strong bullish momentum. As long as price holds above the pennant and key support, continuation toward $40–$45 remains the probable scenario. Any dip into the lower FVGs would likely be a liquidity event rather than a trend reversal.
(NOTE: This is not financial advice, it is recommended to always (DYOR) (Do Your Own Research)

HYPE/USDT – Symmetrical Triangle BreakoutHYPE/USDT – Symmetrical Triangle Breakout
HYPEUSDT has broken out of a symmetrical triangle pattern, which often signals a strong upcoming move. If the breakout holds above the structure with consistent volume, we could see a continuation toward higher targets.
Symmetrical triangles are neutral patterns, but a breakout to the upside usually indicates bullish momentum building up.
Key levels to monitor:
– Breakout confirmation zone
– Immediate resistance above
– Retest of the triangle (if it happens)
Keep an eye on it — if HYPE sustains above the breakout level, a solid upward move may follow.

HYPEUSDT 1D#HYPE — Is $80 within reach? 👀
#HYPE has formed a Rounding Bottom pattern and successfully broken above the neckline on the daily chart.
It’s now retesting the neckline, which serves as a crucial support zone. A strong bounce from here could ignite the next leg up. 🔥
Potential targets if momentum continues:
🎯 $40.000
🎯 $45.947
🎯 $49.570
🎯 $54.728
🎯 $61.298
🎯 $69.649
🎯 $74.000
🎯 $80.272
👁 Keep a close eye on the daily candle close for confirmation.
⚠️ As always, use a tight stop-loss to protect capital.

Check if it can hold the price above 26.37
Hello, traders.
If you "Follow", you can always get new information quickly.
Have a nice day today.
-------------------------------------
Hyperliquid token is a decentralized exchange token.
It forms the Hyperliquid Ecosystem.
To see if Hyperliquid can survive in the coin market in the future, we will have to see if the ecosystem expands.
---------------------------------------------
(HYPEUSDT 1D chart)
We need to see if the price can be maintained by rising above the Fibonacci ratio 1 (35.51).
If so, the next target range is expected to be around the Fibonacci ratio 1.618 (51.70).
-
The HA-High indicator on the 1D chart is formed at the 26.37 point.
Therefore, if it falls, we need to check if it is supported near the HA-High indicator on the 1D chart.
The current volume profile section is formed over the 19.59-23.19 section.
Therefore, if it falls to the maximum, it is expected that the 19.59-23.19 section will act as a strong support.
-
(30m chart)
Since the chart was created not long ago, it is difficult to analyze the chart over a long period of time.
Therefore, when trading these coins (tokens), it is recommended to trade mainly in short-term trading (day trading) or increase the number of coins (tokens) corresponding to the profit by increasing the number of coins (tokens).
-
The basic trading strategy is to buy when it receives support near the HA-Low indicator and sell when it meets the HA-High indicator.
However, if it is supported and rises near the HA-High indicator, there is a possibility of a stepwise upward trend, so you should think about how to proceed with a split transaction.
If it is resisted and falls near the HA-Low indicator, there is a possibility of a stepwise downward trend, so you should also think about a response plan for this.
-
In any case, you can see that it must rise above 33.89 to continue the upward trend.
Therefore, the key is whether it can rise with support near 33.17-33.89.
Currently, OBV > OBV EMA, so when it rises above the High Line, you should check whether it can maintain the price by rising above the 33.17-33.89 range.
-
Thank you for reading to the end.
I hope you have a successful transaction.
--------------------------------------------------
- This is an explanation of the big picture.
(3-year bull market, 1-year bear market pattern)
(3-year bull market, 1-year bear market pattern)
I will explain more details when the bear market starts.
------------------------------------------------------

SHORT $HYPEI love Hyperliquid, but everything that goes up eventually comes down.
Great SHORT opportunity in GETTEX:HYPE to buy later on SPOT in that same zone using the short profits.
Hyperliquid
HYPEUSDT Market Analysis: Leading Crypto Performance and TradingHYPEUSDT Emerges as Top Performer in Current Crypto Cycle
HYPEUSDT has established itself as one of the leading assets in the current crypto cycle, demonstrating exceptional strength that has caught the attention of traders and analysts alike. The cryptocurrency has recently achieved a significant milestone by breaking through its long-term resistance level, marking what appears to be a potential major sign of strength in the broader market context.
Technical Breakthrough Signals Bullish Momentum
The recent price action in HYPEUSDT represents more than just a typical breakout. This cryptocurrency has positioned itself as one of the best outperformers in the crypto space, with its chart pattern showing clear signs of sustained upward momentum. The asset is currently making new highs, a development that reinforces the bullish sentiment surrounding this particular trading pair.
At the current resistance level, market dynamics are playing out as expected. There’s typically some form of supply that enters the market when prices reach these critical levels, and HYPEUSDT is no exception to this pattern. However, the way the asset is accelerating to the upside suggests strong underlying demand that’s overpowering the selling pressure.
Chart Pattern Analysis Reveals Strategic Opportunities
The technical formation visible on the HYPEUSDT chart shows an apex formation that has been followed by a quick resolution to the upside. This type of pattern often indicates decisive market sentiment and can signal the beginning of more substantial price movements.
Current market action shows some supply entering at these elevated levels, evidenced by the supply tail. This development would make consolidation at the current level a logical next step, potentially creating a “major making up action.”
Consolidation Phase Could Present Secondary Entry Point
The potential consolidation at the current resistance-turned-support level could present a second entry point for traders looking to participate in this campaign. This scenario is particularly attractive for those who may have missed the initial breakout or are looking to add to existing positions with better risk management parameters.
Risk Management and Trading Strategy
From a risk management perspective, maintaining appropriate stop-loss levels is crucial in the current environment. The best strategy in the current market environment appears to be following the established trend rather than trying to anticipate reversals or corrections.
Market Outlook and Implications
HYPEUSDT’s ability to break through long-term resistance and maintain momentum above these levels suggests that the overall crypto cycle may be entering a phase where the asset can achieve sustained outperformance.
The combination of technical strength, volume confirmation, and strategic positioning makes HYPEUSDT a cryptocurrency worth monitoring closely. As the consolidation phase potentially unfolds, traders and investors will be watching for signs of continuation or reversal that could influence broader market positioning and sentiment in the cryptocurrency space.

HYPE can it keep us hyped ?Mastering Zones: Your Quick Trading Guide!
Remember the core logic:
🔵 Blue Zone:
PUMPS FROM BLUE (Look for buys!)
DUMPS IF BREAKS BLUE (Consider sells/exit longs!)
🔴 Red Zone:
DUMPS FROM RED (Look for sells!)
PUMPS IF BREAKS RED (Consider buys/enter longs!)
Apply this to your charts for clear signals. Stay sharp!

Phemex Analysis #87: Pro Tips for Trading Hyperliquid (HYPE)Hyperliquid ( PHEMEX:HYPEUSDT.P ) has rapidly become one of the most talked-about cryptocurrencies over the past two months. Impressively defying broader market uncertainties, HYPE soared from a low of $9.313 on April 7 to a remarkable high of $40.019 on May 26—achieving an astounding growth of approximately 329%.
However, caution is advised, as recent price action has formed a classic "Head-and-Shoulders" pattern, with the third peak emerging around June 3. This technical setup often indicates weakening bullish momentum and potential trend reversal. Given this scenario, let's delve deeper into several possible outcomes that could unfold for HYPE in the upcoming days.
Possible Scenarios
1. Bearish Reversal
The Head-and-Shoulders formation signals a potential bearish reversal. If HYPE breaks below the critical support levels at $31.5, especially with increased trading volume, and subsequently breaches the $30 support, the likelihood of a sharp downward movement intensifies.
Pro Tips:
Short Positions: Consider initiating short positions upon confirmed breakdowns below $31.5 or $30. Always employ tight stop-losses to manage risk effectively.
Long-Term Accumulation: For those with a longer-term bullish outlook on HYPE, watch closely for price stabilization around lower support levels at $25.5 and $24.3, which could offer strategic entry points for buying the dip.
2. Retesting the $30 Support Level
Another plausible scenario is that HYPE might retrace to the $30 support level, characterized by declining trading volume. If volume diminishes significantly at this level, it could indicate that selling pressure is weakening, setting the stage for consolidation rather than further declines.
Pro Tips:
Grid Trading Strategy: Utilize grid trading to systematically capitalize on potential range-bound movement between clear support at $30 and resistance near $38.
Risk Management: Remain disciplined by setting clear stop-losses above the resistance or below support to protect against unexpected breakouts or breakdowns.
3. Breakout Rise (Bullish Scenario)
While considered less likely given current technical patterns, crypto markets often defy expectations. A bullish breakout above the immediate resistance levels at $37.2 and subsequently $39.7—particularly if accompanied by strong positive news or substantial trading volume—could signal another significant upward move.
Pro Tips:
Watch Resistance Levels: Stay alert for decisive breakouts above $37.2 and $39.7, validating the bullish scenario.
Confirmation Required: Only enter long positions if breakouts are confirmed by sustained volume and supportive fundamental news.
Conclusion
Hyperliquid (HYPE) currently stands at a crucial technical juncture, presenting multiple strategic opportunities for traders. Whether anticipating a bearish reversal, a consolidation phase, or a surprise bullish breakout, successful trading will depend on vigilance, technical confirmations, and disciplined risk management. Stay adaptable, carefully monitor key price levels, and remain informed about news and market developments to confidently navigate trading HYPE.
Tips:
Elevate Your Trading Game with Phemex. Experience unparalleled flexibility with features like multiple watchlists, basket orders, and real-time adjustments to strategy orders. Our USDT-based scaled orders give you precise control over your risk, while iceberg orders provide stealthy execution.
Disclaimer: This is NOT financial or investment advice. Please conduct your own research (DYOR). Phemex is not responsible, directly or indirectly, for any damage or loss incurred or claimed to be caused by or in association with the use of or reliance on any content, goods, or services mentioned in this article.

Hype's path to $55BYBIT:HYPEUSDT.P is currently forming a wedge shape pattern, is it indicating that it will break out and follow Path A, the blue path? I'm not so sure, I am sure we'll hit $55 either way.
If we take the red path, Path B, we'll come down to some heaviy support which could give us the fuel needed to get to $55
Out of all of the oscillators I was using, all except the chop zone on the daily mind you, were in bearish mode. So logically one would choose the red Path B right?
I can't wait to see how this plays out, shall we dip some and buy some more BYBIT:HYPEUSDT.P on Path B or experience more of a continuation of the current trendline to $55?
Let me know what you think in the comments, that'ls all for today, let's go HYPE!!! straight to $55!

HYPE’s Triangle Is Tightening! Get Ready for What’s NextYello, Paradisers! Are you watching what #HYPE is doing while the rest of the market barely holds on? We've been talking about this for a while, some altcoins are setting up for their next big move, and HYPE just might be leading the pack.
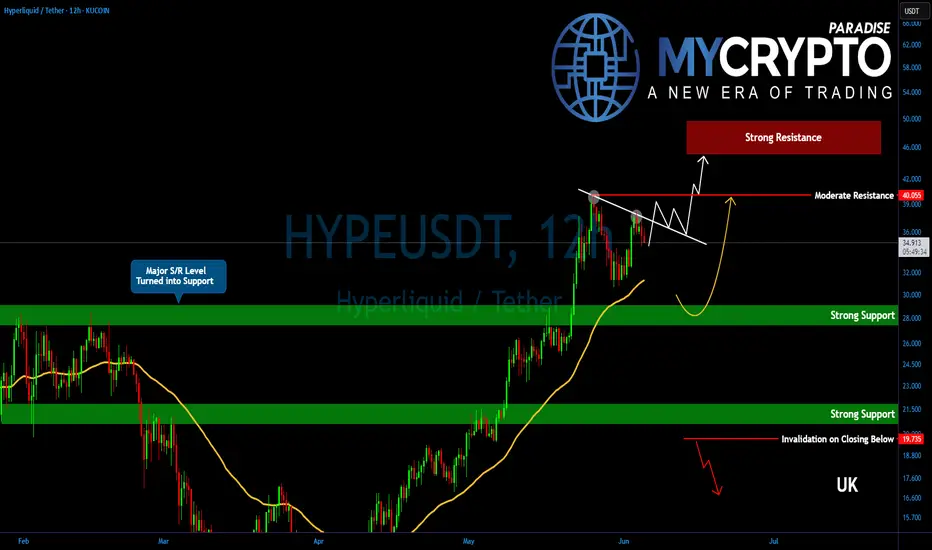
💎While the broader crypto market remains in a corrective or consolidative phase, HYPE has quietly maintained strength, pushing above a critical support/resistance zone and now forming a converging triangle pattern, a classic setup for explosive movement.
💎#HYPEUSDT is in a sideways consolidation phase. Price action is calm on the surface, but what’s actually unfolding is a textbook build-up. The next move could be a retest of the EMA-50, which sits near the 31.480 level. That zone also aligns with a moderate support area, making it a solid demand zone for bulls to reload and re-accumulate.
💎Even if HYPE slides lower into the 30.00 to 28.00 strong support region, it wouldn’t damage the structure. In fact, such a move would shake out late longs and weak hands, further strengthening the overall foundation. A drop into that zone should not be seen as failure, but rather as a potential springboard for the next impulsive wave.
💎The key to watch remains the descending resistance at the 37.20 level. Once this is broken with volume and conviction, the price is likely to push toward 40.05—a moderate resistance. But don’t get it twisted. That’s not where the bulls are aiming to stop. The structure, momentum, and higher-timeframe alignment all suggest this isn’t the final destination. Bulls are likely targeting the $47–$50 range, an area that isn’t just technical, it’s psychological mark as well.
Paradisers, strive for consistency, not quick profits. Treat the market as a businessman, not as a gambler.
MyCryptoParadise
iFeel the success🌴
$HYPE Analysis📈 GETTEX:HYPE Analysis 📈
Looking for a clean sweep of the PDL followed by a tap into the 4H FVG + trendline support zone 🧠📍
That’s the bounce area I’m eyeing👀
Bids placed around the 4H FVG — targeting PMH on the move up 🎯
Let price come to you

Bearish Wedge forming after rally I like distinguishing these bc it holds good weight to step into a trade

$HYPE LOST SUPPORT — No longs hereLost support, no longs here.
Hunting buys at $29.5–28.5 and $27–26 — stacked bullish zones.
Retest of $34–35.5 = short zone.
Below $29 — only watching for flush, no FOMO.
Wait for setup or get chopped.

hype short bac kt o$29.9Just now opened a short trade on hype. Targeting $29.9
Roughly 3RR
stop: $32.755 or higher
Market likely to retest $30 area before any major bullish reaction

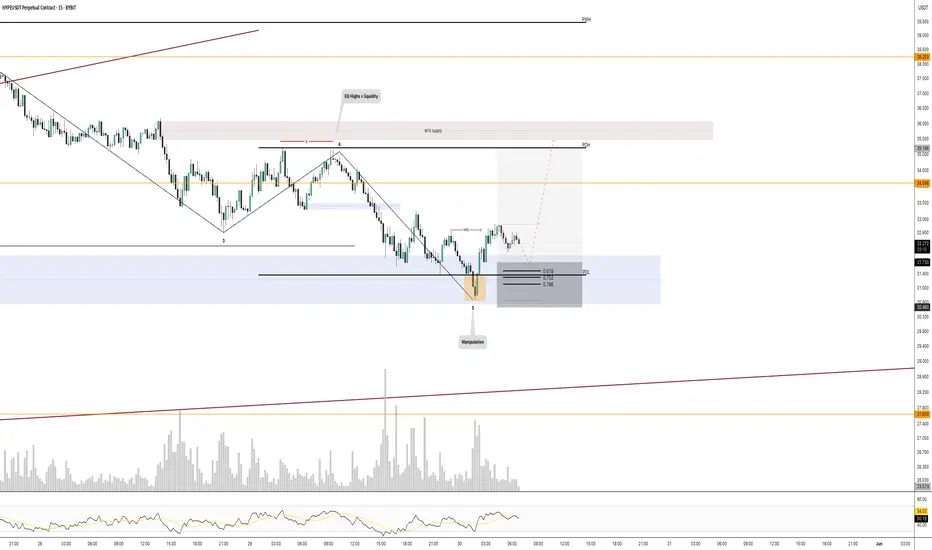
HYPE inside Previous Day RangeYesterday, the market consolidated towards the end of the trading session, followed by a sweep of the previous day's lows. We are now anticipating a pullback to retest the prior day's range, with an expectation of an upward move to sweep the equal highs formed just above, where a strong supply level exists.
HYPE downtrend continuationHYPE is currently set to target lower price levels on a higher timeframe (HTF), seeking out a demand zones where strong buying interest is expected.
On the 5-minute (M5) chart liquidity is building up, with Equal Highs forming. On the 15-minute (M15) chart, a supply zone is acting as resistance, likely pushing prices lower.
The likely outcome is that the price will move up to sweep liquidity on the M5, and then starts its move down triggering a Market Structure Shift (MSS). This shift would confirm the start of a broader downward move toward the HTF demand zone, where buyers may step in to support the price.

HYPE going to take Previous Day High Hype shifted bullish with a inverted Head and Shoulders pattern after sweeping Monday Low.
Is now retesting the support to try and take Mondays High.

$HYPE peak for now but new highs coming soon3ple resistance with LT & ST trend and 1.618 Fib.
Looking for support on lower LT & ST trendline

HYPEUSDT relevant support zonesDo not have much to say about it.
This is trending very well.
Supports are marked on the chart. As it lands on a support, it provides a long trade opportunity.
The lower the support zone on the chart, the price hits, stronger bounce and higher probability for a long trade it presents.
I will load heavy on spot if it hits any of the weekly support, specially WS2 in future.
