#NATURALGAS 1st August ViewCAPITALCOM:NATURALGAS Currently looks doing a five swing structure from Feb low and any sell off should remain supported at this levels for atleast one more push higher.
GNMG2026 trade ideas

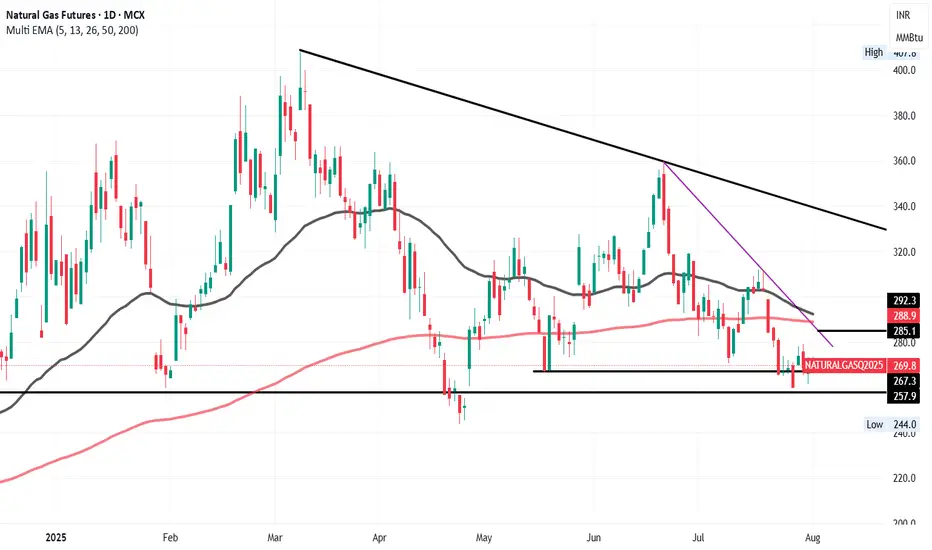
Natural Gas – Bullish Rebound Expected Towards 285–288Natural Gas is currently showing signs of a short-term bounce after testing key support around the 267–258 zone. My view remains bullish in the short term with potential upside toward 285–288, which aligns with the downward purple trendline and both the 50 EMA (around 292.3) and 200 EMA (around 288.9). This confluence zone is expected to act as strong resistance.
Once the price reaches that level, I’ll look for bearish confirmation to re-enter short positions, in line with the broader downtrend marked by the falling black trendline.
📌 Levels to watch:
Support: 267 / 258
Resistance: 285–288 (EMA + trendline)
NatGas short term long opportunity Natgas MCX future may go upside target of 300+ from Cmp - 265 , SL - 259. If Buyer Accumulate and sustain level of 265 . Time horizon - 4-6 weeks

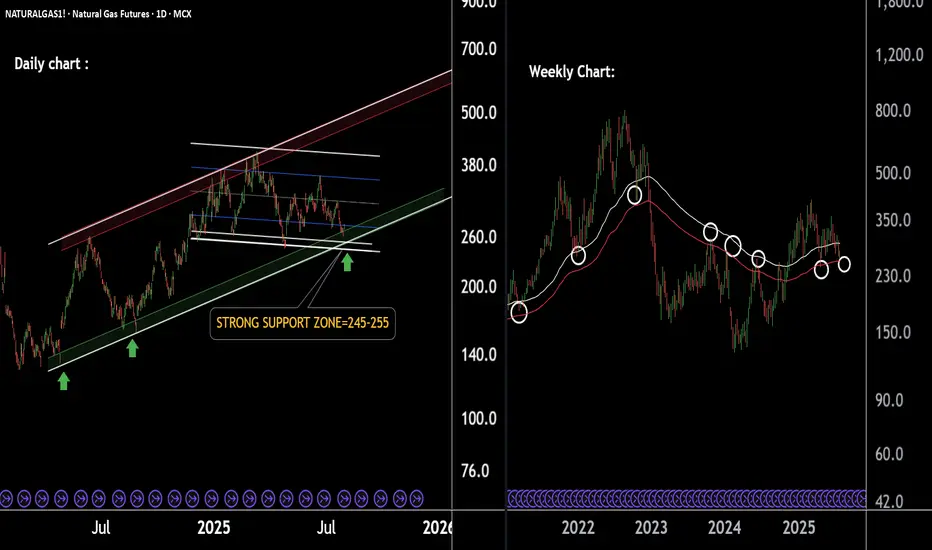
Natural Gas Cooling Near Support Zone – Bounce Ahead!Natural Gas Technical Overview (2-Chart Analysis):
Chart 1 – Parallel Channel Formation:
Natural Gas is moving within a well-defined parallel channel.
The lower support boundary of this channel is observed near 250, indicating a potential bounce zone.
Chart 2 – EMA-Based Support Structure:
Price is currently sustaining above key EMAs, reflecting short-term strength.
The last EMA support lies around 252, acting as an additional support confluence.
If this level is sustain then we may see higher prices in Natural gas futures.
Thank you !!
Gold | Oil | Dollar | Silver | Natural Gas Price ForecastGold | Oil | Dollar | Silver | Natural Gas Price Forecast
COMEX:GC1! COMEX:SI1! AMEX:UNG PEPPERSTONE:NATGAS

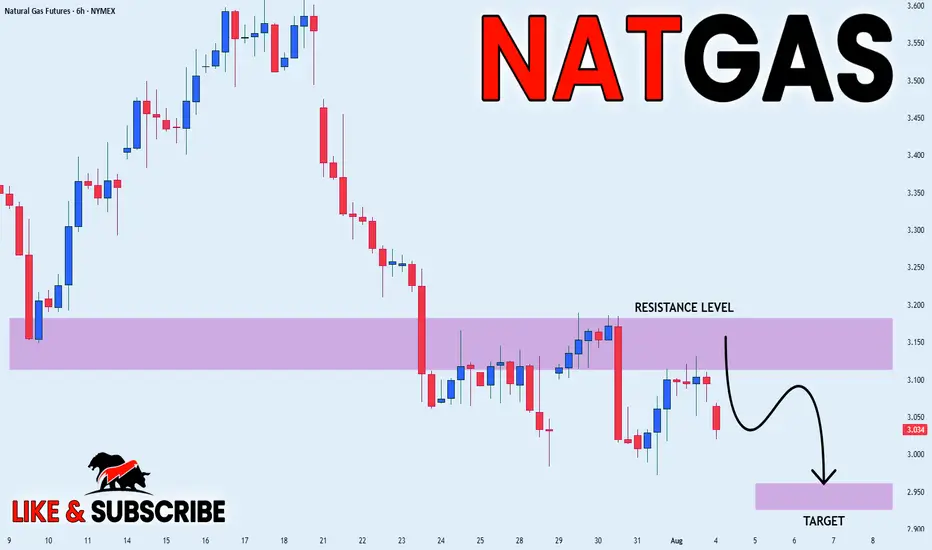
NATGAS Support Ahead! Buy!
Hello,Traders!
NATGAS keeps falling but
A strong horizontal support
Level is ahead at 3.00$ so
After Gas retests the support
We will be expecting a local
Bullish rebound
Buy!
Comment and subscribe to help us grow!
Check out other forecasts below too!
Disclosure: I am part of Trade Nation's Influencer program and receive a monthly fee for using their TradingView charts in my analysis.

NATGAS WILL FALL|SHORT|
✅NATGAS has retested a key resistance level of
And as the pair is already making a bearish pullback
A move down to retest the demand level below at 1.3434 is likely
SHORT🔥
✅Like and subscribe to never miss a new idea!✅
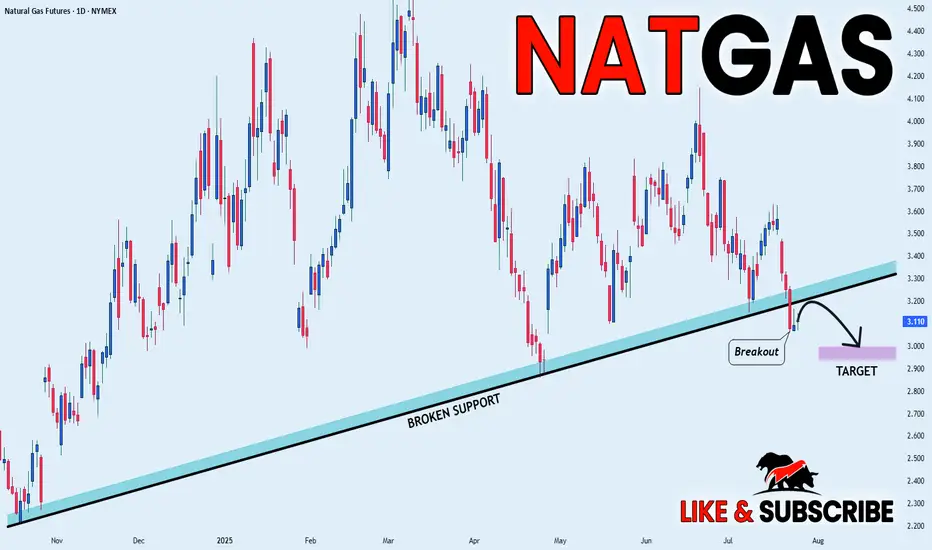
NATGAS BEARISH BREAKOUT|SHORT|
✅NATGAS broke the rising support
While trading in an local downtrend
Which makes me bearish
And I think that after the retest of the broken line is complete
A rebound and bearish continuation will follow
SHORT🔥
✅Like and subscribe to never miss a new idea!✅
Disclosure: I am part of Trade Nation's Influencer program and receive a monthly fee for using their TradingView charts in my analysis.
NG : Long-term longFrom this level we can look for longs. But one should not expect a pullback from it during significant news.
But in normal time it will work.

NATGAS Free Signal! Buy!
Hello,Traders!
NATGAS went down and
Almost reached the horizontal
Support of 3.014$ from where
We can enter a long trade
With the Take Profit of 3.066$
And the Stop Loss of 2.981$
Buy!
Comment and subscribe to help us grow!
Check out other forecasts below too!
Disclosure: I am part of Trade Nation's Influencer program and receive a monthly fee for using their TradingView charts in my analysis.

3$ psychological level natural gas bounceGood long opportunity for natural gas at the 3$ level.
Argument1: Weekly candle held the 3 $ psychological level
Argument2: Gap fill on Ng1! natural gas futures
Argument3: Triple bottom on XNGUSD natural gas

NG1! BEST PLACE TO BUY FROM|LONG
NG1! SIGNAL
Trade Direction: long
Entry Level: 3.111
Target Level: 3.357
Stop Loss: 2.946
RISK PROFILE
Risk level: medium
Suggested risk: 1%
Timeframe: 1D
Disclosure: I am part of Trade Nation's Influencer program and receive a monthly fee for using their TradingView charts in my analysis.
✅LIKE AND COMMENT MY IDEAS✅

Natural Gas | Oil | Dollar | Silver | Gold Price Forecast.Natural Gas | Oil | Dollar | Silver | Gold Price Forecast.
NYMEX:NG1! AMEX:UNG NYMEX:CL1! COMEX:GC1!

NG1!: Target Is Up! Long!
My dear friends,
Today we will analyse NG1! together☺️
The price is near a wide key level
and the pair is approaching a significant decision level of 3.087 Therefore, a strong bullish reaction here could determine the next move up.We will watch for a confirmation candle, and then target the next key level of 3.107.Recommend Stop-loss is beyond the current level.
❤️Sending you lots of Love and Hugs❤️

NG1! Bearish Break to $3.00-$2.82 by Tuesday?www.tradingview.com NYMEX:NG1! Update - Bears Pushing, Turnaround Looms Short-Term Odds: ~60% pullback to $3.00-$2.99, ~40% chance to $2.82 - Key Signal: Low volume on 1000-tick chart, holding below VWAP ($3.134). Third test at $3.10 done—$3.00 next if support breaks. - Trend Hint: Bearish with high storage (3,075 Bcf). August heat (Dallas 104°F) looms but not flipping yet. Expect a potential dump Monday (July 28), turnaround Tuesday (July 29). lets see how it plays out - Enjoying these updates?
Good hunting! #NaturalGas #Trading #NG1
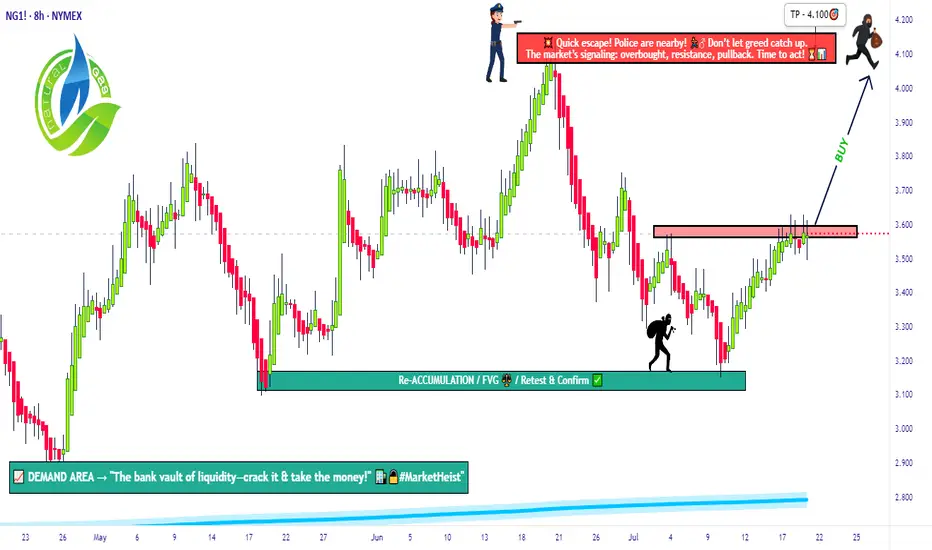
The Great Gas Heist: Load Your Longs Before It Blows💎🚨“Operation Gas Vault: NG1! Breakout Robbery Blueprint”🚨💎
🌟Hi! Hola! Ola! Bonjour! Hallo! Marhaba!🌟
Welcome to all my Market Hustlers & Silent Robbers 🕵️♂️💼💰
Today’s target: NG1! Henry Hub Natural Gas Futures
📍Strategy: A bullish heist mission with a calculated escape plan.
🔥Thief Trading Blueprint: Gas Market Heist🔥
🎯 Entry Gameplan
“The vault cracks open at 3.630 – That’s your cue.”
Wait for resistance breakout 🧱 (around 3.630) – that’s the signal.
Set Buy Stop orders above the Moving Average.
Or, use a layered DCA entry via Limit Orders near swing highs/lows (15m or 30m timeframe).
Thief Tip: Set an alert/alarm so you don’t miss the breakout bang 🔔💥
🛡 Stop Loss Setup (Post-Breakout Only!)
“Don’t be reckless. No SL before breakout — wait for confirmation.”
SL Location: Swing low (4H) near 3.370.
Set SL after breakout happens, not before.
Adjust based on your risk tolerance, lot size & number of open entries.
⚠️ Placing early SL = triggering the trap before the door opens.
🏴☠️ Loot Target 🎯
Take Profit Zone: 4.100
Escape Tip: No need to be greedy. Take profit before the police arrive (resistance)!
🧲 Scalper’s Shortcut
Only go Long – avoid fighting the current.
If you’ve got cash flow, strike early. If not, ride with the swing crew.
Use trailing SL to protect your stack 💼📉
📊 Fundamental Clues Behind the Heist
The gas vault is heating up thanks to:
🔥COT Reports
🛢 Inventory & Storage data
📈 Seasonal trends
💹 Sentiment flows
⚖ Intermarket linkages
Checkk your own global indicators 🌍🔗 – don’t enter blindfolded.
🗞️ News Traps & Position Protection
Avoid new entries during major news releases 📰🚫
Trail stops to guard running positions
Markets react fast. Adapt even faster.
⚠️ Disclaimer: This is educational info, not personal investment advice. Your money, your risk, your decisions.
💥 Support the Robbery Squad 💥
If you vibe with the Thief Trading Style, smash that Boost Button 💖
Grow the gang, expand the vaults, and master this money maze together! 🤑🏆🚀
Stay tuned – another heist plan is on the way.
Until then, trade smart, trade sharp. 👊🕶💼
🔒#NaturalGas #ThiefTrading #BreakoutStrategy #SwingTrade #FuturesHeist #NG1Plan #RobTheMarket
Natural Gas Futures Signal Breakdown Below Mid-Band Support
The most recent candle closed below the middle Bollinger Band (20 SMA), indicating potential downside momentum.
The price recently spiked toward the upper band (~$4.20) but was strongly rejected, creating a bearish reversal pattern.
Volume has been increasing on down days, especially the last few sessions, suggesting institutional selling pressure.

Natural Gas Slips Below Support – More Downside Ahead ?
Recent candles are large-bodied bearish candles, indicating strong selling pressure.
Bollinger Basis is sloping downward, showing short-term bearish momentum.
Price is currently below both the 20-day and 50-day moving averages, reinforcing the bearish outlook.

NATGAS Risky Long! Buy!
Hello,Traders!
NATGAS keeps falling down
In a strong downtrend
And Gas is locally oversold
So after the price hits the
Horizontal support of 2.860$
We will be expecting a
Local bullish correction
Buy!
Comment and subscribe to help us grow!
Check out other forecasts below too!
Disclosure: I am part of Trade Nation's Influencer program and receive a monthly fee for using their TradingView charts in my analysis.

U.S. Natural Gas Poised for Rebound After Steep July DropU.S. natural gas prices sank in July due to mild weather, strong supply, and LNG export disruptions. The EIA cut its price outlook but expects a recovery by winter.
While technicals hint at a short-term rebound, oversupply and weak summer demand keep pressure on prices. A sustained recovery depends on tighter balances and rising LNG flows.
MILD WEATHER AND STRONG SUPPLY DRAGGED U.S. NAT-GAS PRICES
CME Henry Hub Natural Gas Futures fell 10.1% in July, marking the steepest monthly decline since April (-19.3%). For the week ending 25/Jul, prices dropped 12.8%, marking the sharpest weekly fall since the week ending 31/Jan (-24.4%).
The selloff was fuelled by milder-than-expected summer weather, robust production, reduced LNG exports, and strong storage builds. July typically sees lower U.S. gas demand compared to the winter months, and in 2025, cooler conditions curbed electricity use for air conditioning, softening demand for gas-fired power generation.
Meanwhile, U.S. natural gas output remained robust through H1 2025, with supply growth outpacing consumption.
With production still high and power sector demand underwhelming, the EIA expects prices to remain under pressure until the winter withdrawal season (November to March).
LNG EXPORT DISRUPTIONS DEEPEN PRESSURE ON U.S. GAS PRICES AMID STRONG SUPPLY
U.S. LNG export flows declined in July 2025, primarily due to maintenance and operational delays at major terminals. These disruptions significantly reduced gas deliveries to export facilities, limiting outbound volumes despite the U.S. maintaining ample export capacity.
At the same time, domestic natural gas supply continued to rise. According to S&P Global , for the week ending 30/Jul, total supply increased by 0.2% week-over-week. While modest, this supply growth added to an already well-supplied market.
The reduced export activity amplified the bearish impact of weak summer demand, contributing to the sharp price decline seen in July.
RISING U.S. GAS INVENTORIES ADD PRESSURE AS PRODUCTION OUTPACES DEMAND
Another drag on prices has been the steady build-up in U.S. natural gas inventories in recent weeks, driven largely by increased domestic production.
Source: EIA
As of the week ending 25/Jul, U.S. natural gas inventories are 6.7% above the five-year average (2020–2024) despite ending the previous withdrawal season 4% below the five-year average, the lowest in three years.
Source: EIA
Injections have exceeded the five-year average as U.S. natural gas production has increased in Q2 2025 compared with Q1 2025.
The EIA expects inventories to end the injection season on 31/Oct with 3,910 Bcf of natural gas in storage, 5% more than the forecast it made previously and 3% more than the five-year average.
EIA LOWERS GAS OUTLOOK BUT STILL EXPECTS A REBOUND IN PRICES
The EIA has revised its natural gas price outlook downward in its latest Short-Term Energy Outlook (STEO), citing stronger-than-expected storage builds. The agency now forecasts Henry Hub prices to average USD 3.67/MMBtu in 2024 (down 8.7%) and USD 4.41/MMBtu in 2025 (down 9.6%) compared to the previous month’s estimates.
Source: EIA STEO
Despite the lower near-term outlook, the EIA still sees prices gradually rising from Q3 2025 through Q1 2026. As maintenance at major LNG export facilities concludes, export volumes are expected to recover, helping to absorb excess supply.
Additionally, structural demand from Europe remains strong. The EU has committed to purchasing USD 750 billion worth of energy—including LNG, crude oil, and nuclear fuels- from the U.S. over the next three years.
BEARISH PRESSURE PERSISTS, BUT TECHNICAL INDICATORS HINT AT REBOUND
Henry Hub has traded below its 9-day and 21-day moving averages since 21/Jul, signalling sustained bearish pressure.
On 01/Aug, it showed signs of breaking above the 9-day average, hinting at a potential shift.
RSI and MACD indicators are suggesting fading bearish momentum for Henry Hub, pointing to a potential short-term price rebound.
HYPOTHETICAL TRADE SETUP
Henry Hub prices saw a steep monthly drop in July, weighed down by multiple factors mentioned above. However, several signs point to a potential rebound.
Despite the recent slide, technical indicators like RSI and MACD suggest fading bearish momentum.
With bearish drivers priced in and both technical and fundamental signals hinting at stabilization or a short-term bounce, traders may consider going long CME Micro Henry Hub Natural Gas Futures.
These contracts, sized at 1/10th of the standard futures, offer efficient capital deployment and precise risk control, making them ideal for expressing directional views or scaling into a larger position as confirmation builds.
This paper posits a long position in CME Micro Henry Hub Natural Gas Futures (Sep 2025) expiring on 26/Aug (MNGU2025) with the following trade setup:
• Entry: 3.10/MMBtu
• Target: 3.46/barrel
• Stop: 2.86/barrel
• P&L at Target (per lot): +360 ((3.46 – 3.10) x 1,000)
• P&L at Stop (per lot): -240 ((3.10– 2.86) x 1,000)
• Reward-to-Risk Ratio: 1.5x
The same view can be expressed using standard CME Natural Gas futures, which offer 10x larger notional sizes and deep liquidity.
MARKET DATA
CME Real-time Market Data helps identify trading set-ups and express market views better. If you have futures in your trading portfolio, you can check out on CME Group data plans available that suit your trading needs tradingview.com/cme .
DISCLAIMER
This case study is for educational purposes only and does not constitute investment recommendations or advice. Nor are they used to promote any specific products, or services.
Trading or investment ideas cited here are for illustration only, as an integral part of a case study to demonstrate the fundamental concepts in risk management or trading under the market scenarios being discussed. Please read the FULL DISCLAIMER the link to which is provided in our profile description.

NG1! BULLISH BIAS RIGHT NOW| LONG
NG1! SIGNAL
Trade Direction: long
Entry Level: 3.086
Target Level: 3.599
Stop Loss: 2.744
RISK PROFILE
Risk level: medium
Suggested risk: 1%
Timeframe: 1D
Disclosure: I am part of Trade Nation's Influencer program and receive a monthly fee for using their TradingView charts in my analysis.
✅LIKE AND COMMENT MY IDEAS✅

NATGAS Trading Opportunity! SELL!
My dear followers,
This is my opinion on the NATGAS next move:
The asset is approaching an important pivot point 3.567
Bias - Bearish
Technical Indicators: Supper Trend generates a clear short signal while Pivot Point HL is currently determining the overall Bearish trend of the market.
Goal - 3.480
About Used Indicators:
For more efficient signals, super-trend is used in combination with other indicators like Pivot Points.
Disclosure: I am part of Trade Nation's Influencer program and receive a monthly fee for using their TradingView charts in my analysis.
———————————
WISH YOU ALL LUCK
NG1! BEARS ARE GAINING STRENGTH|SHORT
NG1! SIGNAL
Trade Direction: short
Entry Level: 3.737
Target Level: 3.205
Stop Loss: 4.089
RISK PROFILE
Risk level: medium
Suggested risk: 1%
Timeframe: 1D
Disclosure: I am part of Trade Nation's Influencer program and receive a monthly fee for using their TradingView charts in my analysis.
✅LIKE AND COMMENT MY IDEAS✅
