NATGAS My Opinion! SELL!
My dear friends,
NATGAS looks like it will make a good move, and here are the details:
The market is trading on 2.150 pivot level.
Bias - Bearish
Technical Indicators: Supper Trend generates a clear short signal while Pivot Point HL is currently determining the overall Bearish trend of the market.
Goal - 1.994
Recommended Stop Loss - 2.252
About Used Indicators:
Pivot points are a great way to identify areas of support and resistance, but they work best when combined with other kinds of technical analysis
———————————
WISH YOU ALL LUCK
GNM1! trade ideas

Are there signs of a recovery in gas prices?If you would like to be notified whenever I post a new article, just click "FOLLOW" at the top. Also, if you would like to elaborate on a particular topic or need some advice, please comment below the article and I will be happy to help.
Are there signs of a recovery in gas prices?
Natural Gas Futures - Jun 2024 U.S. reached a one-week high at $2.06/MMBtu in anticipation of increased demand. This is due to an increase in the amount of gas used at the Freeport LNG export facility in Texas.
On Monday, the amount of gas used reached its highest value in three weeks, 12.9 bcfd compared to 12.2 bcfd the previous day. This suggests that at least one of the three liquefaction trains is back in operation after a period of interruption.
The natural gas injection season has just begun.
The annual gas storage process is divided into two distinct phases: gas injection into the reservoir, which takes place during the spring and summer (April 1 to October 31), followed by delivery during the fall and winter (November 1 to March 31 of the following year).
Gas producers have recently turned off the taps on major extraction fields, leading to a decrease in production. This could have a significant impact on the future of the gas industry and energy markets in general.
To achieve a sustainable recovery in gas prices, there needs to be a gas deficit. This means that demand exceeds supply and there is a shortage of gas in the market. Only under these circumstances will we be able to see an increase in gas prices in the long term.
At the moment, a deficit storage situation is unlikely to occur by November. However, as is often the case in the natural gas market, prices and weather conditions will have a significant impact on storage demand.
With the upcoming summer likely to be warmer than usual, we expect demand for electricity to increase.
This year has been difficult for the gas industry, but there are hopes for a return to normalcy by the end of the year. If producers continue on the path of reducing production, we are likely to fall back into a balanced storage scenario.
Our investors who have used TRADING VIEW this year have been able to avoid losses in the natural gas market, which has done minus 60 percent in six months.
How? By simply following the strategy of buying the best gas producers instead of investing directly in futures. Using TRADING VIEW's summary of technical indicators provided us with invaluable help.
The data provided by TRADINGVIEW suggest that ANTERO and other gas distributors have a more favorable position from a technical analysis perspective.
As a result, it would have been better to avoid natural gas futures, as technical indicators pointed to a negative situation.
One of the reasons why many people buy natural gas is seasonality. But as I often repeat, there are no magic formulas, and understanding or exploiting seasonality is useless and only leads to wasted time and money if you do not have a solid understanding of fundamental analysis.
We look forward to seeing you in the next article! And remember, for successful trading always rely on TRADINGVIEW: an indispensable tool that can help you avoid serious mistakes during your trades.
Don't put an essential purchase like this on hold.

Natural Gas Price Forecast | Oil, Silver, Gold00:00 Natural Gas futures stock NatGas Support & Resistance Guide
04:04 AMEX:UNG Stock Forecast
04:42 Oil Price Forecast
05:50 DXY US dollar Stock Forecast
06:50 Gold XAUUSD Stock Forecast
08:36 Silver XAGUSD
Natural Gas Price Forecast | Oil, Silver, Gold

natural gas long on COT datanew high on weekly monthly daily chart with COT commercial Index bullish

How to trade the NEW CME Micro "Henry Hub Natural Gas"In this video we will demonstrate how to trade the NEW CME Micro "Henry Hub Natural Gas" symbol with TradingView with AMP Futures.

Bullish reversal on the way, big upside likely to come■ Natural Gas has break out of the 2 month range with a strong gap above 1.945 resistance turned support.
■ While prices are still trending below the kumo/cloud, the bullish twist of the kumo is indicative of a strong bullish sign. .
■ Momentum indicators are showing strong signs of bullish sentiment and hence, there is a strong possibility of natural gas targeting 2.322 in the near-term. Long-term target is at 3.600

NATGAS Bullish Breakout! Buy!
Hello,Traders!
NATGAS made a gap up
Then hit a horizontal level
Of 1.989 then made a breakout
And the breakout is confirmed
So we are bullish biased
And we will be expecting
A further move up
Buy!
Like, comment and subscribe to help us grow!
Check out other forecasts below too!

$NG1 $NATGAS #NaturalGas$NG1 PEPPERSTONE:NATGAS #NaturalGas is now testing a 33 years old wedge for a bit more than 12 times. Any close below 1.50 causes a free fall, however, there is a descending lower channel wedge extending since 2009 around 1$.

Natural Gas MCX May Future Technical Analysis 29 April, 2024 These levels offer guidance for traders interested in trading NG MCX Futures in May, providing specific entry points, target prices, and stop-loss levels to manage risk.
Range Point: 160.50
Weekly Range: 7.00 points
Buy Above: 164.53
Average At: 163.70
Buy Target 1: 164.83
Buy Target 2: 167.50
Buyer Stoploss: 162.20
Sale Below: 162.87
Sale Target 1: 156.17
Sale Target 2: 165.20
Seller Stoploss: 165.20

Natural Gas Oil, Silver, DXY, Gold Price ForecastSilver, Natural Gas DXY, Gold Oil Price Forecast
00:00 Natural Gas stock Bulls NatGas Support & Resistance Guide
04:36 AMEX:UNG Stock Forecast
09:16 USO Oil Stock Forecast
12:18 DXY US dollar Stock Forecast
14:04 Gold XAUUSD Stock Forecast
15:44 Silver XAGUSD

✅NATGAS SHORT FROM RESISTANCE🔥
✅NATGAS made a massive
Gap up from the support
But after the gap the price
Immediately hit a horizontal
Resistance level of 2.00$
From where we are already
Seeing a bearish reaction
And I think that we will see
A further move down next week
SHORT🔥
✅Like and subscribe to never miss a new idea!✅

🔥"Natural gas will increase sharply!"Natural gas retreats to support after inventory report release yesterday, April 25th
Natural gas prices pulled back to support after the release of the natural gas inventory report yesterday, April 25th. The report showed a higher-than-expected increase in natural gas inventories. According to the data, natural gas in storage rose by 92 billion cubic feet, exceeding analysts' forecasts of 5 billion cubic feet and 42 billion cubic feet higher than the same period last week.
Natural gas prices attempted to break through support but failed. This was evidenced by the selling pressure that repeatedly pushed back prices as they tried to break through the support level.
We recommend buying natural gas at the current price (MKT) and placing a stop-loss order below the price-rejecting Pin Bar candle.
BUY MKT NGEM24
STP: 1.925
TP: 2.181

Natural Gas Price Forecast | DXY Oil, Silver, GoldNatural Gas | Oil, Silver, DXY Gold Price Forecast

natural gas levels (may future)buy @ 168.40
target @ 172.70
stop loss @ 164.10
sell @ 164.10
target @ 159.80
stop loss @ 168.40

Natural Gas Price Forecast | Oil, Silver, GoldTechnical analysis on Natural Gas Price Forecast | Oil, Silver, Gold
Support and resistance guide

Natural Gas Price Forecast | DXY Oil, Silver, Gold
00:00 Natural Gas stock Bulls NatGas Support & Resistance Guide
05:33 AMEX:UNG Stock Forecast
07:00 USO Oil Stock Forecast
09:30 DXY US dollar Stock Forecast
10:42 Gold XAUUSD Stock Forecast
13:29 Silver XAGUSD
Natural Gas Price Forecast | DXY Oil, Silver, Gold

How long will the NATURAL GAS will be consolidationHey Guys.. Find the levels of natural gas commodities for trading with levels shown

Natural Gas Price Forecast | Oil, US Dollar, Silver, Gold AnalysNatural Gas Price Forecast | Oil, US Dollar, Silver, Gold Analysis

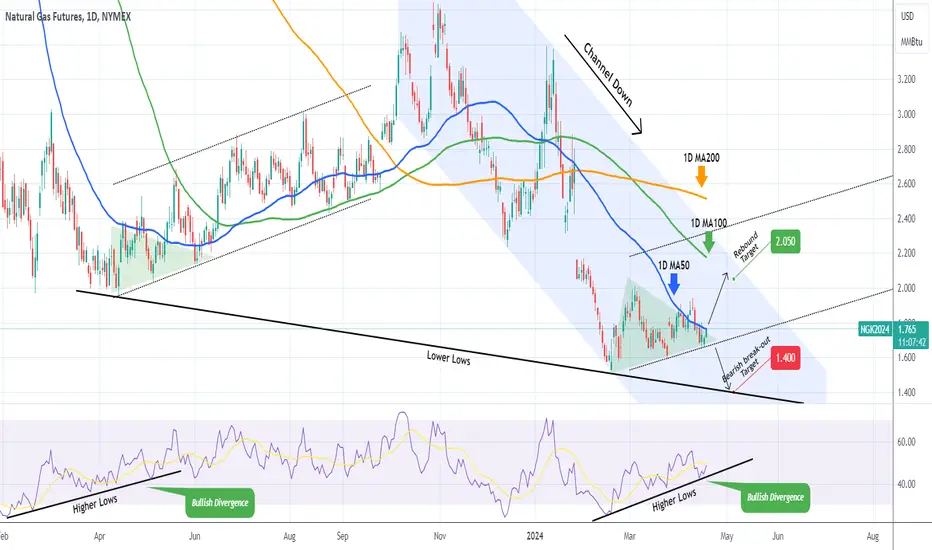
NATURAL GAS Can turn bullish on the short-term.Natural Gas (NG1!) has been posting Higher Lows, three so far since the February 20 Low, despite the fact that it remains within a Channel Down since the October 27 2023 High. This might be a short-term trend change similar to the Channel Up that started on the April 14 2023 Low following a sharp and long-term selling sequence. Notice also the Higher Lows Bullish Divergence on the 1D RSI patterns.
As long as the bottom of the (dotted) Channel Up holds, we will be bullish short-term, targeting the 1D MA100 (green trend-line) at 2.050. If the bottom of the Channel Down breaks, we will turn bearish, targeting the Lower Lows trend-line at 1.400. The risk is low on both sides.
-------------------------------------------------------------------------------
** Please LIKE 👍, FOLLOW ✅, SHARE 🙌 and COMMENT ✍ if you enjoy this idea! Also share your ideas and charts in the comments section below! This is best way to keep it relevant, support us, keep the content here free and allow the idea to reach as many people as possible. **
-------------------------------------------------------------------------------
💸💸💸💸💸💸
👇 👇 👇 👇 👇 👇
Natural Gas to $2.55On a seasonal basis over the last 30 years the price of Natural Gas begins to rise now into August. This year's price is tracking very closely to the historical price. I think we're about to rise at least to $2.55.
NYMEX:NG1!

Natural gas Clearly 160 seems to be a strong resistance however the bottom rising structure also showing strength. Slowly making higher lows marked by red circles. In my view traders should watch gaps pending on both sides and try to enter as low as possible. In a midium term view as soon as this triangular structure gets broken on higher side upside gap will be filled.
This analysis is just for educational purpose.

What Next in $MCX:NATURALGAS1!Dear Traders,
As Per Technical Analysis MCX:NATURALGAS1! Will try to take Support Near 143-144 Level if breaks then we can see Further Downmove. but as trader we can use this as a Opportunity buy Naturalgas Near 147-148, with SL of 143, Target 155,159.
This message is for informational purposes only and should not be considered financial advice. It is crucial to conduct thorough research or consult with a financial advisor before making any investment decisions. We do not guarantee the accuracy or completeness of the information provided.

NATGAS Swing Long Trade! Buy!
Hello,Traders!
NATGAS has retested a massive
Horizontal support level of 1.450$
And already made a rebound
So we will be expecting a
Further move up
Buy!
Like, comment and subscribe to help us grow!
Check out other forecasts below too!
