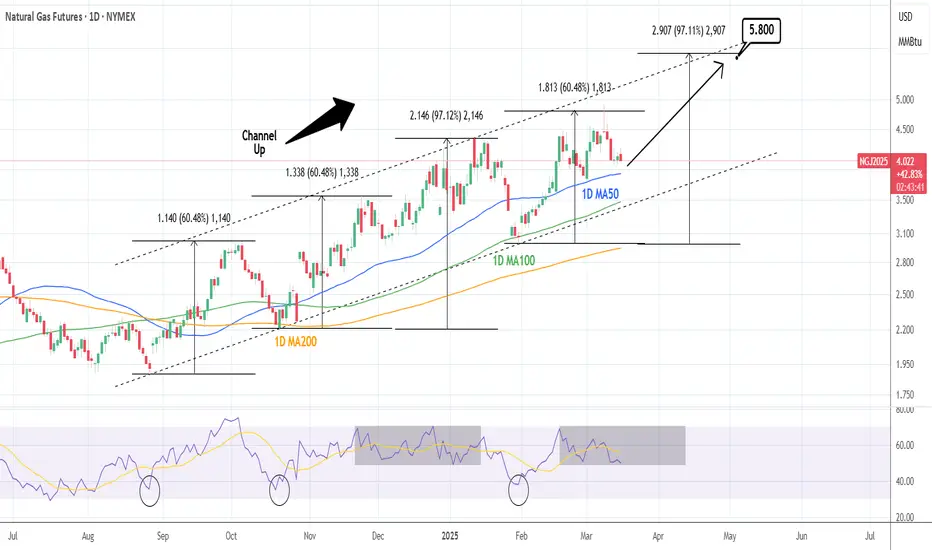
NATURAL GAS: One more technical push.Natural Gas is neutral on its 1D technical outlook (RSI = 49.489, MACD = 0.098, ADX = 23.222), which is the ideal buy opportunity inside its 8 month Channel Up, as long as the 1D MA100 holds. The last HH peaked at +97.12% before pulling back to the 1D MA100. The trade is long, TP = 5.800.
See how our prior idea has worked out:
## If you like our free content follow our profile to get more daily ideas. ##
## Comments and likes are greatly appreciated. ##
GNM1! trade ideas
Natural Gas | Oil | Dollar | Silver | Gold Price ForecastPrice Action, Pattern, and Trend Forecast |
Natural Gas | Oil | US Dollar | Silver | Gold Price Forecast

Natural Gass Short IdeaNatural Gass is likely to continue its sell of based on fundamental conditions but it can pull back so short only after the breakout of previous LL

NATGAS Trading Opportunity! BUY!
My dear friends,
Please, find my technical outlook for NATGAS below:
The price is coiling around a solid key level - 4.089
Bias - Bullish
Technical Indicators: Pivot Points High anticipates a potential price reversal.
Super trend shows a clear buy, giving a perfect indicators' convergence.
Goal - 4.280
Safe Stop Loss - 3.977
About Used Indicators:
The pivot point itself is simply the average of the high, low and closing prices from the previous trading day.
———————————
WISH YOU ALL LUCK

Nag Gas Midweek Recap: 3/13/25
$5.00 looked so close , but now so far! As predicted the market came to its senses and reverted back to some fundamental pricing this week. Although one tweet from Trump and who knows? I better finish this post and get it posted before he strikes again, or I might be at the drawing board before you know it. For the first time in several months, NG prices were not matching weather trends. However, that changed over the past few days as prices plunged as weather trends and the models printed warmer. NG prices finally reacted sharply lower on fundamental news and lack of Trump-o-nomics. The run up in prices has aided in resetting of fundamental levels of pricing. The upper price for the 2025 NG season has been reset close to the 5000 level, more importantly, the long term double top formation in the 4700-4730 range that has been in place since early in September 2022 held and continues to serve as important resistance for the prompt month. One potential technical implication from the quick price surge late Sunday is it has effectively shifted Fibonacci Retracement levels higher. Key 38.2% retracement now exists at 3984, up from 3875, effectively making $4.00 a bit of a stronger support level. So too does the middle of the current 20 day-Bollinger Band currently sitting at 4128. Yesterday was the first fall below the middle band (20D SMA) since February 7th and there has not been an open and close day below it since January 31st.
As for lower technical levels I am watching, the channel trend at 3908, the swing low at 3742, the 50% retracement level at 3702, and the 50D SMA at 3644. Again, I believe we are in an overall bullish pattern. But I will be looking for these support levels for the turn around in price and the beginning of a move higher. I have been discussing my thoughts for the reasons for the move higher for a bit now. But I suggest caution with the Trump uncertainty in the news. The next round of tariffs come into play the first week of April, and with Ukraine and Russia hammering out a peace deal, I am keeping my investing window close. I am only looking week to week for the time being and suggest you do also. We learned this past weekend that fundamentals will be Trumped by Trump every time. For the remainder of the week, I am playing this market to the short side. I did exit my puts last night when the price dropped below 4000. I waited until the report and entered another block of puts. On a purely, short term fundamental basis, I do not see any reason for the market to react and pressure prices higher. I will not plan on holding any large positions over the weekend, due to the geopolitical and tariff uncertainty. But I will take a small strangle, which I will post before the end of the day tomorrow.
I do see some encouraging signs of the coming colder shift in the pattern. Europe is now forecasting colder weather for the next 10 days. A good telegraph for North America. The SSW is finally beginning to show its signs and I believe by early next week the weather models will begin to see it also. The major long-range teleconnections, the AO/NAO/EPO, are modeling colder day 10-40. It is now just a matter of wait and see. The good thing about the recent run up in price is that we are not going to need bitter cold to start the price to rise. We are just going to need below average temps to keep the shoulder season as short as possible. This will keep the price in a bid mode to refill storage. The other factor about past SSW events in the month of March, is that the tend to have very warm Mays, which will put a jump on the US cooling season.
LNG exports continue to show historic production. This week, in Houston, TX, CERA Energy Week conference was held. Industry majors continue to reinforce the bullish nature of the LNG, data center buildouts, and increase in power generation in the US. The main take away from the conference is the one thing that Trump is doing for the NG industry, is cutting red tape. More that 20 BCF of LNG export capacity was approved by the FERC this week, with expedited permitting. The once dead Continental Pipeline is in talks to restart permitting, and most of the steel needed for the construction of said projects have been pre bid, with pre tariff pricing already in place. The demand is there, and the gas is in the ground. There is other bullish issue such and storage continuing to drop. The shut down of 8 GW of coal plants this summer the now talked about warm summer being forecasted. The U.S. Energy Information Administration researchers calculated U.S. natural gas rigs decreased by 32%, roughly 50 rigs, between 2022 and 2024. The majority of that reduction occurred in the Haynesville Shale and Appalachia Basin, which have helped supply the growing demand for feed gas from Gulf Coast LNG terminals during the same period. Both regions declined by a combined 21 rigs last year as natural gas prices continued to crater amid surging oversupply and the pull of LNG demand from Europe.
So, for the immediate future, keep an eye on those lower support levels. Pricing will begin to move higher sooner rather than later. May is not too far off, and the cooling season is about to begin soon in the southern US.
Keep it Burning!

For elenaecHead and shoulder pattern. Combine this with peace between Ukraine and Russia. Hmm could work out. Yolo

#NATURAL GAS Demand ZoneA Natural Gas Demand Zone refers to a specific price level or area on a chart where the buying interest in natural gas is significantly strong, leading to a potential reversal or pause in a downtrend. This concept is commonly used in technical analysis by traders to identify key levels where the price of natural gas might find support and reverse upward.

NAT GAS ShortNG1! short on regression break - the future roll short is +1.3% per a month
I am not taking this trade.
Naturalgas Buying Opportunity - Ultrashort termDate- 12-march-2025
Naturalgas Looking Good For buy for 2-3 day for 15-20 point with stop-360 CMP- 363 . It will move upward from CMP if Buyer Sustain Price Above CMP.

Nat Gas Update 3/11/24: Redundantly redundant!
(Chart is the price of NG1 to USO, inlay is 15 year average WTI price, from Dec 15 – March 15, last 15 years)
These past weeks I have been discussing two major issues. One was the upward momentum of pricing going into the shoulder season, due to several effects. The other is a Sudden Stratospheric Warming (SSW) Event (I have nothing more to discuss about this issue. As of now it shows up March 20th-April 15th or it does not. You can read my past ideas and watch the videos for explanations.). I did address the Trump tariffs back on 2/10/25, indicating that Trump is more bark than bite. Maybe this needs a bit more!!!!()
But it now seems that the market is just as uncertain to this barking dog, vs afraid of the bite he can inflict. The one thing the market hates is uncertainty. It can take bad news, in stride. Being able to hedge options and reposition assets to minimize losses and see new avenues of opportunities. But Trump’s on again, off again tactics are destroying market confidence along all fronts. I believe most informed market analyst have been pointing out the fundamental reasons that I have been discussing, for a strengthening market this year (which I will address tomorrow). The four horse men are, storage, LNG exports, higher energy demand, and low rig counts. The EIA has increased the HH monthly future price every month since December, in their monthly STEO report. The has not been any uncertainty from producers in showing restraint from the lows last summer. This past week’s quarterly conference calls form the NG majors, have continued to strengthen their resolve for not oversupplying the market once again. There are only a few producers that have signaled their intent to increase rig count, and by modest amounts.
The incredible increase in price these past 8 days were influenced by Trump. His tariff rhetoric beginning with the lack of any deal with Mexico and Canada after the one-month suspension of the January tariffs. Only to be walked back later in the week, then again, walked back further for provisions to Corporations that have been compliant with the previous USCMA trade agreement. The investing community again will wait until April 2nd to see what new chaos will ensue, only to be rescinded and spun again. The European issue, with Trump supporting Russian plans for a negotiated peace deal, followed by threats of sanctions on Russian banks. We should start to tie the price of the Dutch TTF to which way the wind blows in favor of Ukraine or Russia. Talk about uncertainty!!! So if you take out fundamental, there is only one option left, and that is pure speculation. My belief, as others are, that this present market has suspended any formal ties to market fundamentals and structure and pricing.
The most recent COT report by the CBOE shows that the number of long vs short positions in the market are the highest since July 2023. The ration of longs to short have not been this high since Summer of 2022!! Not saying that this is where we are headed. Just pointing out that managed money sentiment is and has been quite bullish for about three weeks now. Getting more bullish by the week. This past weeks price move on Tuesday was due to a large fund liquidating, which possibly has dried up a large majority of the near term shorts in the market. This past Sunday night, a lot of buy stops above the opening were met last in thin night trading, a big trader or fund blew up (margin call liquidation), or a combination of both. I don’t see any good fundamental or technical reason for gas to have gotten to those levels, which means people were probably buying up there because they had to, not because they wanted to.
But what does that mean about forward pricing? Well, it was inevitable that we would see prices at these levels this trading season. But I think very few were prepared to see the price move so far, so fast. Why, we ask? And the answer just might lie in the seasonal Oil/NG trade. Most winters, with a healthy supply demand balance, the price of NG typically begins drops into the shoulder season starting sometime around the end of the year. Not exactly the end, but sometime around the end. The chart provided shows the average price of WTI for the past 15 years, and we can see that from mid-December to mid-march the average price of WTI increases. Energy traders trade energy. We trade, oil, gasoline, heating oil, NG, distillates, etc… There is a direct correlation to the drop in NG and heating oil to the increase in WTI/Brent. But not this year. This upward trend in prices has to do with refiners locking in pricing for the upcoming gasoline cycle. Not going to get into it here. But the short end. NG down, Oil up = normal seasonal trade. But this year. Oil down, NG up. I believe this is only speculative in nature, due to market dynamics and a need to park capital. See my charts above of the historic relationship vs the last three months.
So, we have a group of traders who specialize in energy, who shift allocations around all year, Spring – Oil, Summer – Gas, Fall – NG, Winter – Diesel/Heating Oil. The pattern is repetitive for allocation unless there is some kind of disruption. ENTER TRUMP!!!! There is no doubt that we will see $5.00 NG this year, but I just do not think it has staying power. My belief is that in the short term, we will have a pullback in prices, to a fair adjusted value of somewhere in the $3.90 - $4.35 level until the injection season begins. I would take every opportunity to buy pullbacks in prices below the $4.40 level. The next big energy trade will be Oil again, for the COT report shows the seasonal longs in the market to place orders for the upcoming summer driving period. They are taking long positions to have crude at the refineries in time for the summer blend to be produced. I look at the end of march each year in a bump up in Oil prices, until about April 15th (a nice once a season trade I enjoy). Has followed this path 17 out of the last 22 years, and I have no reason to not believe this will happen again. So, energy traders are going to need some allocation for the upcoming April contract in WTI, to meet May delivery, for Memorial Day gas blend. So, sell what they are running up! NG!
Again, this is a very volatile time. I do not recommend this type of trading for the novice, but since Friday’s close I have a strangle in place. Which is two OTM option position. I placed a call at $5.20 and a put at $4.05. I closed my $5.20 call Sunday night not too long after the price settled back from $4.90. It was a nice unexpected position to close. I reentered a $5.00 call again before the market closed today. I will play the volatility back and forth until fundamentals return. Tomorrow I will update the fundamental for the upcoming 8 weeks or so. Not that it matters with this Trump wrecking a pretty sure thing! But we must be ready before the other do. That is how we stay on top of our game.
Keep it burning!

Cheaper GASHead and shoulder pattern. Combine this with peace between Ukraine and Russia. Hmm could work out. Yolo

GasNatural Gas
Key Points in this Chart :
Bearish Channel
Break of Structure
Elliot Waves
Fibonacci Level - 161.8% / 200.0%
Support Level

NATGAS BULLISH BREAKOUT|
✅NATGAS is trading in an
Uptrend and the price made
A strong bullish breakout
Of the key level of 4.400$
Which is now a support
So we will be expecting
A further bullish move up
LONG🚀
✅Like and subscribe to never miss a new idea!✅

Gold | Oil | Dollar | Silver | Natural Gas Price ForecastFutures Commodities Forecast | Gold | Oil | Dollar | Silver | Natural Gas Price Forecast
COMEX:GC1! NYMEX:NG1! NYMEX:CL1! COMEX:SI1!

NATGAS Set To Fall! SELL!
My dear followers,
I analysed this chart on NATGAS and concluded the following:
The market is trading on 4.401 pivot level.
Bias - Bearish
Technical Indicators: Both Super Trend & Pivot HL indicate a highly probable Bearish continuation.
Target - 4.316
About Used Indicators:
A super-trend indicator is plotted on either above or below the closing price to signal a buy or sell. The indicator changes color, based on whether or not you should be buying. If the super-trend indicator moves below the closing price, the indicator turns green, and it signals an entry point or points to buy.
———————————
WISH YOU ALL LUCK

NATGAS: Bearish Continuation & Short Trade
NATGAS
- Classic bearish formation
- Our team expects fall
SUGGESTED TRADE:
Swing Trade
Sell NATGAS
Entry Level - 4.401
Sl - 4.546
Tp - 4.137
Our Risk - 1%
Start protection of your profits from lower levels
Disclosure: I am part of Trade Nation's Influencer program and receive a monthly fee for using their TradingView charts in my analysis.
❤️ Please, support our work with like & comment! ❤️

Naturalgas Longside , Risky but seem Good Naturalgas near buying zone range Rs160-165 for Short term ( 7-10 days) . Price is near 50 EMA on 1hr timeframe. Price went above VWAP which indicate Buyers are interested to Move price further. Expect upmove till Rs390-395 if buyer sustain price.

NGI am actually liking natural gas rn for possible longs
Daily Bullish
4hr Bullish
30m Waiting
5m Waiting

#NATURALGAS DEMAND ZONE 07/03/2025If you're analyzing Natural Gas (NATURALGAS) for a potential demand zone, here's a detailed guide on how to identify and analyze demand zones using technical analysis. A demand zone is an area on the chart where buying interest is strong, causing the price to reverse upward.

Nat Gas midweek Recap: 3/5/25 Trump trumps the fundamentals!
Wow!!! What a week. I stayed up late Sunday night to see the early model runs print, which printed back to the colder, Weekend model ideas, to close my puts. I woke up seven hours later to a rally in NG back to the 3900 level from 3770! But knowing that the Trump tariffs were to take place yesterday, my belief was that there would be a great deal of speculative panic in the market. Which can go either way! I did sit out Monday to gauge the market to see what could possibly be moving such a move. After the midday models printed back to a bit of a warmer solution, I knew that a short squeeze was on after price spiked for the day. I did take a short position after the run up Tuesday after the price had spiked and was beginning the first of many rollercoaster rides! I did not close any of my positions out due to the price not hitting my 4150-418 target today, but my belief is that this is a short covering rally due to overall uncertainty. My belief is still that the third week of this month will begin to consistently print cold into mid-April. Knowing that there is now a new upper price target above 4500, this looks very, very promising. But this has been a great trading week if you are able to get on the right side of the trades, but for me, I can wait until the big speculators take some big profits this week. I am still waiting for my target back down to below the 4150-4180 to exit my short and renter a long for the coming cold.
Heating demand had little to do with buying this week, as the 15-day U.S. and European outlooks trended warmer Sunday night and a bit cooler today. Both with a large jump in daily prices. This week’s large price swings reflect an uncertainty among investors about as they contemplate many inputs, including tariffs, geopolitical tensions, uncertain weather forecasts, consistent storage deficits. The large gains earlier in the week and in the mid-day New York today have primarily been due to short coverage, from the remaining shorts in the market. Coming into this week, natural gas speculators were less short than they have been in almost a year. This tells me that we are probably short-squeezing the remaining positions. There was news on the online industry forum Enelyst that today’s giant spike was due to a large fund liquidation due to a margin call from Monday and Tuesday’s large price move. The curse of the margin!
U.S. markets appear to be shocked by the real enactment of tariffs, as many investors had priced in some amount of skepticism due to Trump’s delay of tariffs earlier in February. Trump did follow through with his 10% tax on Canadian oil and gas, with Canada stating it intends to enact retaliatory tariffs in 21 days if they are not removed. Despite an estimated 1.3 Bcf/d drop in Lower 48 gas production due largely to pipeline maintenance events, Wood Mackenzie estimated that pipeline imports from Canada plunged to 4.5 Bcf/d Tuesday from 6.2 Bcf/d Monday as the import levies took effect. Since Canadian imports account for a relatively minor share of the larger U.S. market, Industry experts posted “tariffs alone are unlikely to cause significant increases in price, especially at the Henry Hub,” the G&A team said. “We expect natural gas’s price movement for today and the past couple of days to be based on non-fundamental dynamics in large funds covering short positions after initial movement on trade war fears.”
However, “the near-term situation only tells part of the story,” said Pinebrook Energy Advisors’ Andy Huenefeld, managing partner. “The market appears to be shifting to panic mode due to the massive storage deficit against a backdrop of underlying fundamental market risks.
“With inventories set to exit the winter at a deficit of more than 700 Bcf to year-ago levels, the market is staring at an uphill battle to bring stocks back to healthy levels heading into next winter.” He added, “If inventories were to grow at the same rate as last summer, from an expected bottom near 1.5 Tcf, stocks would top out in October at less than 3.2 Tcf. This would be dangerously low heading into an uncertain winter and an extremely bullish development for the U.S. market.” Huenefeld also noted that “demand for LNG could easily be as much as 2.5 Bcf/d higher than year-ago levels throughout the summer.” Higher gas prices should coax producers to increase output. However, a shrinking coal-fired power fleet and growing intermittent renewable generation could limit the potential for price-induced demand destruction in the power sector, he said.
As for the heating demand outlook in North America, midday weather data “maintained a couple chilly weather systems sweeping across the northern and eastern U.S. late this week through early next week with lows of 0s to 20s for stronger national demand,” NatGasWeather said. “This includes the southern U.S. cooling several degrees as well.” Models showed the March 11-16 period as “not nearly cold enough to intimidate,” the forecaster added. The data favored “a closer to seasonal U.S. pattern March 17-20 as temperatures become near normal over most of the U.S., although quite far out in time and where changes are likely.”
Wood Mackenzie estimated U.S. LNG feed gas flows at 15.3 Bcf/d Wednesday, versus the recent seven-day average of 15.3 Bcf/d. Dutch Title Transfer Facility prompt month futures fell 13% this week. After the European benchmark surged on Monday in the wake of a contentious meeting between President Trump and Ukrainian President Volodymyr Zelenskyy.
Wow this all makes no sense!!!! Bullish new, bearish news, what to do!!!!!
The overall market trend is in a bullish state. But do not let the emotional side of the past few days let you forget that the fundamental picture will come back into view eventually. Tomorrow’s EIA report should come in somewhere around normal for the time period. Trump again is back peddling on his tariff threats, look at the second 30 day hold on the car companies and now ag sector announced later today. Continue to enjoy these wild daily swings and hop onboard the price swings. But remember Friday is coming and there are profits to close out for the week on the 70 cent move this week. I am committed to holding my puts entered at the peak Monday until the price settles down to the 4150-4180 level. I will stay disciplined and follow my path and not let others emotional appeals and move sway my plan. Reenter and let the weather turn, where there will be no talk of any warming in the models, or a possibility of the withdrawal season being over. We are almost there, then it is time for Round two, the shoulder season.
Keep it burning!

NATGAS What Next? BUY!
My dear friends,
My technical analysis for NATGAS is below:
The market is trading on 3.819 pivot level.
Bias - Bullish
Technical Indicators: Both Super Trend & Pivot HL indicate a highly probable Bullish continuation.
Target - 4.073
Recommended Stop Loss - 3.667
About Used Indicators:
A pivot point is a technical analysis indicator, or calculations, used to determine the overall trend of the market over different time frames.
———————————
WISH YOU ALL LUCK

NATURALGAS BREAKOUT WATCH: BULLISH MOMENTUM?📊 Natural Gas Detailed Analysis – 1HR Timeframe 📊
Pattern Formation & Breakout Potential: Natural Gas has been trading within a falling wedge pattern, a bullish reversal structure, indicating potential upside momentum.
A breakout attempt is visible as the price is trying to sustain above the wedge resistance.
Key Observations
✅ Resistance Zone: 343 - 345 (previous supply zone, acting as resistance)
✅ Support Zone: 330 - 335 (previous accumulation area)
✅ Volume Spike: Increased buying interest indicates strong demand near the lower levels.
✅ EMA (55): Currently acting as dynamic resistance near 342-343. A sustained breakout above this could trigger a further upside move.
🎯 Target Levels:
First Target: 350
Second Target: 354
Extended Target: 360 (if momentum sustains)
🛑 Stop-Loss Strategy: Placing SL below 338 ensures a safe risk-reward ratio in case of a false breakout.
A breakdown below 330 invalidates the bullish setup.
If price breaks above the resistance zone and sustains with strong volume, it can trigger bullish momentum towards 350-354 levels.
However, failure to hold above resistance can result in sideways consolidation or a pullback before the next leg of movement.
Disclaimer: Traders should watch price action closely and wait for confirmation before entering positions.
📢 Stay alert for market developments and manage risk accordingly! 🚀🔥
#NaturalGas #TradingAnalysis #Breakout #CommodityTrading #MCX

Henry Hub Rally Poised To Extend as Tailwinds Hold StrongHenry Hub Liquified Natural Gas (“LNG”) prices are roaring back, surging in February as frigid temperatures, falling inventories, and soaring LNG exports fuel a bullish rally.
With US storage dipping below the five-year average for the first time since 2022 and technical indicators flashing strength, does the rally have more room to run?
LNG RALLIES AS COLD WEATHER FUELS DEMAND AND TIGHTENS SUPPLY
CME Henry Hub Natural Gas Futures (“CME LNG Futures”) have surged 26% in February, rebounding from a 16.2% decline in January. The rally has been driven by rising exports, falling storage levels, supply disruptions, and colder-than-expected weather.
January’s decline was surprising, given that U.S. temperatures averaged 29.2°F in January (0.9°F below average, around -1.56°C), the coldest January since 2005. This resulted in the average daily gas consumption reaching 124.4 Bcf, which is 12% higher than the five-year average, according to the EIA .
Prices initially climbed 10.2% from 03/Jan to 24/Jan in response to strong demand, but a late-month selloff erased gains as forecasts turned milder.
February saw a swift rebound as colder-than-expected temperatures pushed heating demand beyond expectations, fuelling a price rally.
European gas markets added further support, with Dutch TTF prices hitting a two-year high on 11/Feb amid freezing weather, Norwegian supply disruptions, and rapid storage depletion.
However, European prices have eased recently due to Russia- Ukraine peace talks, milder forecasts, and discussions on EU storage policies.
LNG EXPORTS RISE AMID GROWING GLOBAL DEMAND
US LNG exports surged in January, driven by cold temperatures, depleting reserves, and Europe’s shift away from Russian gas. The US exported 8.46 million metric tonnes (412 Bcf) of LNG in January 2025, with 86% heading to Europe—a sharp increase from 69% in December reports Reuters . However, exports remain below the record 422.9 Bcf set in December 2023.
Source: EIA
Meanwhile, the latest EIA data (updated till December 2024) shows that US LNG exports rose 0.6% YoY in 2024.
Export volumes are poised to rise further, supported by Trump’s energy policies easing LNG infrastructure development. Gas flows to export terminals have increased, averaging 14.6 Bcfd in January, and expected to reach 15.6 Bcfd in February. Gas flows are well above the levels seen in Q4 2024, October (13.1 Bcfd), November (13.3 Bcfd), and December (13 Bcfd).
A key advantage for US LNG is the absence of destination clauses, allowing buyers to redirect shipments based on demand. Even if Europe does not fully wean off Russian gas, growing U.S. export capacity ensures flexibility to serve other markets, particularly Asia.
INVENTORIES FALL BELOW 5-YEAR AVERAGE; EIA RAISES HENRY HUB PRICE FORECAST
Amid colder-than-expected weather and rising LNG exports, LNG storage levels have fallen more than anticipated, dropping below the five-year average (2020–2024) for the first time since 2022.
Source: EIA Data
Storage fell below the five-year average in the week ending 24/Jan and remained below since. As of the week ending 21/Feb, inventories were 11.5% lower than the five-year average. Weekly storage declines have exceeded analyst expectations for four consecutive weeks, indicating stronger-than-expected demand.
Source: EIA
According to the EIA’s latest Short-Term Energy Outlook (STEO), January withdrawals from underground storage totalled nearly 1,000 Bcf, 39% above the five-year average. The agency expects inventories to end the withdrawal season (Nov–Mar) 4% below average, citing higher consumption and flat production through Q1 2025.
Source: EIA STEO
In response to tightening supply, the EIA raised its Henry Hub price forecasts for 2025 and 2026 by 20.7% and 4.8%, respectively, compared to prior estimates.
TECHNICAL INDICATORS SIGNAL SUSTAINED BULLISH MOMENTUM
With bullish fundamentals supporting Henry Hub prices, technical indicators also signal an uptrend.
Monitoring the 9-day EMA/21-day EMA cross helps identify trend shifts for day trading. A golden cross, a bullish signal (9-day EMA above 21-day EMA), indicates upward momentum, while a death cross, a bearish signal (9-day EMA below 21-day EMA), suggests weakening price action.
The 9-day EMA crossed above the 21-day EMA on 18/Feb, forming a golden cross. The widening gap suggests growing bullish momentum.
However, the MACD has turned negative after a strong bullish trend. Meanwhile, the RSI hovers at 50.39, down from its monthly peak of 66.60 & below its moving average of 56.66.
Source: TradingView
TradingView’s technical analysis dashboard also indicates a bullish trend.
COMMITMENT OF TRADERS
For the week ending 18/Feb, managed money’s net long positions in Henry Hub natural gas (futures & options) increased by 40% WoW, marking a second straight weekly gain. Long positions grew by 14.4% to 241,541 lots, while short positions inched up 0.2% to 137,674 lots.
Source: QuikStrike
Long positions have risen steadily since 11/Feb, while short positions remain unchanged, implying a growing bullish sentiment in the market.
HYPOTHETICAL TRADE SETUP
Multiple factors continue to support Henry Hub prices, including cold temperatures, rising LNG exports, expanding US LNG capacity, and falling inventories.
Adding to the bullish outlook, near-term production declines are expected to tighten supply through the remainder of winter. With these fundamentals in play and strong technical signals, natural gas prices may have further upside potential.
Portfolio managers and traders can capitalize on a bullish LNG outlook by tapping into CME Micro Henry Hub Natural Gas Futures. These contracts offer the same exposure as standard Henry Hub futures but at 1/10th the size, providing enhanced accessibility and more precise risk management opportunities.
This paper posits a long position in CME Micro Henry Hub Natural Gas Futures (Apr 2025) expiring on 26/Mar (MNGJ2025) with the following trade setup:
• Entry: 3.75/MMBtu
• Target: 4.25/barrel
• Stop: 3.45/barrel
• P&L at Target (per lot): +500 ((4.25 – 3.75) x 1,000)
• P&L at Stop (per lot): -300 ((3.45 – 3.75) x 1,000)
• Reward-to-Risk Ratio: 1.67x
CME Group lists a raft of products covering a range of asset classes more accessible while also enabling granular hedging for portfolio managers.
Investors can learn more about how to access these micro products by visiting the CME Micro Products page on the CME portal to discover micro-sized contracts to gain macro exposures.
MARKET DATA
CME Real-time Market Data helps identify trading set-ups and express market views better. If you have futures in your trading portfolio, you can check out on CME Group data plans available that suit your trading needs tradingview.com/cme .
DISCLAIMER
This case study is for educational purposes only and does not constitute investment recommendations or advice. Nor are they used to promote any specific products, or services.
Trading or investment ideas cited here are for illustration only, as an integral part of a case study to demonstrate the fundamental concepts in risk management or trading under the market scenarios being discussed. Please read the FULL DISCLAIMER the link to which is provided in our profile description.
