BRN1! trade ideas

Oil dead cat bounce continues but will be short lived.Oil is in a bear market and will eventually go back down to $28 a barrel. What we see now is a dead cat bounce that has done better than expected. However, I think it's coming to an end sooner or later. I will first start by identifying key levels. I identified four horizontal lines that solidified through the last decade. These are the $80, $70, $63, and $45 levels. Then we have our Consensio moving averages (15-day, 50-day, and 200-day). I tried fitting a Fibonacci retracement but my attempts failed.
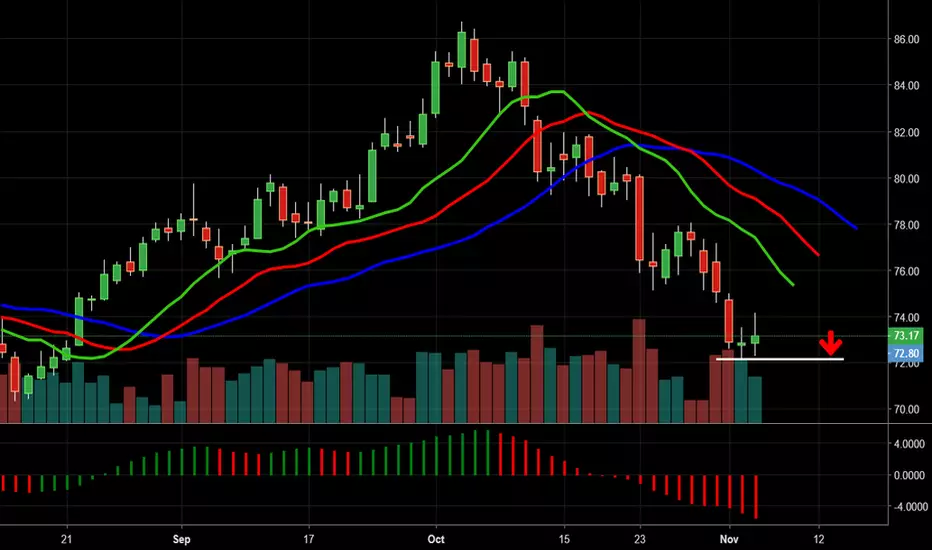
So now we see a small rally that impressively crossed the 50-day MA after staying below it for 3 months. Both the daily and the weekly closed above it. So how long do we expect to stay above it?
Well the smaller the area we get squeezed in, the quicker we will fall back below it. The first hurdle to pass is the $63 resistance below which we are currently sitting. TD sequential tells us on daily and weekly timescales that we have momentum to cross above it since we see a green 2 trading above a green 1 and a green 3 above a green 2. Also last week's candle gave us a bullish pin bar. So we have two cases:
Case 1: If we do NOT close above $63 on the weekly, then we will quickly be squeezed between it and the quickly-closing-in 50-day MA. Once we're squeezed, we expect a break to the downside but we need to re-evaluate the probabilities then.
Case 2: If we close above $63 on the weekly then the next resistance is the $70 level and the 200-day MA. These two combined are formidable resistance and I give less than 20% chance that price will break through them in this bear market before establishing a bottom. Now if we trade between $63 and $70, then we will be squeezed between the 50-day and 200-day MAs, and we are more confident that the squeeze will lead to a breakdown that takes us down to $45.
We favor case 2 because it gives a clearer sign and stronger momentum for bearish action. It's also favorable if you want to trade this as a swing.
We will continue watching TD sequential count on the daily and the moving averages.

BRENT CRUDE OIL LAST DAY FUTURES (MAR 2019), 1D, NYMEXTrading Signal
Short Position (EP) : 62.47
Stop Loss (SL) : 62.99
Take Profit (TP) : 61.43
Description
J26H2019 formed Double Repo Sell at 1d time frame. Trade setup with Sell Limit at 0.382 Level (62.47) and place stop after 0.618 level (62.99). Once the position was hit, place take profit before an agreement (61.43)
Money Management
Money in portfolio : $280,000
Risk Management (1%) : $2,800
Position Sizing
$0.01 = +-$10/std-contract
Commission fee = -$2.44/std-contract
EP to SL = $0.52 = -$520
Contract size to open = 5 standard contracts
EP to TP = $1.04 = +$1,040
Expected Result
Commission Fee = -$12.2
Loss = -$2,600
Gain = +$5,200
Risk/Reward Ratio = 1.99


Brent oli 60 min chart. Time for a rally?It's oversold in daily chart and forming a rangebound in 60min chart. It's edge for a rally in the 60min chart.


Where Will Energy Bottom? Brent OilTaking another stab here at picking a bottom in oil. Midpoints are difficult to decipher in such drastic sell-offs but if you catch the bottom we'll be well rewarded with an inevitable massive short squeeze. Regardless, this is def a high-risk trade. The relentless sell-off seems to be heavily algo-driven and major energy funds liquidating (according to rumors) so if another major energy fund goes tits-up it could crash the price right through my buy zone.
A considerable dip below the 59.47 target shown here is likely so my stops wont be hit until below 55.50. VERY wide stops. Downsize positions and manage risk accordingly. Entries for me are 58.84 and down. No urgency to get entries filled today with the shortened US. Thanksgiving session.
Zoom this in on a daily timeframe and you'll note decent respect of all fib levels, suggesting this could be a valid setup.

Brent : A Top ?US has allowed some countries to import Crude Oil from Iran -- not completely stopped. So a reversal in sight . Could this be the Start of Wave 5 ?? But as Equities market have started to fall, there could be a fall coming in Crude Oil as well !!


Sell up PRZ - T/PHi guys
1-simple look
2- Price - Pattern - Time - Momentum
3-Technical
Have a great day everyone!

Oil Sell-off Almost CompleteStalking a very nice setup here on UK Oil...
Starting with the first fib anchor point at the swing high of 86.69, the yellow circle highlights a distinct candle pattern that qualifies as a midpoint (place 50% fib here). Target zone for considering the sell-off complete and consider getting long is 69.20 and slightly below.
As secondary confirmation that this fib setup has legitimacy, look how well price respected the other fib levels (which just land where they may when placing the 50% fib through the midpoint first and foremost)
Similar setup in WTI as expected


Short OilBrent Oil is in overbought territory, likely forming a triple top on the daily chart, and retrace to test the trend line. short here with a first target around 70 and second target at 60.

CRUDE OIL: Sees Further Upside, Eyes The 70.41 Region CRUDE OIL: Sees Further Upside, Eyes The 70.41 Region
CRUDE OIL: The commodity faces further recovery threats following its higher close on Wednesday. On the downside, support resides at the 69.50 level where a break will expose the 69.00 level. A cut through here will set the stage for a run at the 68.50 level. Further down, support resides at the 68.00 level. On the upside, resistance resides at the 70.50 level. Further out, resistance comes in at the 71.00 level. A break above here will aim at the 71.50 level and then the 72.00 level followed by the 72.50 level. Its daily RSI is bullish and pointing higher suggesting further strength. All in all, CRUDE OIL remains biased to the upside.


BR1Retraction can be expected up to the support channel where OBO is formed in the log.
Another important factor is the significant decline in long positions in oil contracts over the past two months. According to CFTC data, long positions in futures oil contracts have experienced a decrease of about 40% since April.
My analysis is not an investment recommendation, it is my personal work


BRENT futures on MOEX 1D price analysis Disclaimer: I'am working here just with technical analyses, this work is not include fundamental trends analyses, only few words and mathematical analysis.
Here is my thoughts of current oil price movement.
Last week was pretty good for a price, can we expect to downtrend for next week or next 2-3 days ?
In my opinion there was first try to leave channel (first wave), second was more successful (second wave) and now we can expect for a third wave?
1D MacD is shouting: SELL, but due to 4H MacD all is under control and we can expect for a new heights.
If we talk about growth: as for me i found only 2 growth waves, so i could expect 69.31 as first reversal level or 67.55. I can expect growth trend up to corridor created by 2 blue lines.
I believe that we will see 67.55, but confirmation of strong downtrend is under of grey corridor ( light blue area ).
News: Last week has positive news background about opec+ and etc. Can we expect support of positive news background or the decrease in investors' interest after last week's news? US report told us about huge crude oil reserves and low reserves of gasoline... WTI confidently going down on this news. Russian Ruble, MICEX index looks strong and MICEX oil industry index has positive trend.

Brent crude oil upside price action continuationEdu bullish setup for Brent crude oil June '18 futures contract.


