BRN1! trade ideas


Brentoil My analysis indicates that the brent is going a bit further high since the buying pressure is really obvious.

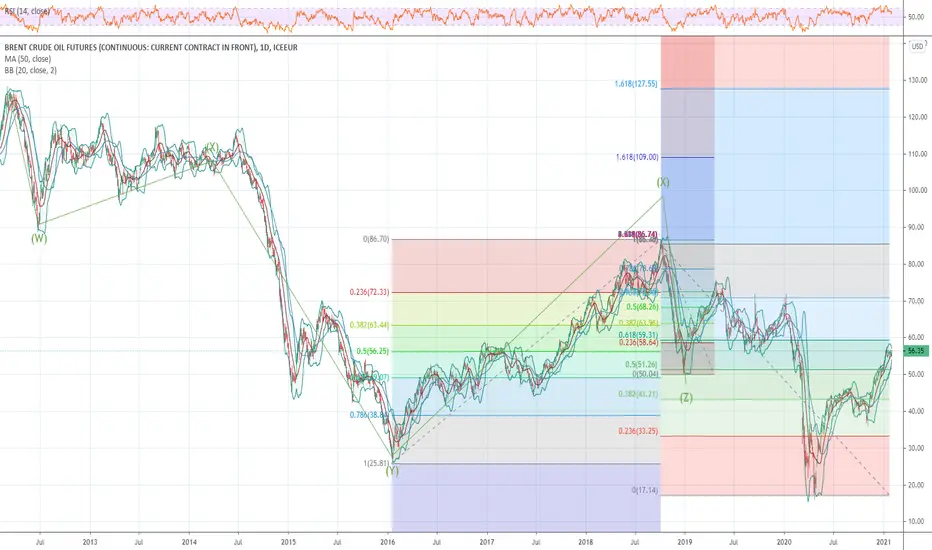
Brent: Forming Head & ShouldersAfter bouncing back from the pre-pandemic resistance and touching the channel's resistance since 2008 Brent seems like forming a head & shoulders pattern.


Comparing Different Asset ClassesThe above chart illustrates the performance of different asset classes in % change from Mar'20 low .
The list of included assets is as follows:
Copper
Gold
ES
Brent
DXY
For the futures markets, the Jun'21 contracts are used; for DXY, the ICEUS index is used.
As seen in the chart, the best performing commodity is copper, the rise in copper prices is led by firm demand, especially from China. The oil market comes in second here, with an increase of almost 60%, oil price is now entering overbought territory, though there is still some room for further upside. The S&P500 comes in third here with an increase of almost 55% from the Mar'20 low. Many traders are still looking to get more upside exposure here; nonetheless, the risk of sudden price plunge is elevated at these levels. With regard to gold — the safe-haven asset which usually outperforms all other asset classes during financial turmoils — its performance hasn't been anything close to spectacular. The reason for lack of performance by gold is BTC and silver, both of which showed outstanding resilience to overall market conditions. Our loser of the year is DXY, which has lost almost 10% of its value since the Mar'20 low.
Talking of BTC, I did not include BTCUSD in the chart as the chart gets destroyed by it, I am attaching it here separately for ease of reference and to show how BTC is turning the financial world upside down.


OIL me up What a crazy rally its been for oil since last November.
Just passed the .786 Fib level on the daily based on the highs of Jan 2020 and looks pretty solid growth wise.
Possible it can go to top of channel around 65.
Definitely been good for the OPEC cartel and the USA.
Maybe theres some cracks?
A lot of traders are pricing in a recovery already in travel and based on vaccination roll out (new variants) seems like this might have been jumping the gun a bit.
Ichimoku looks like it about to cross over and the baseline has been acting as support during this rally. How long will it sustain?
Completely over bought on the daily chart and just went into overbought territory on weekly chart as well.
historically OIL and DXY have been inversely correlated since the oil trade around the world is done in the good ol Benjamin.
Curious to see how a decline in prices would affect DXY.
Let's see what you think,
That's all folks.


Brent Oil Futures (BR1!) Time to Fall
Brent oil finally reached a major strong weekly resistance.
On that, the price has formed a h&s formation and just broke below its neckline.
Taking into consideration the overbought market, chances are high that the price will go much lower.
Goals - 53.15 / 51.0
Please, support this trade with like!


Crude Oil's Rising WedgeFormer late 2018 support at round $50 per barrel depresses current uptrend and could become a resistance forming a rising wedge pattern that lead to falling prices.

Ready, they are coming back !With the rising of the oil price recently with the good news coming to the post pandemic. Oil and Gas stock becoming one of the sector that will be bloom in every economy recession.
For a long time of momentum, here we are again.
Stock to be the first movers.
- Refinery and Retailing
1. MYX:PETDAG
2. MYX:PETGAS
3. MYX:GASMSIA
4. MYX:DIALOG
5. MYX:PETRONM
6. MYX:HENGYUAN
7. MYX:DAYA
-LPG Cylinder
1. MYX:KUB
2. MYX:KKB
- Petrochemical and Resin and Plastic etc...
1. MYX:PCHEM
2. MYX:LCTITAN
- Upstrean
1. MYX:HIBISCS
2. MYX:DAYANG
-Engineering
1. UZMA MYX:UZMA
2. MYX:DELEUM
3. MYX:PENERGY
4. MYX:SERBADK
-All given are the company stock with the strong financial analysis.
#TAYOR
#BURSA
#FBMKLCI


Possible Bullish outlook for Brent.Brent continue to form classic uptrend pattern in tandem with trendline.
Chart pattern: inverted head and shoulder with clear breakout neckline.
Latest forming the cup and handle with lower bounce + Hammer.
i am pro bull on this one.
**simplistic analysis.
