BearishSee in Chart..
See in Box candle
Same uptrend showing in both side..
So if this time NG not cross above 2.789.
Chances down again 2.5 or below..
Let's see..
GWM1! trade ideas

NATURAL GAS BULLISHSee in Chart..
Natural Gas trend up..
See Fibonacci level..
Buy level around 230 and SL 215
upside expected till 250/265/280+


Long on natural gasSeeing that the situation continues between Russia and Ukraine, gas will keep on going to bigger levels until another country takes the head approach on distribution.
I'll keep on looking at supports and resistance levels.

Winter is coming - NATGAS will riseThe inverse bullish divergence in NATGAS suggests that the price of the important energy carrier will rise significantly soon.
To that extent, this forecast harmonizes with the seasonality.
As a first target, we therefore choose the order block at just under 3,800.

Nat Gas an Expanding Wedge offers an upside bias Mixed and volatile trading has resulted in an Expanding Wedge formation being posted on the intraday chart. This pattern has a bias to break to the upside. On a break through 2.656 the measured move target is the previous swing high at 2.794.
With bespoke resistance located at 2.621, there is ample scope for a corrective dip to the downside before the impulsive rally begins.
It should be noted that with a confluence zone located at 2.847, we could extend higher and the initial target level.

Bull flag or bearish channel?I don't know. Could be a bearish channel. I mean....
1. Half the world is on fire right now.
2. Europe is seeing record heat with no end in sight.
3. 1/3 of US has heat warnings
4. Some little Mexican guy named El Niño wants to kill us all
5. North Atlantic surface temps never been this high
6. In Phoenix, you can fry an egg on your wife's ass
7. All the idiot tech bro's that moved to Austin from San Francisco now regretting it.
breaks 2.70ish = gap fill to $3

Natural Gas and Stock market 7 Mega Cap Stock AnalysisQQQ daily downtrend confirmed
SPY hasnt
SMH weaker today compare to QQQ

NatGas: Take-off 🛫The price of NatGas has gained significantly again since Friday and could thereby move further away from the support at $2.48. Thus, we assume that it has already left the white wave (2) and is ready for high flights. For the white wave (3), it must rise significantly above the resistance at $2.75. After the completion of this wave, we expect a small correction and then another significant rise in the form of the white wave 5. Hence, we see a lot of movement on the upside at the moment. However, it should be noted that there is still an alternative scenario with a probability of 28%, which occurs if the price now falls contrary to our expectations. Then it would first have to fall below the support at $2.48.

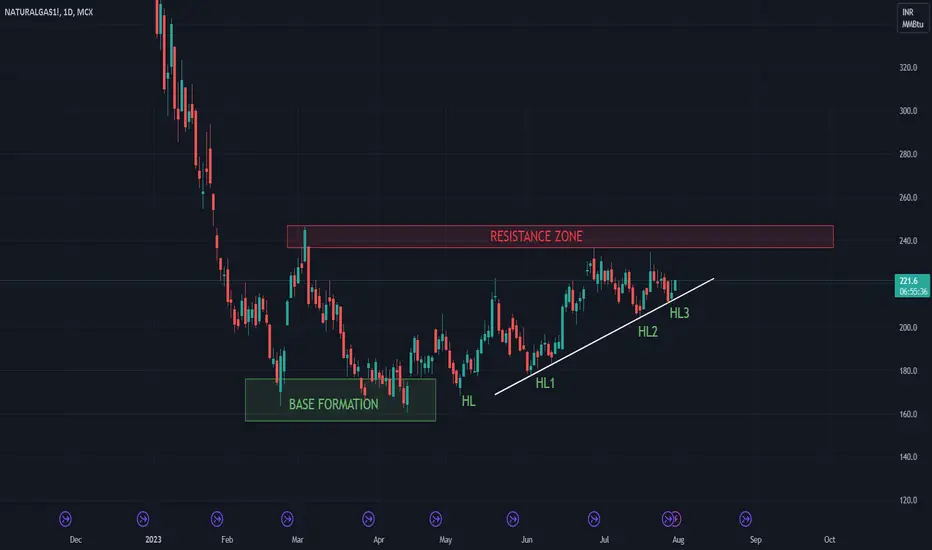
NATURAL GAS Natural Gas brakes above resistance zone it can be a blast because from september onwords demand will increase in europian continent due to winters.
Natural Gas & SPY QQQ & 7 MEGA Cap Tech Stocks Analysisinside bar for stock market thursday low and high is key for me which way we break

Bob assignmen: Tesla Natural Gas7.27.23 In this video I tried to show how Tesla is likely to move lower even though it corrected higher to a 382 level and it also retested a gap lower..... in other words it's likely to go lower even though it has had Corrections higher. Follow it and paper trade It so you become familiar with markets that don't look so good until you know what a good market looks like.... but you don't want to start trading this until you develop A comfort level because you've seen it work two or three times first.... before you plunge into the water with fear because you haven't let these behaviors sink in first. It's much easier to follow the paper so you're not focused on the fear of loss. You're constantly fearing that you will lose it's your way of telling you that you don't trust you're analysis... but you're willing to be afraid. You shouldn't do it this way.
The next market Is natural gas which is already started moving higher Suggesting that this is going to be a good long-term trade Because of all the failures to make new lows..... so the market May correct lower and it may be a little difficult to decide if you're going to take a trade where the market is today... and by definition you're not going to pick the very bottom because that happened Weeks ago.... but this will probably develop into a good swing higher.... A good market to follow for the right trade location to go along.

part 2 of 7 natural gas & mega cap tech and QQQ SPYnatural gas weekly uptrend still intact key battle zone now

NG1!: Will Keep Growing! The Next Goal is: 2.800
The recent price action on the NG1! pair was keeping me on the fence, however, my bias is slowly but surely changing into the bullish one and I think we will see the price go up.
❤️ Please, support our work with like & comment! ❤️

NG1: In anticipation of a high flightOn the chart, we see a good consolidation, after which we will see a powerful upward rally. A triple bottom has been formed, which also serves as a harbinger of a future rally. I expect a move to 4.12 after exiting the consolidation channel.
All success and profit. If you liked it - subscribe.

NATURALGAS: In anticipation of a high flightOn the chart, we see a good consolidation, after which we will see a powerful upward rally. A triple bottom has been formed, which also serves as a harbinger of a future rally. I expect a move to $340 after exiting the consolidation channel.
All success and profit. If you liked it - subscribe.

NG1! Is Bearish! Short!
Here is our detailed technical review for NG1!.
Time Frame: 5h
Current Trend: Bearish
Sentiment: Overbought (based on 7-period RSI)
Forecast: Bearish
The price is testing a key resistance 2.667.
Taking into consideration the current market trend & overbought RSI, chances will be high to see a bearish movement to the downside at least to 2.574 level.
P.S
We determine oversold/overbought condition with RSI indicator.
When it drops below 30 - the market is considered to be oversold.
When it bounces above 70 - the market is considered to be overbought.
Like and subscribe and comment my ideas if you enjoy them!

NATURAL GAS Buy lower, sell the break-outLast time we looked into Natural Gas (NG) we called for a buy entry (see chart below) right after the contact at the bottom (Higher Lows trend-line) of the Bullish Megaphone:
The 2.550 target has been hit but the rise didn't stop there, breaking even above the former 2.690 Resistance and making a Higher High in the process. The price is right now above the 1D MA50 (blue trend-line) but in terms of Risk/ Reward neither a favorable buy or a sell. We are willing to buy at 2.400 with a tight stop just below the Megaphone's Higher Lows trend-line and target 2.800 (below Resistance 1). If a 1D candle closes below the bottom (Higher Lows trend-line) of the pattern, we will sell and target the 1.950 Support.
The 1D RSI is trading inside a Channel Up pattern. If broken, it will be a first confirmation of a bearish break-out signal.
-------------------------------------------------------------------------------
** Please LIKE 👍, FOLLOW ✅, SHARE 🙌 and COMMENT ✍ if you enjoy this idea! Also share your ideas and charts in the comments section below! **
-------------------------------------------------------------------------------
💸💸💸💸💸💸
👇 👇 👇 👇 👇 👇

NG1! Buyers In Panic! SELL!
My dear subscribers ,
This is my opinion on the NG1! next move:
The instrument tests an important psychological level 2.674
Bias - Bearish
Technical Indicators: Pivot Points High anticipates a potential price reversal.
Super trend shows a clear sell, giving a perfect indicators' convergence.
Target - 2.568
About Used Indicators:
A super-trend indicator is plotted on either above or below the closing price to signal a buy or sell. The indicator changes color, based on whether or not you should be buying. If the super-trend indicator moves below the closing price, the indicator turns green, and it signals an entry point or points to buy.
———————————
WISH YOU ALL LUCK

NG1!: Will Keep Falling! Target for Buyers is: 2.553
The price of NG1! will most likely collapse soon enough, due to the supply beginning to exceed demand which we can see by looking at the chart of the pair.
❤️ Please, support our work with like & comment! ❤️

NG1! BEARS WILL DOMINATE THE MARKET|SHORT
Hello,Friends!
We are now examining the NG1! pair and we can see that the pair is going up locally while also being in a uptrend on the 1W TF. But there is also a powerful signal from the BB upper band being nearby, indicating that the pair is overbought so we can go short from the resistance line above and a target at 2.437 level.
✅LIKE AND COMMENT MY IDEAS✅

BEARISH DIVERSION RSI IN NATURALGASBEARISH DIVERSION IN RSI IN NATURAL GAS IN 4 HOURS CHART
This video is for educational purpose and my personal view . We are NOT SEBI registered Advisor, we only give the level on our practical trading experience. Kindly take the trade according to your risk and reward position and consulting your advisor. It is advisable to take the advice of SEBI registered advisor.
#nse
#nsebse
#Nifty
#niftyfifty
#bankniftytrading
#nfitybank
#niftypredictionfortomorrow
#niftyoptions
#NiftyBank
#nifty50
#nifty500
#niftytomorrow
#niftytoday
#NiftyCE
#bankniftyoptions
#sensex
#sensexindia
#sensextoday
#bankniftytips
#bankniftyanalysis
#bankniftytrading
#bankniftyoptions
#finnifty
#bankniftystrategies
#niftystrategies
#bse#bseindia
#bsesensex
#nsenifty
#nsebse
#nseindia
#STOCKMARKETEDUCATION
#STOCKMARKETUPTODATE
#STOCKMARKETTODAY
#stockmarkets
#tommorrowMarketPrediction
#nfityoutlookfornextweek
#bankniftyoutlookfornext week
#bankniftyoutlookformonday
#niftyforecast
#bankniftyforecast
#niftyshareprice
#bankniftyshareprice
#tommorrowniftyprediction
#tommorrobankniftypredicton
#niftytargettommrrow
#bankniftytargettommrrow
#bankniftylive
#banknifty
#bankniftyoptions
#bankniftystrategies
#bankniftyfuture
#bankniftyoptionstrategy
#bankniftycalls
#bankniftyintraday
#bankniftylivetrading
#bankniftyweeklyexpiry
#bankniftycrash
#bankniftytomorrow
#bankniftypredictions
#bankniftychart
#bankniftytips
#bankniftypremium
#bankniftyoptions
#bankniftyfuture
#bankniftytomorrowprediction
#bankniftyoption
#niftyweeklyexpiry
#stockmarketinindia
#derivatives
#niftypredictions
#niftytips
#bank nifty analysis,
#bank nifty prediction for tomorrow,
#bank nifty tomorrow,
#nifty prediction for tomorrow,
#nifty prediction,
#nifty analysis,
#banknifty tomorrow,
#bank nifty tomorrow analysis,
#nifty tomorrow,
#bank nifty analysis for tomorrow,
#nifty analysis for tomorrow,
#stock market crash,
#stock market latest news today,
#bank nifty live,
#live trading bank nifty,
#nifty live trading,
#live trading,
#bank nifty live trading

Technical and digital analysisWe notice that we are in an upward correction and there is an increase in momentum, we are waiting for the correction to end to enter
