NATGAS Local Risky Long! Buy!
Hello,Traders!
NATGAS has hit a horizontal
Support level of 2.20$ from
Where we are seeing a bullish
Rebound and we will be
Expecting a further move up
Buy!
Like, comment and subscribe to help us grow!
Check out other forecasts below too!
TFN1! trade ideas

Natural Gas still coiling! breakdown or breakout?Hello Traders
In This Chart NATGAS HOURLY Forex Forecast By FOREX PLANET
today NATGAS analysis 👆
🟢This Chart includes_ (NATGAS market update)
🟢What is The Next Opportunity on NATGAS Market
🟢how to Enter to the Valid Entry With Assurance Profit
This CHART is For Trader's that Want to Improve Their Technical Analysis Skills and Their Trading By Understanding How To Analyze The Market Using Multiple Timeframes and Understanding The Bigger Picture on the Charts

Natural Gas Oil, Dollar, Silver, Gold Price ForecastNatural Gas stock Bulls PEPPERSTONE:NATGAS Support & Resistance Guide

NATGAS RISKY LONG|
✅NATGAS retested the strong support level of 2.215$
After trading in a local downtrend from some time
Which makes a bullish rebound a likely scenario
With the target being a local resistance above at 2.331$
LONG🚀
✅Like and subscribe to never miss a new idea!✅

Is gas oversold?This channel is not providing individualized trading or investment advice, nor is it a banking service, brokerage service, trading service, investment service or money management
service.
It is just an educated guess.

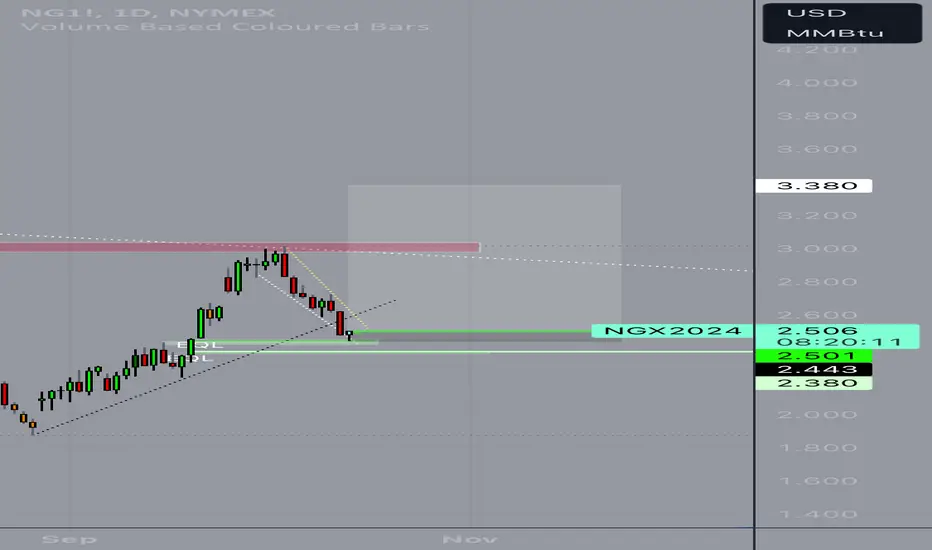
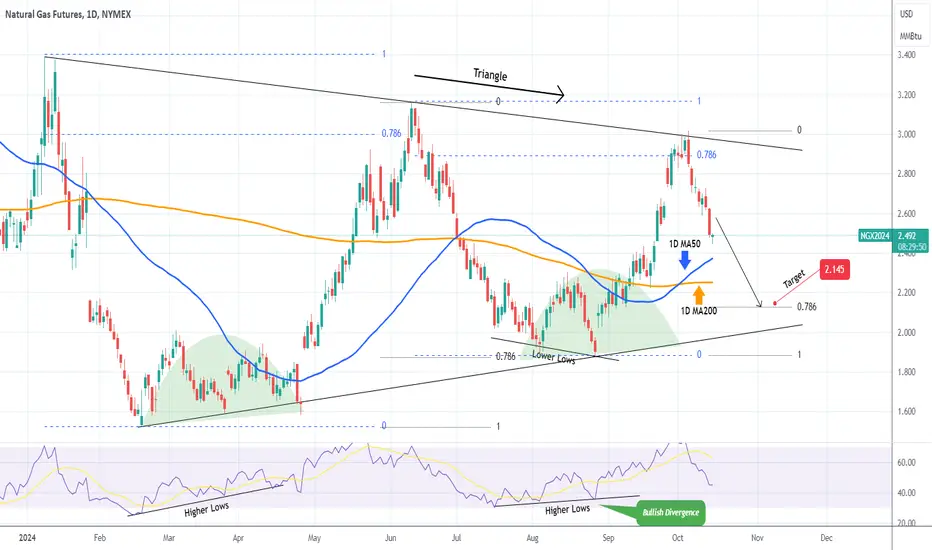
NATURAL GAS on a Bearish Leg. Still a sell signal.Natural Gas (NG1!) gave us an excellent buy opportunity last time (August 29, see chart below) and easily hit our 2.900 Target:
Once it hit the 0.786 Fibonacci retracement level (blue) it formed a Lower High at the top of the Triangle pattern and got rejected. The previous Lower High rejection that started the Bearish Leg, bottomed on the Higher Lows trend-line of the Triangle on the 0.786 Fib (black trend-line).
As a result we remain bearish on NG, targeting 2.145 (0.786 Fib).
-------------------------------------------------------------------------------
** Please LIKE 👍, FOLLOW ✅, SHARE 🙌 and COMMENT ✍ if you enjoy this idea! Also share your ideas and charts in the comments section below! This is best way to keep it relevant, support us, keep the content here free and allow the idea to reach as many people as possible. **
-------------------------------------------------------------------------------
💸💸💸💸💸💸
👇 👇 👇 👇 👇 👇
Natural Gas Trading: Strategies Around Key Levels 15-10-2024Navigating Natural Gas Trading: Strategies Around Key Levels
Natural gas trading can be both exciting and challenging, especially when you have clear reference points like your mid-point and upper/lower levels. In this blog, we'll explore strategies to navigate the current market with a mid-point of 208.50, an upper level of 209.90, and a lower level of 207.10.
Understanding the Key Levels
Mid-Point (208.50): This serves as the equilibrium level in the market. Prices often oscillate around this point, making it a significant area to watch for potential trades.
Upper Level (209.90): This is your resistance level. If prices approach this point, it may indicate an opportunity to go short, anticipating a reversal.
Lower Level (207.10): This serves as your support level. If prices test this area, consider going long, expecting a bounce back.
Trading Strategy
1. Price Action Analysis
Before making any trades, observe the price action around these levels. Watch for candlestick patterns, volume spikes, and other indicators that suggest market sentiment.
If Price Approaches 209.90: Look for signs of resistance. A reversal pattern (like a double top or shooting star) may suggest that the price is likely to drop. Consider placing a short trade with a stop-loss above this level.
If Price Approaches 207.10: Watch for bullish signals. A strong bullish candlestick or a reversal pattern could indicate that the price will bounce back. In this case, consider a long position with a stop-loss just below this level.
2. Risk Management
Always prioritize risk management. Set your stop-loss orders based on your risk tolerance. For example, if you're trading near the upper or lower levels, consider setting your stop-loss a few ticks outside these levels to avoid getting stopped out by minor fluctuations.
3. Monitoring Market Conditions
Natural gas prices can be highly influenced by external factors like weather, supply reports, and geopolitical events. Stay updated on relevant news and reports to make informed trading decisions.
Conclusion
Trading natural gas around key levels requires a solid understanding of price action and market sentiment. By using your mid-point, upper, and lower levels strategically, you can identify potential trade opportunities. Remember to incorporate risk management to protect your capital. Whether the price moves towards the upper level or the lower level, having a plan in place will help you navigate the market with confidence.
Dear Traders,
As you navigate the dynamic world of trading, it’s crucial to remain vigilant about the financial risks involved. Here are key considerations to keep in mind:
Market Volatility: Financial markets, including natural gas, can be highly volatile. Prices can change rapidly due to unexpected news or economic data. Always be prepared for sudden fluctuations.
Leverage Risks: Trading with leverage can amplify both gains and losses. While it allows for larger positions, it also increases the risk of significant financial loss. Use leverage cautiously and understand the implications.
Risk Management: Implementing a solid risk management strategy is essential. Set stop-loss orders to limit potential losses and only risk a small percentage of your capital on any single trade.
Emotional Discipline: Trading can evoke strong emotions, leading to impulsive decisions. Maintain discipline and adhere to your trading plan, even in challenging market conditions.
Market Research: Stay informed about market trends, economic indicators, and geopolitical events that may impact prices. Informed traders make better decisions.
Education and Experience: Continuous learning is vital. Consider practicing with a demo account to hone your skills before committing real capital.
Consult a Financial Advisor: If you're uncertain about your trading strategy or financial situation, seeking advice from a qualified financial advisor can provide valuable insights.
Trading can be rewarding, but it carries inherent risks. Stay informed, manage your risks carefully, and trade responsibly.
Wishing you successful trading!


Natural Gas trading levels 14/10/2024Dear Follower,
Today i posted some trading levels for observation, Kindly observe the price action and price level behaviour.
Do not take any trade,

Natural Gas Oil Dollar Silver Gold Price ForecastNatural Gas stock Bulls PEPPERSTONE:NATGAS Support & Resistance Guide

NATGAS: Long Signal Explained
NATGAS
- Classic bullish setup
- Our team expects bullish continuation
SUGGESTED TRADE:
Swing Trade
Long NATGAS
Entry Point - 2.628
Stop Loss - 2.519
Take Profit - 2.824
Our Risk - 1%
Start protection of your profits from lower levels
❤️ Please, support our work with like & comment! ❤️

NG1: Will We See a Rebound or a Breakout?🔍 Analyzing NG1: We are approaching a critical support level that could determine our next move. Option 1: A rebound from this level could present a strong buying opportunity, indicating a potential uptrend. Option 2: If we break below this support, the next level could act as a key pivot point, prompting a reevaluation of our strategy. I’m closely monitoring for long entry opportunities to capitalize on any bullish reversals. Let's stay sharp!

NATGAS Sellers In Panic! BUY!
My dear followers,
I analysed this chart on NATGAS and concluded the following:
The market is trading on 2.628 pivot level.
Bias - Bullish
Technical Indicators: Both Super Trend & Pivot HL indicate a highly probable Bullish continuation.
Target - 2.778
Safe Stop Loss - 2.529
About Used Indicators:
A super-trend indicator is plotted on either above or below the closing price to signal a buy or sell. The indicator changes color, based on whether or not you should be buying. If the super-trend indicator moves below the closing price, the indicator turns green, and it signals an entry point or points to buy.
———————————
WISH YOU ALL LUCK

Natural Gas Trading Data Overview: 09-10-2024Natural Gas Trading Data Overview:
Buy Above: Investors should consider entering a buy position if the price rises above 229.53. This level indicates potential upward momentum in the market.
Median Price: The median price is set at 228.05, serving as a central reference point. Prices around this level suggest a balanced market, where buying and selling pressures are approximately equal.
Target Price: For those in a buy position, a target price of 231.00 has been established, indicating a potential level for profit-taking.
Sell Below: A sell position may be advisable if the price falls below 226.57. This threshold indicates potential downward movement, suggesting that it may be prudent to exit positions to avoid further losses.
Stop-Loss Target: For risk management, consider a stop-loss target at 225.10 to protect against significant downturns.
NOTE:- Financial Warning: Trading in commodities such as natural gas involves significant risk and may not be suitable for all investors. Prices can be volatile, and past performance is not indicative of future results. It's crucial to conduct thorough research and consider your risk tolerance before engaging in trading activities.

Natural Gas still coiling! breakdown or breakout? Hello Traders
In This Chart NATGAS HOURLY Forex Forecast By FOREX PLANET
today NATGAS analysis 👆
🟢This Chart includes_ (NATGAS market update)
🟢What is The Next Opportunity on NATGAS Market
🟢how to Enter to the Valid Entry With Assurance Profit
This CHART is For Trader's that Want to Improve Their Technical Analysis Skills and Their Trading By Understanding How To Analyze The Market Using Multiple Timeframes and Understanding The Bigger Picture on the Charts

NATURAL GAS OPTION TRADINGIn this chart i have shared all the possible support and resistance levels for trading.

NATURAL GAS: Peak reversal. Strong sell signal.Natural Gas is about to turned neutral on its 1D technical outlook (RSI = 58.678, MACD = 0.175, ADX = 30.811), previously from an overbough state, as it made a standard LH rejection at the top of a year long Triangle pattern. The 1D RSI peaked like all prior LH, the 1D MACD is forming a Bearish Cross (again like all prior LH), so we have a prime sell signal in our hands. Common target on all was the 1.786 Fibonacci extension (TP = 2.165).
## If you like our free content follow our profile to get more daily ideas. ##
## Comments and likes are greatly appreciated. ##


Natural Gas | Oil, Dollar, Silver, Gold Price ForecastNatural Gas stock Bulls PEPPERSTONE:NATGAS Support & Resistance Guide
AMEX:UNG Stock Forecast
AMEX:USO Oil Stock Forecast
TVC:DXY US dollar Stock Forecast
Gold OANDA:XAUUSD Stock Forecast
Silver OANDA:XAGUSD

NATGAS Trading Opportunity! BUY!
My dear subscribers,
NATGAS looks like it will make a good move, and here are the details:
The market is trading on 2.831 pivot level.
Bias - Bullish
Technical Indicators: Both Super Trend & Pivot HL indicate a highly probable Bullish continuation.
Target - 2.922
About Used Indicators:
The average true range (ATR) plays an important role in 'Supertrend' as the indicator uses ATR to calculate its value. The ATR indicator signals the degree of price volatility.
———————————
WISH YOU ALL LUCK

NG1! SHORT FROM RESISTANCE
Hello, Friends!
NG1! uptrend evident from the last 1W green candle makes short trades more risky, but the current set-up targeting 2.420 area still presents a good opportunity for us to sell the pair because the resistance line is nearby and the BB upper band is close which indicates the overbought state of the NG1! pair.
✅LIKE AND COMMENT MY IDEAS✅

NATGAS: Bulls Will Push
Our strategy, polished by years of trial and error has helped us identify what seems to be a great trading opportunity and we are here to share it with you as the time is ripe for us to buy NATGAS.
❤️ Please, support our work with like & comment! ❤️
