NATGAS Potential Long! Buy!
Hello,Traders!
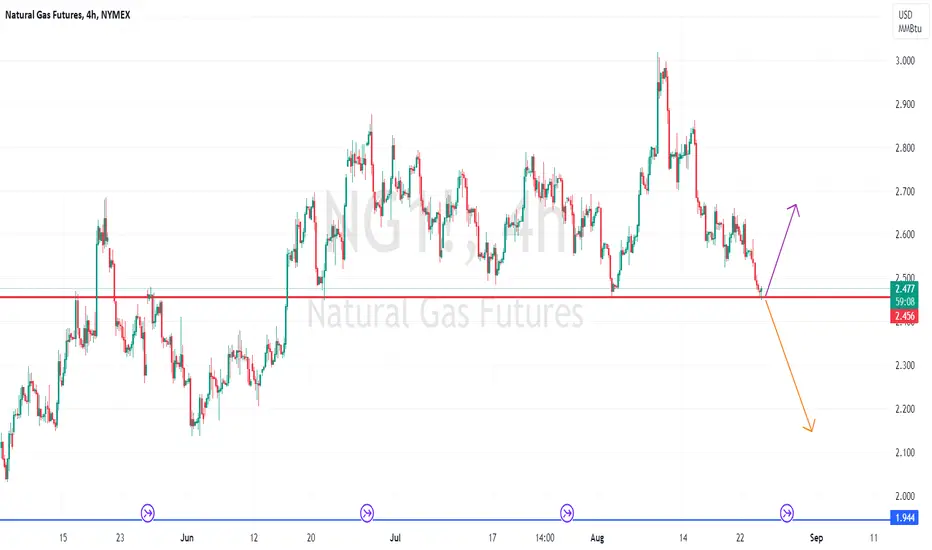
NATGAS is falling down
Again to retest the same
Horizontal support of 2.439$
So after the retest the price
Is likely to make a bullish rebound
Buy!
Like, comment and subscribe to help us grow!
Check out other forecasts below too!
TFN1! trade ideas

Natural Gas DXY Gold Silver Forecastsupport and resistance guide Natural Gas DXY Gold Silver Forecast
and price action analysis

natural gas DXY gold silver forecast Natural Gas Natgas Stock in daily neutral trend
- Natural Gas Natgas needs a daily trend change to uptrend
- Next level for natural gas needs break hold 2.54

The Lengthy Wave 4 BeginsWe don't usually advise trading wave 4's as they can get overly complicated, however upon waiting for what should be the minute wave B we are advising our clients to go long as there is an off chance the minute wave C could be a minor wave 3 if the bottom is in. This is not our primary count though and we believe there is one more intermediate wave down to complete the primary wave C. Going long in our green box around $2.4 should provide us with at least 800 points of movement to $3.2 to complete the minor wave A. As always when trading natural gas you have to be prepared for extreme volatility and manipulation so be sensible with your position sizing.
Here's a closer look at the recent price action -

What do I mean when I use the word GAPS9.4.23 I know that my use of the word gaps Is a typical And that I am looking for something that's complicated than a simple one bar gap. I know that it has to do with my way of looking at the market to define Buyers and sellers. Buyers are at the bottom trying to push the market higher and sellers are at the top trying to push the market lower... and I am looking for how the market Comes back to retest either the buyers or the sellers depending on how the Market's moving. I view this as more than just one single bar that gaps. I even can call a gap one bar Moving higher or lower and there really Is not actually a gap per se.... it's probably more of a range and a continuation in a certain direction and I would think of that as part of the gap. there's probably a much better way to explain the behavior however from my point of view it's an effective way to determine how markets will auction higher and lower with me thinking about failures of markets to test gaps in either direction that gives me more reassurance on how I can come to a better trade decision. One way I define market behavior can take in the bullishness of a swing that is moving higher that would give me the sense that the market was going to continue higher versus A market that is Moving higher but isn't closing where the market gap lower from the Sellers that changes my perspective that the market may go lower If the current bar Starts moving lower before it can come back to touch the bearish gap that was made at an earlier time. The same is true if the Market's moving lower towards the buyers.
What's going on Is that I have a feel for the market as I think it will move and how that will look as I think about buyers versus sellers. And the same thing happens when I use the terminology to bar reversal. this is why I try to show numerous examples in real time as much as possible.If I were younger I would probably have a better way of articulating what I see.

NG1! BEARS WILL DOMINATE THE MARKET|SHORT
Hello,Friends!
It makes sense for us to go short on NG1! right now from the resistance line above with the target of 2.448 because of the confluence of the two strong factors which are the general downtrend on the previous 1W candle and the overbought situation on the lower TF determined by it’s proximity to the upper BB band.
✅LIKE AND COMMENT MY IDEAS✅

Natural Gas Gold Silver DXY forecast- Natural Gas Natgas Stock in daily neutral trend
- Natural Gas Natgas needs a daily trend change to uptrend
- Next level for natural gas needs break above 2.86

NG1! The Target Is DOWN! SELL!
My dear subscribers,
NG1! looks like it will make a good move, and here are the details:
The market is trading on 2.762 pivot level.
Bias - Bearish
My Stop Loss - 2.837
Technical Indicators: Both Super Trend & Pivot HL indicate a highly probable Bearish continuation.
Target - 2.626
About Used Indicators:
The average true range ATR plays an important role in 'Supertrend' as the indicator uses ATR to calculate its value. The ATR indicator signals the degree of price volatility.
———————————
WISH YOU ALL LUCK

NG1! - The heating season is coming up soon.ahead of the heating.
Everyone needs gas.
The war will make gas more expensive.
if you like the idea, please "Like" it. This is the best "Thanks!" for the author 😊 P.S. Always do your own analysis before a trade. Put a stop loss. Fix profits in installments. Withdraw profits in fiat and please yourself and your friends.

Natural Gas DXY Gold SIlver FORECASTNatural Gas DXY Gold SIlver FORECAST
Price action Trend analysis


Natural Gas Gold Silver DXY ForecastNatural Gas Gold Silver DXY Forecast.
Big bounce but give most of it back

NG at multi timeframe support#NATURAL GAS... market is at his multi timeframe supporting level 2.45
its market most important and traded area form last few decades,
again market is at his level and winter season is on his way,
but it should hold this level for again bounce back..
otherwise downside we have next area that is mentioned on chart. 4
trade wisely
good luck
NG sidelines trend will continue...Natural Gas has been very predictive and consistently trading in the range between 2.45 to 2.9(max $3).
- as long as RSI stays above 40 (14day RSI) - NG will be on sidelines with some spikes (based on weekly NG data)
- last 3 month contacts ending at 2.55 to 2.6
- Every month on calendar date 14 to 16th it is touching lows and goes up for next week and comes down by the time monthly contact expires - then recovers for 7 days then falls to lowest of the month.
- 200 MA still holding up and moving up
- 14 and 50 day MA converging and steadying
- as long as smaller triangle formation inside the range (2.45 to 2.89) stays - it won't fall below 2.4 or it wont go beyond 3.2 (max).
- Given factful data NG inventories raises cooling down every week and temp still stay above avg in US and getting close to winter season in Q4 will keep NG prices volatile but stay in sideline ranges.
CONCLUSION : Stick to basics and fundamental principle of technical trading - it is best time in many years to trade NG !

NATGAS Long From Support Cluster! Buy!
Hello,Traders!
NATGAS is trading in an
And the price made a
Retest of the support
Cluster of the rising and
Horizontal support lines
At around 2.450 from
Where we are seeing a
Bullish reaction so
A move up is to be expected
Buy!
Like, comment and subscribe to help us grow!
Check out other forecasts below too!


NG1! Massive Short! SELL!
My dear friends,
Please, find my technical outlook for NG1! below:
The price is coiling around a solid key level - 2.552.
Bias - Bearish
Technical Indicators: Pivot Points High anticipates a potential price reversal.
Super trend shows a clear sell, giving a perfect indicators' convergence.
Goal - 2.514
About Used Indicators:
The pivot point itself is simply the average of the high, low and closing prices from the previous trading day.
———————————
WISH YOU ALL LUCK

Nat bullish?Here is my idea
now waiting for a bounce
these factors may help the trend and bullish reversal
War in Ukraine affecting exports.
heat wave in the United States.
entry 2.43-2.5

NG1!: Long Trade with Entry/SL/TP
NG1!
- Classic bullish setup
- Our team expects bullish continuation
SUGGESTED TRADE:
Swing Trade
Long NG1!
Entry - 2.560
Sl - 2.496
Tp - 2.656
Our Risk - 1%
Start protection of your profits from lower levels.
❤️ Please, support our work with like & comment! ❤️

NG1! Will Explode! BUY!
My dear subscribers ,
I analysed this chart on NG1!, and concluded the following:
The asset is approaching an important pivot point 2.549
Bias - Bullish
Technical Indicators: Pivot Points Low anticipates a potential price reversal.
Super trend shows a clear buy, giving a perfect indicators' convergence.
Goal - 2.640
Safe Stop Loss - 2.499
About Used Indicators:
The average true range ATR plays an important role in 'Supertrend' as the indicator uses ATR to calculate its value. The ATR indicator signals the degree of price volatility.
———————————
WISH YOU ALL LUCK

NG1! Is Bullish! Long!
Take a look at our analysis for NG1!.
Time Frame: 2h
Current Trend: Bullish
Sentiment: Oversold (based on 7-period RSI)
Forecast: Bullish
The market is approaching a significant support area 2.447.
The underlined horizontal cluster clearly indicates a highly probable bullish movement with target 2.551 level.
P.S
Overbought describes a period of time where there has been a significant and consistent upward move in price over a period of time without much pullback.
Like and subscribe and comment my ideas if you enjoy them!

Ascending Triangle (NATGAS) Bullish!The Patience of natural gas buyers is over now!
The price has now reached to Demand zone of 2.44 - 2.48 and forming
Ascending Triangle pattern.
Initial Target will be 3.00
Stops are below 2.30
Trade at your Own Risk!

NATGAS Long From Support! Buy!
Hello,Traders!
NATGAS is going down
But a strong horizontal
Support is ahead at 2.459
From where I believe
We might see a rebound
Buy!
Like, comment and subscribe to help us grow!
Check out other forecasts below too!
