NATGAS: Bullish Continuation is Expected! Here is Why:
Our strategy, polished by years of trial and error has helped us identify what seems to be a great trading opportunity and we are here to share it with you as the time is ripe for us to buy NATGAS.
❤️ Please, support our work with like & comment! ❤️
TFU1! trade ideas

Gas to the bottomI think that in the short term many commodities will fall. Also, there is a triangle in gas.

Natural gas short term long thesis Natural Gas has rotated back to the multi day support after rejecting off the previous day's POC on the TPO chart. It has then bounced off the support with great volume, providing confirmation.
There is a long oppurtunity here @225.7 with a strict stop loss at @223.2 and a target of 231.7.
Trail stop losses as it moves in your favour and take profits accordingly.
Cheers.

NG Short 11/6/2024NG is in a downtrend in daily and 4hr chart. Macro match. Price made LH DT. Placed a short position in HV SZ. Taking half risk because the zone is retest of above zone. Risk= $125. Target= opposing HV DZ.

NG Short 11/6/2024NG is in a downtrend in 4hr chart. Placing a short position in 1hr HV SZ above MA. Risk= $250. Target= 1.1:1.

Options Blueprint Series [Basic]: Ready to Strangle a BreakoutIntroduction: Why Natural Gas is Poised for Volatility
Natural Gas markets are showing signs of a potential volatility surge as recent data from the United States Natural Gas Stocks Change (USNGSC) displays a rare narrowing of the 21-day Bollinger Bands®. This technical setup often precedes sharp market moves, suggesting an upcoming breakout.
Given the importance of fundamental shifts in natural gas inventory data, any unexpected change in USNGSC could significantly impact Natural Gas Futures (NG1!), leading to price movements in either direction. This Options Blueprint Series explores a strategy to capitalize on this anticipated volatility: the Long Strangle Strategy. By setting up positions that profit from sharp directional moves, traders may capture gains regardless of the direction in which the price moves.
Understanding the Long Strangle Strategy
A Long Strangle involves purchasing a call option at a higher strike price and a put option at a lower strike price. This setup allows traders to profit from significant price movements in either direction.
The chosen strategy for this analysis includes:
Expiration: February 25, 2025
Strikes: 2.5 put at 0.28 and 2.7 call at 0.29
This setup is ideal for capturing potential breakouts, with limited risk equal to the total premium paid. Unlike directional trades, a Long Strangle does not require forecasting the direction of the move, only that a substantial price change occurs before expiration.
Technical Analysis with Bollinger Bands®
The 21-day Bollinger Bands® applied to USNGSC have narrowed significantly, often an indicator that the market is building up pressure for a breakout. Historically, this type of setup in fundamental data can drive volatility in Natural Gas Futures.
When the Bollinger Bands® width narrows, it indicates reduced variability and increased potential for data changes, awaiting release. Once volatility resumes, a dramatic shift can occur. This technical insight provides a solid foundation for the Long Strangle Strategy, aligning the timing of options with the potential for amplified price movement in Natural Gas.
Contract Specifications for Natural Gas Futures
To effectively plan and manage risk in this trade, it’s crucial to understand the contract details and margin requirements for Natural Gas Futures (NG).
o Standard Natural Gas Futures Contract (NG):
Minimum Price Fluctuation: $0.001 per MMBtu or $10 per tick.
o Micro Natural Gas Futures Contract (optional alternative for smaller exposure):
Minimum Price Fluctuation: $0.001 per MMBtu or $1.00 per tick.
Margin Requirements
The current margin requirement for a single NG futures contract generally falls around $2,500 but may vary with market conditions. $250 per contract for Micro Natural Gas Futures.
Trade Plan for the Long Strangle
The Long Strangle strategy on Natural Gas involves buying both a put and a call option to capture significant price movements in either direction. Here’s how the trade is set up:
o Expiration: February 25, 2025
o Strikes:
Long 2.5 Put at 0.28 ($2,800)
Long 2.7 Call at 0.29 ($2,900)
o Cost Basis: The total premium paid for the strangle is 0.57 (0.28 + 0.29) = $5,700 per strangle position.
Profit Potential
Profits increase as Natural Gas moves sharply above the 2.7 call strike or below the 2.5 put strike, accounting for the 0.57 premium paid.
With substantial price movement, gains on one option can offset the total premium and yield significant returns.
Risk
Maximum risk is confined to the total premium paid ($5,700), making this a capped-risk trade.
Reward-to-Risk Analysis
Reward potential is substantial to the upside and downside, limited only by the extent of the price move, while risk is capped at the initial premium cost.
Risk Management and Trade Monitoring
Effective risk management is key to successfully executing a Long Strangle strategy, particularly when anticipating heightened volatility in Natural Gas. Here are the critical aspects of managing this trade:
Defined Risk with Prepaid Premiums: The maximum risk is predetermined and limited to the initial premium paid, which helps manage potential losses in volatile markets.
Importance of Position Sizing: Sizing positions appropriately can help balance exposure across a portfolio and reduce excessive risk concentration in a single asset. Using Micro Natural Futures would help to reduce size and risk by a factor of 10 (from $5,700 down to $570 per strangle).
Optional Stop-Loss: As the risk is confined to the premium, no stop-loss orders are required.
Exit Strategies
For a Long Strangle to yield substantial returns, timing the exit is crucial. Here are potential exit scenarios for this strategy:
Profit-Taking Before Expiration: If Natural Gas experiences a significant price swing before the February expiration, consider taking profits which would further reduce the exposure to premium decay.
Holding to Expiration: Alternatively, traders can hold both options to expiration if they anticipate further volatility or an extended price trend.
Continuous Monitoring: The effectiveness of this strategy is closely tied to the persistence of volatility in Natural Gas. Keep an eye on Fundamental Updates in USNGSC as any unexpected changes in natural gas stocks data can lead to sharp price adjustments, increasing the potential for profitability.
When charting futures, the data provided could be delayed. Traders working with the ticker symbols discussed in this idea may prefer to use CME Group real-time data plan on TradingView: www.tradingview.com - This consideration is particularly important for shorter-term traders, whereas it may be less critical for those focused on longer-term trading strategies. Also, some of the calculations and analytics used in this article have been derived using the QuikStrike® tool available on the CME Group website.
General Disclaimer:
The trade ideas presented herein are solely for illustrative purposes forming a part of a case study intended to demonstrate key principles in risk management within the context of the specific market scenarios discussed. These ideas are not to be interpreted as investment recommendations or financial advice. They do not endorse or promote any specific trading strategies, financial products, or services. The information provided is based on data believed to be reliable; however, its accuracy or completeness cannot be guaranteed. Trading in financial markets involves risks, including the potential loss of principal. Each individual should conduct their own research and consult with professional financial advisors before making any investment decisions. The author or publisher of this content bears no responsibility for any actions taken based on the information provided or for any resultant financial or other losses.

NG, prepping for a multi weekly gain come December 2023NG based on monthly data is registering very significant net buy volume at the current price range.
Seller's strength is certainly fading out based on thinning price volatility this past few days / weeks -- as shown on yellow price lines on chart.
NG is currently sitting at a strong major support at 2.0 to 2.5 area, a 1.0 FIB discount level -- this is where most buyers converge.
Initial trend shift has been spotted at the present price range.
Spotted at 2.50
TAYOR
Safeguard capital always.

NG Short 11/3/2024NG is in a downtrend in daily and 4hr chart. Macro match. Made a new low. Placed a short position in 1hr HV SZ below MA because it is a weak market. Risk= $210. Target= 2:1.

Natural Gas | Oil, Dollar, Silver, Gold Price ForecastNatural Gas stock Bulls PEPPERSTONE:NATGAS Support & Resistance Guide
AMEX:USO Oil Stock Forecast
TVC:DXY US dollar Stock Forecast
Gold OANDA:XAUUSD Stock Forecast
Silver OANDA:XAGUSD

Natural Gas still coiling! breakdown or breakout?Hello Traders
In This Chart NATGAS HOURLY Forex Forecast By FOREX PLANET
today NATGAS analysis 👆
🟢This Chart includes_ (NATGAS market update)
🟢What is The Next Opportunity on NATGAS Market
🟢how to Enter to the Valid Entry With Assurance Profit
This CHART is For Trader's that Want to Improve Their Technical Analysis Skills and Their Trading By Understanding How To Analyze The Market Using Multiple Timeframes and Understanding The Bigger Picture on the Charts

Natural Gas Goldmine: Are You Ready to Take the Red Pill?Unlocking the Natural Gas Goldmine: Are You Ready to Take the Red Pill?
In the ever-shifting sands of the financial markets, the truth often lies buried beneath layers of noise and confusion. Today, we delve into the Commitment of Traders (COT) data, a powerful tool that reveals a compelling opportunity in the natural gas market. What if I told you that the signs are aligning for a potential rally? But heed this warning: This does not mean to blindly dive into long positions. Instead, we stand poised, awaiting the moment of a confirmed trend change on the daily timeframe—a moment that transforms potential into profit.
The Market Signals: A Gathering Storm
The data speaks volumes. Commercial traders, the real players in this game, are currently positioned at a major extreme in long holdings—the highest they’ve been in over three years. This is not mere coincidence; it’s a clear indication that something significant is brewing beneath the surface.
As we analyze the net open interest, we observe a phenomenon I like to call the “Bubble Up.” This surge occurs when Commercials outpace Large Speculators, and such dynamics often foreshadow market turning points. The whispers of a shift in power are growing louder, and it’s time to listen closely.
Furthermore, we cannot overlook the increasing open interest during this multi-week decline. But we must ask ourselves: Who is driving this increase? The answer is clear—commercial traders are loading up on long positions. This is a bullish sign, indicating confidence in a market reversal.
The Premium Charge: An Ominous Signal of Change
Adding another layer to our bullish thesis is the current premium charge in the market. We observe that the front months, extending out to April, are trading at a premium compared to later delivery months. This indicates a strong demand for immediate delivery—a sign that the market expects an uptick in prices.
But let us not forget the supplementary indicators that further bolster our long stance: the Price Oscillator Indicator Value (POIV), %R, and the Ultimate Oscillator are all aligning in favor of the bulls. They whisper of impending change, urging us to prepare.
The Seasonal Anomaly: A Moment of Reflection
Yet, as we pursue this truth, we encounter an obstacle. The traditional seasonal patterns suggest a decline until February, but the extreme positioning of commercial long traders casts doubt on this warning. Sometimes, the path to enlightenment requires us to look beyond conventional wisdom.
In this moment, we find ourselves at a crossroads. The insights we’ve gathered are akin to a revelation, a glimpse into the potential future of natural gas.
The Choice is Yours
Will you take the red pill and see how deep the rabbit hole goes? Embrace the knowledge, or remain in the shadows. The markets are waiting, and so is your potential.
Welcome to your awakening.

NATURAL GAS BULLISHA great level to take entry for a bullish breakout as winter is ahead for the northern hemisphere, and the constant geopolitical conflicts are creating an environment for very bullish moves in commodities. I think that in the next 6 months, Natural gas futures will reach easily the 6.5$ level.

NG Short 10/31/2024NG is in a downtrend. Placed a short in confluence HV SZ. Risk= $250. Target= 1:1.1.

NG Long 10/29/2024NG is in a downtrend. Price made a LL DB (divergence). Placed a long position in 1hr HV DZ. Risk= $250. Target= Top of measured move.

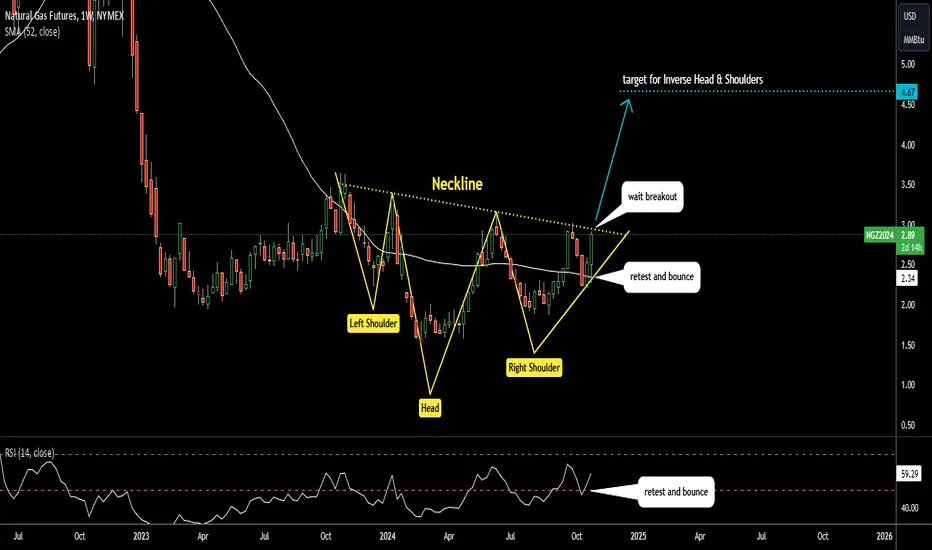
Natural Gas: Inverse Head & Shoulders targets $4.67The series of three valleys with the lowest bottom in between shaped notorious Inverse Head & Shoulders pattern in Natural Gas futures chart.
It's bullish reversal pattern.
Price eyes to break above the Neckline to trigger the pattern.
Target is located at the size of the Head added to the Neckline break point at $4.67.
Invalidation is below the trough of Right Shoulder at $1.88
Indicators support this bullish pattern:
1) RSI retested the midline and bounced up
2) Price retested 52-week MA and bounced up
Govt Intervention, State Acts leads to Supply Shock InflationThesis: The Impact of Government Intervention on Energy Prices: A Decade of Stability Disrupted
This thesis examines the historical trends in natural gas and oil futures prices over the past decade, highlighting the relatively stable energy prices in the absence of geopolitical conflicts. It argues that government interventions, particularly during the COVID-19 pandemic, have led to significant market disruptions and inflationary pressures in energy sectors. The analysis culminates in the observation that recent regulatory promises, exemplified by the Trump rally, signal a potential return to pre-intervention stability.
Introduction
Energy prices have long been influenced by a myriad of factors, including geopolitical events, supply and demand dynamics, and governmental policies. This study focuses on natural gas and oil prices over the last ten years, revealing a pattern of stability interrupted by government actions. By analyzing price data, market responses, and the effects of interventions, we can better understand the relationship between policy and energy economics.
Historical Context
Stable Prices Prior to 2020
Analyzing natural gas and oil prices from 2013 to early 2020 reveals a period of relative stability. Prices fluctuated within a predictable range, driven largely by market fundamentals rather than external shocks.
Impact of COVID-19 Responses
The outbreak of COVID-19 and subsequent government responses led to unprecedented disruptions. Lockdowns and economic contractions caused demand to plummet, resulting in a temporary crash in prices. However, the recovery phase brought about additional complexities, including inflationary pressures as economies reopened and supply chains struggled to adapt.
The 2022-2023 Price Explosion
A notable surge in energy prices occurred from 2022 to early 2023, driven by a combination of pent-up demand, supply chain issues, and ongoing geopolitical tensions. The inflationary trend was exacerbated by the perception of scarcity, largely fueled by government policies rather than fundamental supply issues.
Case Study: The Trump Rally Immediate Market Reactions
Following the Trump rally, where he promised to reduce regulations and increase domestic drilling, both oil and natural gas prices showed a marked decline within hours. This response illustrates the market's sensitivity to perceived shifts in policy that favor increased supply.
Conclusion
This thesis posits that oil and natural gas are abundant resources that, when left to the market without interference, do not contribute significantly to inflation. Instead, it is government intervention, through policies and responses to crises, that creates volatility and price spikes. A return to a more laissez-faire approach could stabilize energy prices and mitigate inflationary pressures, reaffirming the importance of understanding the intricate relationship between energy policy and market behavior.
Future Research Directions
Further investigation into specific regulatory impacts, comparative analyses with other commodities, and the long-term effects of policy shifts on energy independence would provide a more comprehensive understanding of the dynamics at play.

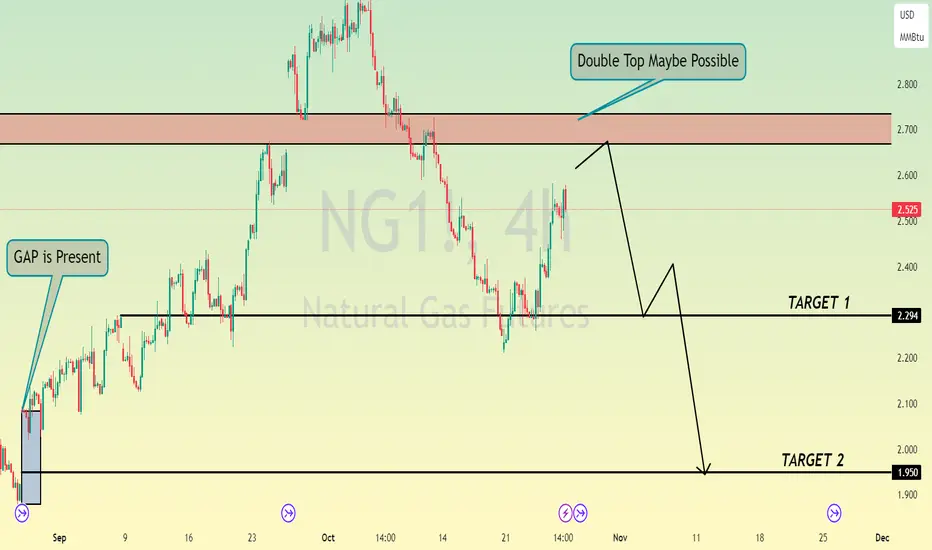
NATGAS The Target Is DOWN! SELL!
My dear followers,
I analysed this chart on NATGAS and concluded the following:
The market is trading on 2.525pivot level.
Bias - Bearish
Technical Indicators: Both Super Trend & Pivot HL indicate a highly probable Bearish continuation.
Target - 2.384
About Used Indicators:
A super-trend indicator is plotted on either above or below the closing price to signal a buy or sell. The indicator changes color, based on whether or not you should be buying. If the super-trend indicator moves below the closing price, the indicator turns green, and it signals an entry point or points to buy.
———————————
WISH YOU ALL LUCK


Smart Money's Secret Signal - Commercials Loading Up on NattySmart Money's Secret Signal: Commercial Traders Are Loading Up on Natural Gas
The natural gas market is displaying compelling signals that suggest a potentially significant bullish trend change on the horizon. Through careful analysis of the Commitment of Traders (COT) report and several other key market indicators, we're seeing a convergence of bullish factors that warrant close attention from market participants.
Commercial Positioning at Multi-Year Extremes
Perhaps the most significant indicator is the current positioning of commercial traders, who are now more long than they've been in over three years. Commercial traders, often considered the "smart money" in commodity markets, tend to have the most comprehensive understanding of supply and demand dynamics. Their extreme long positioning is a powerful bullish signal that shouldn't be ignored.
Open Interest Analysis Confirms Bullish Outlook
Recent weeks have shown a notable increase in open interest concurrent with price declines. This relationship between price and open interest becomes particularly meaningful when we examine who's driving the increase of OI. In this case, the increase in open interest is primarily attributed to commercial traders building long positions – a highly bullish indication that suggests strong hands are accumulating positions at current price levels.
Contrarian Indicators Support the Bullish Case
Several contrarian indicators are aligning to support the bullish thesis:
-Investment advisor sentiment is currently very bearish, which historically has been a reliable contrarian indicator.
-Small speculators are showing extreme short positioning, and this group tends to be wrong at market extremes.
-Natural gas is undervalued when compared to historical relationships with gold and U.S. Treasuries.
Technical Confirmation Signals
The technical picture is adding weight to the bullish case:
-The Average Directional Index (ADX) has triggered a buy signal, dropping below 20 while commercials shifted to extreme long positioning.
-A bullish spread divergence has emerged between front-month and second-month contracts, implying immediate commercial demand for the front month, which is bullish.
-A major weekly bullish divergence has recently confirmed, suggesting potential for significantly higher prices.
Market Structure and Timing
While these indicators paint a compelling picture for higher natural gas prices, it's crucial to understand that this analysis doesn't necessarily call for immediate long positioning. Rather, it suggests that the market is fundamentally "setting up" for an upward move. Traders should wait for confirmation through a daily bullish trend change before considering positions.
The Power of COT Analysis in Trading
The Commitment of Traders report remains one of the most powerful yet underutilized tools in market analysis. Understanding how to interpret this data, particularly when combined with other technical and fundamental indicators, can provide traders with a significant edge in the markets. While many traders focus solely on price action or technical indicators, the COT report offers unique insights into the positioning of the market's most informed participants.
Ready to master the art of COT analysis and gain access to professional-grade market insights? Reach out to us today to take your trading to the next level.
Risk Disclaimer
IMPORTANT: The analysis provided in this article is for educational and informational purposes only and should not be construed as investment advice or a recommendation to buy or sell any security or derivative. Trading natural gas futures, options, or any other financial instruments involves substantial risk of loss and is not suitable for all investors. The market analysis presented here represents the opinion of the author based on the data available at the time of writing, but markets are dynamic and can change rapidly.
Past performance is not indicative of future results. The indicators and analysis techniques discussed in this article may not work in all market conditions and should not be relied upon as the sole basis for any investment decision. Before trading, you should carefully consider your investment objectives, level of experience, and risk appetite. You should only trade with money you can afford to lose.
It is strongly recommended that you conduct your own research and due diligence before making any investment decisions. You should also consult with a licensed financial advisor or broker regarding your specific situation. The author and the trading community mentioned may have positions in the securities discussed and may trade in these securities at any time.

Natural Gas Oil, Dollar, Silver, Gold Price ForecastNatural Gas stock Bulls PEPPERSTONE:NATGAS Support & Resistance Guide
AMEX:USO Oil Stock Forecast
TVC:DXY US dollar Stock Forecast
Gold OANDA:XAUUSD Stock Forecast
Silver OANDA:XAGUSD

Natural Gas still coiling! breakdown or breakout?Hello Traders
In This Chart NATGAS HOURLY Forex Forecast By FOREX PLANET
today NATGAS analysis 👆
🟢This Chart includes_ (NATGAS market update)
🟢What is The Next Opportunity on NATGAS Market
🟢how to Enter to the Valid Entry With Assurance Profit
This CHART is For Trader's that Want to Improve Their Technical Analysis Skills and Their Trading By Understanding How To Analyze The Market Using Multiple Timeframes and Understanding The Bigger Picture on the Charts
Natural Gas is Ready For a Commercially Driven Bull MoveNatural gas is nicely setup for longs if we get a confirmed bullish trend change on the daily.
-Extreme commercial long positioning (most long they've been in the last 3 years) - bullish.
-Investment advisor sentiment very bearish - which is actually bullish.
-Undervalued vs gold & treasuries - bullish.
-ADX under 40 while commercials got extremely long - bullish.
-Bullish spread divergence between front month and next month out - bullish.
-Small specs at extreme in short positioning - bullish.
-True seasonal & some cycles are not supportive of going long, but these are the last things I look at. Enough indicators are supporting longs that I'm not going to worry about this.
-Bullish momentum divergence has triggered on some high timeframes, implying much higher prices are on the cards for Natty. There is also some smaller bullish weekly divergence currently setup (but not confirmed).
Have a good week.
