Coffee is going higher.6 5 25 coffee is going ... it just did a two-bar reversal. Tesla is moving lower and was a good short trade.... It traded down to a support area which was also a 382 retracement. it's possible for Tesla to find some buyers but it's more likely that it will continue our to the 618 retracement pattern that's on the chart. my videos have not been uploading and I'm not quite sure why so this is a test but there is a video.
WBSF2027 trade ideas

#202523 - priceactiontds - weekly update - wti crude oilGood Day and I hope you are well.
comment: Time to be very cautious as a bear and hopeful as a bull. 3 clear legs down and the third could not make a new low. Now the market closed at the weekly high and it’s a fitting place for a reversal. 65 should be the highest bears should allow it. If bulls get follow-through beyond, this is a buy with stop 59.5. The target above 65 is obviously 70 and maybe even the bigger bear trend line around 73.
current market cycle: monthly time frame is a broad bear channel - weekly tf is a bear wedge - daily is a trading range
key levels: 59 - 65
bull case: Bulls got their first daily close above the weekly20 ema since February. Bears tried to get the market below 60 but failed to keep it below - 3 times now since April. Markets will try one thing only so much until they try something else. 65 is the next target which will likely get hit early next week but I expect a bit more sideways until one side clearly gives up. Technically this is a double bottom April/May lows and now a higher low and bulls want to get the major trend reversal.
Invalidation is below 65.5
bear case: Bears are hopeful that the bear wedge is still enough resistance that we test down to 60 but they need a strong reversal below 65 to make it happen and when a weekly bar closes at the very high, it’s probably not a good time to be a bear. Best bears can hope for here is to stay below 65 and continue inside the current range 60-65.
Invalidation is above 65.5
short term: Bullish. I think a bull breakout is much more likely than hitting 60 again. Buying 64.58 with a stop 59.5 is likely a decent trade already. Confirmation for the breakout is 65.5ish.
medium-long term - Update from 2025-06-08: Market finds no acceptance below 60 since 2021 and now we have 3 clear legs down, a higher low and a breakout above prior high with a weekly close at the highs and the weekly 20ema. This is likely as good of a swing long as you can get.

Crude Oil Triangle Breakout Near – Watch 5600 Zone Closely!🛢 CRUDEOIL – Weekly Outlook (4H Timeframe)
Published by: Shalvi Sharma (Power Commodity Trading)
Crude is trading around 5568 and approaching a crucial triangle breakout zone.
⚠️ Key Levels:
Breakout Resistance: 5600 – 5675
Bearish OB Zone: 5675 – 5800
Immediate Support: 5374 (EMA55)
Demand Zone: 5180 – 5270
🔍 Technical Outlook:
Price is compressing within a symmetrical triangle formation.
A breakout above 5600 with volume confirmation could push price towards the 5800 zone.
However, Bearish Order Block (OB) awaits near 5800 — this zone has historically rejected upside moves.
🎯 Possible Scenarios:
Bullish: Break & hold above 5600 → Upside targets: 5675 → 5740 → 5800
Bearish: Rejection at 5600 – 5675 → Downside pullback possible towards 5400 – 5374
📌 Wait for confirmation — breakout with volume will be the key driver.
Stay nimble and trade with defined risk.
#CrudeOil #MCXCrude #PowerOfCommodity #TriangleBreakout #TradingViewIndia #EnergyMarkets #TechnicalAnalysis
Comment below if you think it's bearish?

Crude oil PO3I am watching this PO3 for a while now. The invalidation for this would be below the last low and the technical target is at least the range high.

WTI Crude Oil Stalls At Technical JunctureCrude oil has enjoyed a decent rally in recent weeks thanks to improved sentiment and OPEC+ scaling back production. Yet momentum turned against bulls on Tuesday, despite positive trade talks between the US and China. Today I discuss whether this could be a turning point for oil, or simply a bump in the road.
Matt Simpson, Market Analyst at City Index and Forex.com

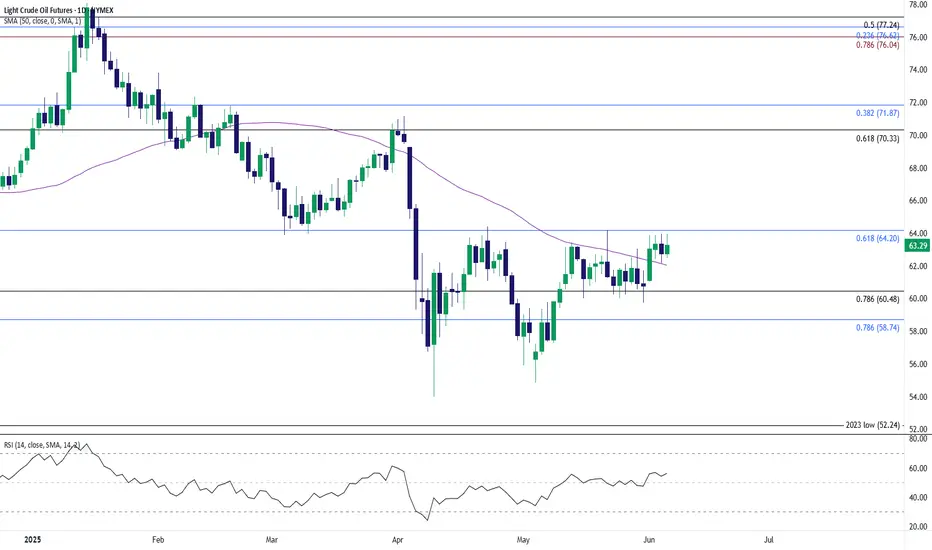
Oil Price on Cusp of Testing May HighThe price of oil is on the cusp of testing the May high ($64.19) after closing above the 50-Day SMA ($62.04) for the first time since April, with a break/close above $64.20 (61.8% Fibonacci retracement) bringing the April high ($71.16) on the radar.
Need a move/close above the $70.30 (61.8% Fibonacci retracement) to $71.90 (38.2% Fibonacci retracement) zone to open up the February high ($73.84), but lack of momentum to push/close above $64.20 (61.8% Fibonacci retracement) may keep the price of oil within the April range.
Failure to defend the advance from the weekly low ($61.06) may push crude back toward the $58.70 (78.6% Fibonacci extension) to $60.50 (78.6% Fibonacci retracement) region, with the next area of interest coming in around the May low ($54.84).
--- Written by David Song, Senior Strategist at FOREX.com

Great "SELL" entry on OIL!1). Inflation came-out lower, which is a Barometer for Oil! 2). Completion of 5 wave sequence! 3). Volume is dropping on the rise! 4). Banks are selling liquidity! 5). Trend is intersecting with 50% Fib. level! 6). Economy is slowing! 7). Checks all the boxes for reversal!

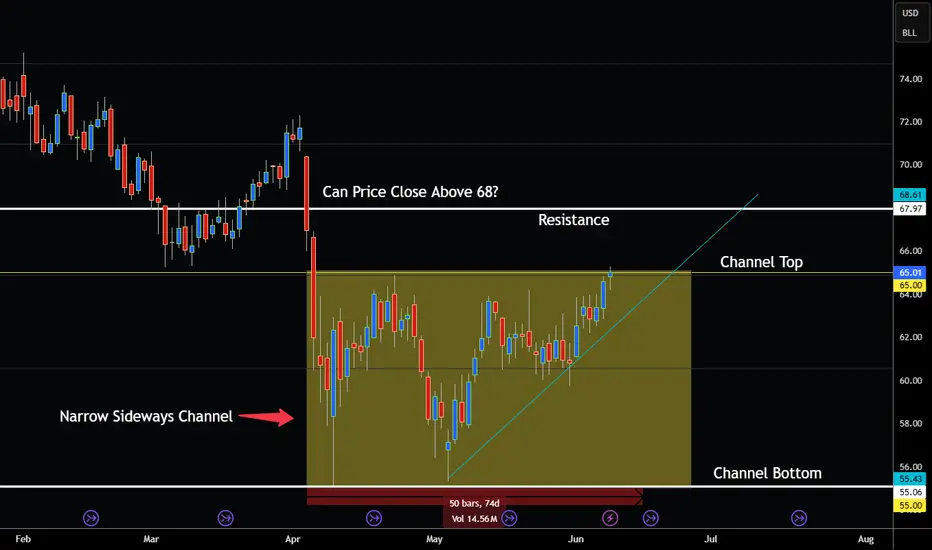
Crude Oil Stuck in Consolidation Watch for Breakout! Hey Traders so today was looking at oil market seems to be stuck in a very powerful pattern called the Narrow Sideways Channel. Basically market has been going no where for the last 75 days stuck between the highs and the lows moving back and forth moving sideways.
Most traders have probably fallen alseep because this market is boring as watching paint dry
just stuck in a range of $55-$65. I guess some traders can trade the range buy at the bottom or the channel sell near the top but imo the best way to trade is wait for a breakout of the channel.
Now if you research historical sideways channels or range markets you will find that almost every market that has ever traded sideways for more than 90 days or more led to an explosive breakout at one point in time!
Finally exciting news! That means the longer it consolidates the better for us traders to catch the breakout.
So if we look closely at the chart we can see right out of the channel top there is resistance ahead at $68. However if market can break above $68 and close above that level at the daily close that would be a serious buy signal for more upside. But don't go by intraday go by the close of the day intraday means nothing imo.
The Daily Close it all that counts!
So watch for breakout above $68 then look to buy on pullback if I does not break above $68 tje we are back to watching paint dry. 😂
Always use Risk Management!
(Just in case your wrong in your analysis most experts recommend never to risk more than 2% of your account equity on any given trade.)
Hope This Helps Your Trading 😃
Clifford
Crude oil-----Sell near 64.00, target 63.00-62.00Crude oil market analysis:
Crude oil is still bearish, and we will continue to sell on rebounds. If it does not break 65.00, it will fluctuate. The general trend is bearish. If it breaks, we will adjust our thinking. Today's crude oil is the key. Will it start to take off before the data? The previous crude oil inventory data did not allow crude oil to break the position. The crude oil fluctuation range is 60.00-65.00. If it breaks this range, we will adjust our thinking on fluctuations.
Operational suggestions
Crude oil-----Sell near 64.00, target 63.00-62.00

Chart Pattern Analysis Of CL1!
There are 4 candles close upon the neckline of a potential bullish triangle pattern,
It seems that another bull run will start here.
I am expecting an accelerate motive wave to touch or break up the nearest higher high at about 72USD.
On the other hand,
If K5 couldn’t close upon K4 to verify the strong bullish momentum,
It is also possible that a short-term consolidation will carry on from K3.
If the following candles successfully retest the downtrend line after a successful break up,
It is also a good place to buy it then.
Long-65.4/Stop-64.4/Target-72

Long On CrudeI hold a strong conviction that in July Oil prices may soar above current trading levels

CL - Crude Oil - long strategyCL - Crude Oil - long strategy
RSI confirmed potential new long opportunities
H&S reversal pattern
There are conditions for inversion

Liquidity Hunt: Crude Oil's Next TargetFenzoFx—Crude Oil remains below the $64.19 resistance level. The Stochastic Oscillator is in overbought territory, and RSI 14 signals bearish divergence, suggesting a possible price dip.
Oil could briefly surpass $64.19 to grab liquidity before facing selling pressure. In this case, a drop toward the $61.72 support level may occur to fill the bullish fair value gap.
However, if Oil stabilizes above $64.19, the bearish outlook becomes invalid.
>>> Trade Crude Oil without swap and low spread at FenzoFx

Crude Oil - Two Scenarios and about Brain PowerPrice retests the L-MLH.
VI. - Price breaks upward, target is the centerline
VII. - Price reverses again, then the target is the 1/4 line, with a subsequent extended target at the red centerline, and possibly even lower at the white dashed warning line.
On a personal note:
I was once again told that the price didn’t do what I had projected.
...yeah, really, that’s how it is §8-)
After over 30 years in the markets and hundreds of coaching sessions, I’m still amazed that people think you can predict price movements as if with a magic crystal ball.
The fact that this belief still persists (even though they don’t understand even the absolute basics of trading) deeply concerns me at the core of my trading soul.
Because this growing irrationality clearly indicates that far too little is being done in terms of education – or humanity might simply go extinct in the next 100 years due to rapidly declining intelligence!
...maybe I should just create a chart and apply a few median lines/forks?
Happy trading to all of you and I pray for those with lesser brain power.

Crude oil futures Trade the range In this video I look at the current range that we are in and I have laid out a plan in the scenario that we break that range to the upside and what we could possibly expect .
I have given some reaction zones where I anticipate price to react when we reach there .
I have used Fibonacci, volume profile, and vwap in this video .
Thankyou for your support

Oil Bears May Look to PounceCrude oil futures have teetered for weeks, and the bears may be getting ready to pounce.
The first pattern on today’s chart is the sharp drop in early April after President Trump announced higher-than-expected tariffs. CL1! quickly broke the 65.27 level where it bounced in September and early March. Prices have stayed there since, which may reflect a lack of buying interest.
Second is the recent consolidation zone above the May 8 high of 60.29. Could a close below that level trigger selling?
Third, prices have remained consistently below their 50-day simple moving average since early February. That may suggest the intermediate-term trend is bearish.
Finally, the 8-day exponential moving average (EMA) recently crossed below the 21-day EMA. That may suggest the short-term trend is getting bearish.
These patterns could be important to watch heading into this weekend’s OPEC+ meeting.
Check out TradingView's The Leap competition sponsored by TradeStation.
TradeStation has, for decades, advanced the trading industry, providing access to stocks, options and futures. If you're born to trade, we could be for you. See our Overview for more.
Past performance, whether actual or indicated by historical tests of strategies, is no guarantee of future performance or success. There is a possibility that you may sustain a loss equal to or greater than your entire investment regardless of which asset class you trade (equities, options or futures); therefore, you should not invest or risk money that you cannot afford to lose. Online trading is not suitable for all investors. View the document titled Characteristics and Risks of Standardized Options at www.TradeStation.com . Before trading any asset class, customers must read the relevant risk disclosure statements on www.TradeStation.com . System access and trade placement and execution may be delayed or fail due to market volatility and volume, quote delays, system and software errors, Internet traffic, outages and other factors.
Securities and futures trading is offered to self-directed customers by TradeStation Securities, Inc., a broker-dealer registered with the Securities and Exchange Commission and a futures commission merchant licensed with the Commodity Futures Trading Commission). TradeStation Securities is a member of the Financial Industry Regulatory Authority, the National Futures Association, and a number of exchanges.
TradeStation Securities, Inc. and TradeStation Technologies, Inc. are each wholly owned subsidiaries of TradeStation Group, Inc., both operating, and providing products and services, under the TradeStation brand and trademark. When applying for, or purchasing, accounts, subscriptions, products and services, it is important that you know which company you will be dealing with. Visit www.TradeStation.com for further important information explaining what this means.

CL Trade Idea – Waiting for Buy Reaction in Demand Zonem currently watching Crude Oil Futures (CL) closely.
Price has broken below my EMA and is heading toward the demand zone marked in green . I’m not rushing in — waiting patiently for price to reach that zone and give me a reaction.
📌 What I'm Looking For:
A clear bullish reaction within the zone.
Volume confirmation showing buyer intent.
Order flow alignment (buyers stepping in, absorption, or reversal signs on the tape).
If all three line up, I’ll look for a long entry from that area targeting previous resistance levels.
Let’s see if buyers show up at the right spot. No confirmation = no trade.

Crude Oil Going Higher - TA and fundamentals aligneThe 0-5 count is not over yet.
Sudo 4 and 5 are still lurking.
It's good to see how the Medianline-Set cought the Highs of the swings. Likewise we can see the subborn rejection at the Center-Line at P3.
I will not trade CL to the short side, until it's clear that P4 is engraved in this Chart. Until then, I maybe shoot for some intraday or dayli trades in Crude.
Economy Facts that support a rise, up to P4:
Crude oil refineries typically switch to producing more gasoline (fuel for cars) in the spring, particularly around March to April in the United States and other northern hemisphere countries.
Seasonal demand: Warmer months mean more driving and vacation travel, increasing gasoline demand.
Regulatory change: Refineries begin producing summer-grade gasoline, which has lower volatility and is required by environmental regulations (especially in the U.S. under EPA rules).
The switch to summer-grade gasoline must be completed by June 1st for retail and May 1st for terminals and pipelines in the U.S.
In Summary:
- Switch begins: March–April
- Completed by: May (terminals), June (retail)
- This seasonal shift is often called the "refinery maintenance season" or "spring blend switch."

CRUDE OIL: 12 JUNE, 2025 - BOTTOM AND TAKE OFF!?Conclusion: The ABC)-orange correction may have just completed, and a five-wave is pushing much higher, targeting the nearest target at the high around 94.19 or 130.50.
Details: Since the high of 130.50, a decline with A,B,C)-orange has unfolded as a Zigzag. I counted a five-wave within the A)-orange, and a triangle within the B)-orange, and finally the C)-orange has completed as a five-wave. So, perhaps that ABC has ended with convincing evidence.
So crude oil is likely to rise in the medium term, even though the alternative scenarios with relatively high probability in another development also show increasing bullish weight. And it is aiming for the nearest target at 94.19. While price must always remain above 55.30 to keep the Bullish market view valid.

WTI(20250612)Today's AnalysisMarket news:
① The EU hopes that the trade negotiations will be extended beyond the suspension period set by Trump. ② Bessant: As long as "sincerity" is shown in the negotiations, the Trump administration is willing to extend the current 90-day tariff suspension period beyond July 9. ③ Trump will hold multiple bilateral talks during the G7 summit. ④ The total customs revenue of the United States in May reached a record high of US$23 billion, an increase of nearly four times year-on-year. ⑤ Lutnick: One deal after another will be reached.
Technical analysis:
Today's buying and selling boundaries:
66.02
Support and resistance levels:
69.56
68.23
67.38
64.66
63.80
62.47
Trading strategy:
If the price breaks through 67.38, consider buying in, and the first target price is 68.23
If the price breaks through 66.02, consider selling in, and the first target price is 64.66

Great "SELL" entry on OIL!1). Inflation came-out lower, which is a Barometer for Oil! 2). Completion of 5 wave sequence! 3). Volume is dropping on the rise! 4). Banks are selling liquidity! 5). Trend is intersecting with 50% Fib. level! 6). Economy is slowing! 7). Checks all the boxes for reversal!

Crude Oil ShortsDaily imbalance resting below, looking for price to respect daily rejection block. H6 SIBI + H1 Range. Looking simply for OTE Retracement before selling off. will look for M5 confirmation entry too.
