WTI(20250618)Today's AnalysisMarket news:
World Gold Council: 95% of central banks expect gold reserves to rise in the next 12 months.
Technical analysis:
Today's buying and selling boundaries:
72.29
Support and resistance levels:
76.53
74.95
73.92
70.66
69.63
68.04
Trading strategy:
If the price breaks through 73.92, consider buying, the first target price is 74.95
If the price breaks through 72.29, consider selling, the first target price is 70.66
WBS1! trade ideas

Geopolitics (Iran/Israel), 6 relevant risk barometersGeopolitics is in the spotlight this week, along with the FED's monetary policy decision. Geopolitical news is covered by the general media, so there's no need here to repeat information that's accessible to everyone. We therefore propose to review our selection of stock market barometers which, in our opinion, best measure the intensity of geopolitical risk.
1) Oil and natural gas prices
Naturally, oil price trends are the main barometer of the geopolitical risk of the current confrontation between Israel and Iran. Although Iran accounts for just 3% of the world's oil supply, the region itself represents 20%, and above all there is a risk of closure of the Strait of Hormuz, through which 25% of the world's oil supply passes. Technical analysis of the oil price is therefore the primary tool for measuring the intensity of current geopolitical tensions. The price of oil recently returned to the former technical support of $65, but there is no major bullish technical signal as long as the price of US crude oil remains below resistance at $80. We must therefore keep a close eye on the $80 threshold for US oil.
2) The trend of the S&P 500 index, the benchmark of Western finance
The equity market is the second barometer of geopolitical risk that we offer. The most important thing is to select the stock indices that best represent the perception of geopolitical tensions. We believe that the S&P 500 future contract does this job well, as it is the most widely traded stock market futures index in terms of volume by global high finance.
A few days ago, we published a detailed graphical analysis of the S&P500 index, which you can consult by clicking on the image below.
3) Trends on the main stock markets in the Near and Middle East
Equity markets in the Near and Middle East are excellent indicators of the current perception of geopolitical tensions between Iran and Israel. We suggest you take a look at the Saudi Arabian Stock Exchange (Tadawul), the region's largest in terms of market capitalization. Naturally, you should also follow the trend of the Tel Aviv Stock Exchange's flagship index, the TA 35, as well as that of the Egyptian stock market. These markets have the advantage of being open on Sundays, and are often a good early indicator of trends in Asia and Europe for Monday morning.
4) The trend of the US dollar (DXY) on the foreign exchange market (Forex) and of gold on the commodities market
On the floating foreign exchange market (FX), it is the US dollar that plays to the full its safe-haven aspect. In the event of geopolitical tensions spiraling out of control, it would make a strong bullish reversal. This week, however, the US dollar will be under the influence of the FED.
So it's best to trust gold's trend as a barometer of geopolitical risk. Geopolitics is not necessarily the dominant fundamental factor, but rather the dynamics of interest rates and the US dollar.
5) The TRUFLATION trend
If current geopolitical tensions were to become a major global shock, international trade would be disrupted, and transport difficulties would lead to a sharp rise in prices, particularly for raw materials and industrial goods. This potential price rise would then be rapidly reflected in TRUFLATION, the benchmark for real-time price dynamics in the USA.
DISCLAIMER:
This content is intended for individuals who are familiar with financial markets and instruments and is for information purposes only. The presented idea (including market commentary, market data and observations) is not a work product of any research department of Swissquote or its affiliates. This material is intended to highlight market action and does not constitute investment, legal or tax advice. If you are a retail investor or lack experience in trading complex financial products, it is advisable to seek professional advice from licensed advisor before making any financial decisions.
This content is not intended to manipulate the market or encourage any specific financial behavior.
Swissquote makes no representation or warranty as to the quality, completeness, accuracy, comprehensiveness or non-infringement of such content. The views expressed are those of the consultant and are provided for educational purposes only. Any information provided relating to a product or market should not be construed as recommending an investment strategy or transaction. Past performance is not a guarantee of future results.
Swissquote and its employees and representatives shall in no event be held liable for any damages or losses arising directly or indirectly from decisions made on the basis of this content.
The use of any third-party brands or trademarks is for information only and does not imply endorsement by Swissquote, or that the trademark owner has authorised Swissquote to promote its products or services.
Swissquote is the marketing brand for the activities of Swissquote Bank Ltd (Switzerland) regulated by FINMA, Swissquote Capital Markets Limited regulated by CySEC (Cyprus), Swissquote Bank Europe SA (Luxembourg) regulated by the CSSF, Swissquote Ltd (UK) regulated by the FCA, Swissquote Financial Services (Malta) Ltd regulated by the Malta Financial Services Authority, Swissquote MEA Ltd. (UAE) regulated by the Dubai Financial Services Authority, Swissquote Pte Ltd (Singapore) regulated by the Monetary Authority of Singapore, Swissquote Asia Limited (Hong Kong) licensed by the Hong Kong Securities and Futures Commission (SFC) and Swissquote South Africa (Pty) Ltd supervised by the FSCA.
Products and services of Swissquote are only intended for those permitted to receive them under local law.
All investments carry a degree of risk. The risk of loss in trading or holding financial instruments can be substantial. The value of financial instruments, including but not limited to stocks, bonds, cryptocurrencies, and other assets, can fluctuate both upwards and downwards. There is a significant risk of financial loss when buying, selling, holding, staking, or investing in these instruments. SQBE makes no recommendations regarding any specific investment, transaction, or the use of any particular investment strategy.
CFDs are complex instruments and come with a high risk of losing money rapidly due to leverage. The vast majority of retail client accounts suffer capital losses when trading in CFDs. You should consider whether you understand how CFDs work and whether you can afford to take the high risk of losing your money.
Digital Assets are unregulated in most countries and consumer protection rules may not apply. As highly volatile speculative investments, Digital Assets are not suitable for investors without a high-risk tolerance. Make sure you understand each Digital Asset before you trade.
Cryptocurrencies are not considered legal tender in some jurisdictions and are subject to regulatory uncertainties.
The use of Internet-based systems can involve high risks, including, but not limited to, fraud, cyber-attacks, network and communication failures, as well as identity theft and phishing attacks related to crypto-assets.

The Hidden Power of Median Price: A Recent Oil Market Case StudyIntroduction
In the world of trading, most market participants focus on popular patterns and oscillators, often missing the true “magnet” zones that drive price action. A recent move in Crude Oil (CL) perfectly illustrates how the prior year’s median price (PYM) can act as a powerful, objective key level—one that offers traders an informational edge when recognized and used properly.
Case Study: Oil’s Rally to the Prior Year Median
What Happened?
• Catalyst: Crude Oil (CL) surged several dollars overnight due to escalating geopolitical tensions and the risk of war in the Middle East.
• Key Level Test: Instead of stalling at arbitrary points, price rallied directly to the prior year’s median price—a level rarely plotted by standard indicators.
• Market Reaction: Upon reaching this PYM, oil rejected sharply not once, but twice in consecutive sessions, creating what many would recognize as a double top.
• Missed Context: While most traders saw only the double top pattern, those aware of the PYM understood the deeper reason for this reversal, adding conviction to their trade ideas.
Why the Median Price Matters
• Objective Anchor: The median price of the prior year is a statistically robust, non-arbitrary level that reflects the “center of gravity” for a full year’s worth of price action.
• Institutional Awareness: Professionals and trading algorithms often use these levels as reference points for liquidity and mean reversion, even if retail traders overlook them.
• Trade Conviction: When a double top or reversal forms at a prior year’s median price, it transforms a generic pattern into a high-conviction setup, providing a clear, data-driven reason for price to reverse or stall.
Data Snapshot: CL Price Action (June 2025)
Date High Low Close Event/Reaction
June 12, 2025 $77.52 $69.50 $73.96 Sharp rally to PYM, first rejection
June 14, 2025 $74.02 $71.48 $72.98 Second push, another rejection
June 15, 2025 $74.22 $73.19 $73.69 Double top confirmed
The $74–$77 area aligns with the 2024 median/average price for WTI crude oil, reinforcing its significance as a magnet and reversal zone.
Lessons for Traders
• Beyond Oscillators: Oscillators and generic chart patterns often lack context and can lead to false signals. Key levels like the median price explain why price reverses, not just where patterns form.
• Edge Through Awareness: Plotting prior year medians and other session-based key levels can turn ordinary setups into high-probability trades by revealing hidden order flow and institutional logic.
• Professional Mindset: Treating these levels as “market memory” aligns your approach with how professionals view the market, offering a real edge over retail-centric tools.
Conclusion
The recent oil rally and rejection at the prior year’s median price is a compelling demonstration of the power of objective, price-based key levels. While most traders saw only a double top, those aware of the PYM had a clear, data-driven reason for heightened conviction and precise execution. Incorporating such levels into your trading toolkit can provide a true informational edge—one that most indicator vendors and platforms still ignore.
Ready to take your trading to the next level? Start plotting median price levels and see the difference for yourself!

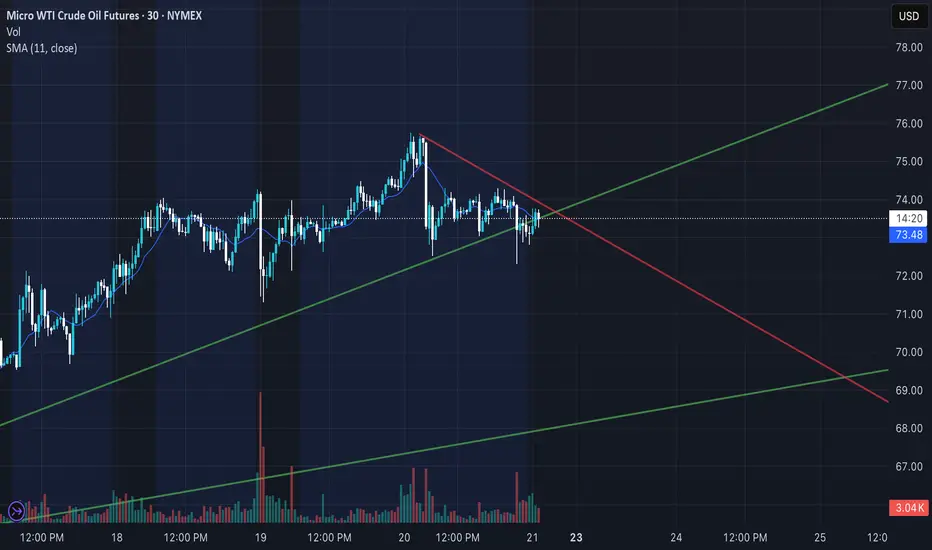
Crude Oil Weekly OutlookNYMEX:CL1! NYMEX:MCL1!
With Nasdaq futures hitting all-time highs, our attention now turns to Crude Oil, which has seen a sharp pullback over the past week.
All-time highs in equity indices present a unique challenge:
There are no historical reference points—no prior price or volume data to lean against. Traders typically turn to tools like Fibonacci extensions, measured moves, or rely on market-generated information and emerging intraday levels before making decisions.
What Has the Market Done?
Crude Oil Futures (CL) posted a record drop last week, falling sharply from a Sunday open high of $78.40 to a Monday close low of $64.38—a $14.02 decline.
This sharp sell-off followed developments suggesting a potential Iran–Israel ceasefire and the end of a two-week conflict, prompting markets to rapidly unwind the geopolitical risk premium.
What is it trying to do?
CL Futures have since consolidated around the 2025 mid-range. The market appears to be in a balancing phase, digesting the removal of war-related premiums and recalibrating based on fundamentals.
How Good of a Job Is It Doing?
Having effectively priced out war risk, the market is now refocusing on fundamentals.
The global demand outlook is improving, driven in part by progress in trade deals.
OPEC’s June Monthly Oil Market Report (MOMR) forecasts global oil demand growth of 1.3 mb/d for 2025.
This transition from headline risk to fundamental drivers indicates market maturity and resilience, albeit within a still-volatile regime.
What Is More Likely to Happen From Here?
Today marks the final trading day of the month, and seasonal demand will become increasingly relevant.
Summer weather and travel activity are expected to drive demand for jet fuel and gasoline.
These seasonal tailwinds, if sustained, could help stabilize price action around key technical zones.
Key Levels:
yOpen: 67.65
pHi: 66.09
pIB Hi: 66
2025 mid-range: 65.39
pLow: 64.80
Overnight Low: 64.55
Naked VPOC: 64.50
Scenario 1: Continued Consolidation (Balance Holds)
Crude oil maintains range-bound behavior.
Strategy: “Outside-in” trading—fade moves at range extremes until new directional information emerges.
Scenario 2: Break from Balance
If directional conviction builds, price could break the current consolidation.
Upside target: Yearly open near $67.65.
Downside risk: March 2025 low if $64.40 fails.
All intraday levels noted above should be monitored for structure and participation.

CL checks all boxes for a deeper drop towards $60!1). Banks are Selling! 2). Volume is dropping!). 3). Sequence needs the wave 5 drop!

Crudeoil is near a strong support one can buy with a tight stopCrudeoil is near a strong support one can buy with a tight stop

CL 4 hr. maxing-out on wave 4!1). SELL @ 66.97 with a tight stop! 2). Wave 4 is likely over! 3). 3). Sentiment is "BEARISH"! 4). Volume has petered out! 5). Banks are selling!!

Geopolitical tensions is making oil fun to tradeFor the unexperienced traders, be very careful trading NYSE:CL , you can get caught anytime wether you are long or short right or wrong.
Nevertheless, if you follow my LIS, you can have a clear picture of where oil is heading to.
Right now, oil is set up as bearish but it can change in a matter of a bomb. Jokes aside, the LIS stands at 67.8. So below still bearish, above turn bullish.

OIL Bullish BiasCurrently sitting on my hands but closely watching oil, especially after Iran & Israel
Consolidation Protocol active. Need to see external range taken. I will not trade inside this range. Favoring longs.
Think accumulation, manipulation, distribution. Right now its in the accumulation phase. Manipulation phase is next. Preferably sweeping external low first then distribution higher to bsl.
Relative equal highs / LRLR at 114.29 first long term target.
Final target are the inefficiencies at 130 - 150.

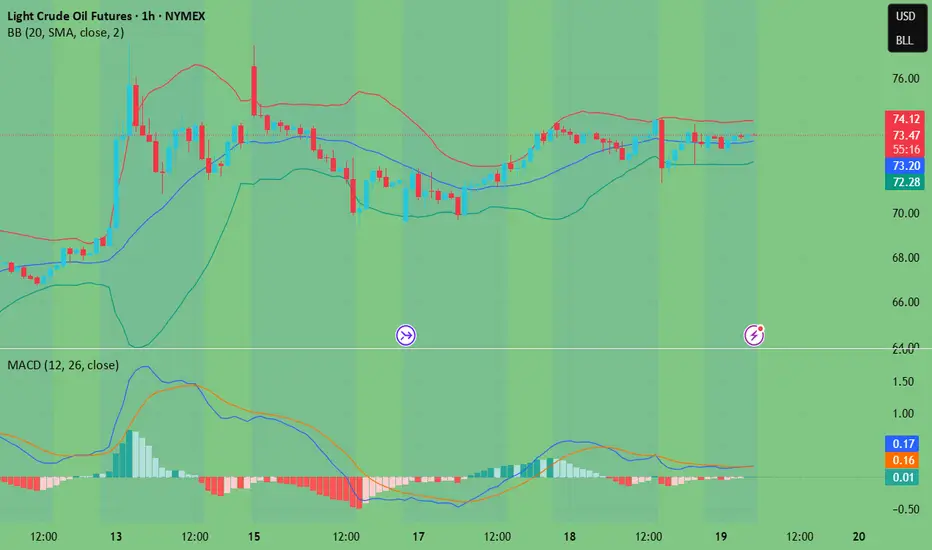
Oil Price: Breakout or Fakeout? Watch This Zone Closely Technical Overview:
The current price action is testing the upper boundary of a descending wedge, a bullish reversal pattern. The recent strong green candle indicates a potential breakout attempt, yet price is hovering near a critical resistance level at $74.20 (Fib 0.5).
Key levels from the Fibonacci retracement are:
🔼 Resistance at $74.20 (0.5), then $78.16 (0.618)
🧲 Local support at $69.78 (0.382)
🛡️ Strong demand zone near $63.81 (0.236) if rejection occurs
Structure + Patterns:
Price has been compressing inside a falling wedge, which statistically resolves to the upside.
The breakout candle broke above the 20 EMA and touched the upper wedge resistance — signaling a decision point.
Volume is rising on bullish candles — initial confirmation of buyer interest, but not yet decisive.
Scenarios to Watch
Bullish Case:
Break and close above $74.20 on higher volume → likely move toward $78–$86 resistance zone.
Confirmation of wedge breakout could trigger trend reversal, aligning with bullish fib levels.
Momentum could accelerate if macro factors support demand (see geopolitics below).
Bearish Case:
Failure to close above $74.20 = fakeout risk → price may reject down to $69.78 or even retest $63.81.
Bearish rejection wick on the daily/4H would be an early signal.
Macro & Geopolitical Factors to Monitor:
Middle East Tensions: Any escalation (especially around Iran or shipping lanes) could spike oil due to supply fears.
US Strategic Reserves & Elections: Moves to refill reserves or control inflation could support demand.
China Demand Recovery: Data showing improved industrial output or stimulus from PBoC may strengthen global oil outlook.
Final Thoughts:
Price is at a pivot zone — breaking this wedge with strength could shift the short-to-midterm trend. Until then, this remains a "show me" breakout . Watch how the next 1–2 weekly candles close around the $74–$75 area to confirm direction.

Crude Oil Testing $75 Resistance with Key Price Movements Targets:
- T1 = $78.00
- T2 = $80.50
Stop Levels:
- S1 = $74.00
- S2 = $72.50
**Wisdom of Professional Traders:**
This analysis synthesizes insights from thousands of professional traders and market experts, leveraging collective intelligence to identify high-probability trade setups. The wisdom of crowds principle suggests that aggregated market perspectives from experienced professionals often outperform individual forecasts, reducing cognitive biases and highlighting consensus opportunities in Crude Oil.
**Key Insights:**
Crude Oil has been holding strong amid mixed macroeconomic data, with traders noting resilience around the $75 price level acting as a key support. Recent production cuts by OPEC+ have further tightened supply, providing support for bullish sentiment. Dollar weakness also boosts commodity prices, as global markets eye policy decisions from central banks.
Additionally, technical indicators suggest upward momentum is building. RSI levels are nearing overbought zones but remain favorable for a continued upward push. Moving averages show upward crossover patterns, signaling strong bullish possibilities.
**Recent Performance:**
Crude Oil has seen fluctuating performance over the last month, with prices rebounding from lows of $72 and climbing steadily to current levels. A temporary pullback earlier in the week was followed by renewed buying interest, demonstrating the strength of underlying bullish sentiment despite volatile macroeconomic conditions.
**Expert Analysis:**
Industry analysts highlight that geopolitical risks and tightening supply conditions could lead to further upward price pressure. The $75.13 level corresponds to a critical juncture that traders are closely watching for breakouts. A breach above this level would likely signal further upside momentum, potentially reaching the $80 mark as broader optimism prevails.
**News Impact:**
Recent news surrounding OPEC+ production strategies and lower inventories in key storage hubs like Cushing have contributed to bullish sentiment. Simultaneously, macroeconomic factors — including U.S. inflation data and Federal Reserve remarks — are influencing crude oil’s directional moves, albeit in a secondary role.
**Trading Recommendation:**
A bullish position is recommended on Crude Oil as it continues to show potential for a breakout above current resistance levels. Traders should aim for targets of $78.00 and $80.50, using stop-loss orders at $74.00 and $72.50 to mitigate downside risks. Current technical setups and macroeconomic signals support upward momentum, making this a favorable opportunity for disciplined trading.


MCL to $71.50Oil has just crossed a strong upwards trend line with 4 touch points indicating a move to the downside. Price target $71.50 in the short term.
Because of the situation in the middle east at the current moment, price has the potential to move back towards the previous swing high. If price closes above the opposite trend line I will cut all of my position.

WTI(20250620)Today's AnalysisMarket news:
The Bank of England kept interest rates unchanged at 4.25%, and the voting ratio showed that internal differences were increasing. Traders expect the bank to cut interest rates by another 50 basis points this year.
Technical analysis:
Today's buying and selling boundaries:
74.33
Support and resistance levels:
77.40
76.25
75.51
73.15
72.40
71.26
Trading strategy:
If it breaks through 73.15, consider buying, and the first target price is 75.00
If it breaks through 72.40, consider selling, and the first target price is 71.26

Crude oil------Buy around 74.00, target 75.00-76.50Crude oil market analysis:
Crude oil has been strong recently, and it is also because of the support of fundamentals and inventory data that crude oil has begun to strengthen. Today's idea is still bullish on crude oil. Continue to buy after the retracement. The daily moving average has begun to diverge. The small support for buying has reached around 72.00. The suppression position is around 74.00 and 77.60. I estimate that it will form a small shock and then break through and rise again. If it does not break 70.00, it is still strong. Buy crude oil around 74.00 today.
Fundamental analysis:
The interest rate results announced by the Federal Reserve last night remained unchanged at 4.25%-4.50%, and the fourth consecutive meeting remained unchanged, which was in line with market expectations. The uncertainty of the United States about the future has led to no major changes in monetary policy in the near future.
Operational suggestions
Crude oil------Buy around 74.00, target 75.00-76.50

Crude Oil Pushing Into Supply Zone — Watching for Breakout or ReCrude Oil (CL) has been trending strongly bullish today — price is now testing the red supply zone overhead.
I am watching very closely:
✅ If buyers can break this zone with strong momentum, I will look for a breakout continuation trade to ride the trend higher.
✅ If buyers get trapped and order flow shifts bearish inside this zone, I will look for a short opportunity targeting the green demand zone below.
Important: I always study buyer and seller behavior inside the zones first — no blind trades! I also use order flow tools to catch traps and spot aggressive traders on the wrong side of the move.
Patience first — waiting for the zone to tell me what to do. ✅

WTI(20250619)Today's AnalysisMarket news:
Fed's June meeting - kept interest rates unchanged for the fourth time in a row, and the dot plot showed two rate cuts this year, but the number of officials who expected no rate cuts this year rose to 7, and the rate cut expectations for next year were cut to 1. Powell continued to call for uncertainty, and the current economic situation is suitable for waiting and watching. He also expects tariff-driven inflation to rise in the coming months.
Technical analysis:
Today's buying and selling boundaries:
72.69
Support and resistance levels:
75.60
74.51
73.81
71.58
70.88
69.79
Trading strategy:
Upward breakthrough of 73.81, consider entering the market to buy, the first target price is 74.51
Downward breakthrough of 72.69, consider entering the market to sell, the first target price is 71.58
Crude oil---Buy near 72.00, target 72.90-74.90Oil market analysis:
Recently, the daily crude oil line has started to pull up, and buying has begun to rise. The retracement is our opportunity to buy again. The moving average support of the daily crude oil line has begun to move up, and the pattern has reached around 69.60. Today's idea is to buy at 72.00. The pattern is difficult to see, just buy repeatedly. The fight between Iran and Israel is a great support for crude oil. In addition, there is EIA crude oil inventory data today.
Fundamental analysis:
Previously, we have been paying attention to geopolitical factors in the fundamentals. Indeed, the situation in the Middle East has also changed the way of gold and crude oil. Today we focus on the monetary policy of the Federal Reserve, and Chairman Powell's speech during the US trading time.
Operational suggestions:
Crude oil---Buy near 72.00, target 72.90-74.90


CL1! barking bearish trend. As observed in the weekly time frame, CL1 has broken a bearish trend that emerged after June 2022. Currently, CL1 exhibits bullish sentiment, and based on global news, it is likely to continue its upward trajectory.

ID: 2025 - 0146.16.2025
Trade #14 of 2025 executed.
Trade entry at 60 DTE (days to expiration).
BULLISH options trade executed on Crude Oil. Once price level of $75.00 gets taken out, this trade will get adjusted to secure a risk-free trade. Targets will be 100% ROI based upon this being a balanced bullish butterfly construct.
Defined risk
Defined reward
Happy Trading!
-kevin

Crude oil---Buy near 71.00, target 76.00-79.00Crude oil market analysis:
We still buy crude oil in the recent daily line, but yesterday's crude oil daily line closed with a big negative line. Short-term crude oil is about to start repairing. The retracement during the repair is our opportunity to buy again. Crude oil follows the long-term trend. In addition, the war between Iran and Israel is a long-term support for crude oil purchases. If the situation escalates, crude oil may easily stand above the 100 mark in the later period. Consider buying crude oil at 71.00 today.
Fundamental analysis:
Yesterday, Iran and Israel began to bomb each other again, and the situation began to escalate.
Operation suggestions:
Crude oil---Buy near 71.00, target 76.00-79.00
