CRUDE OILPreferably suitable for scalping and accurate as long as you watch carefully the price action with the drawn areas.
With your likes and comments, you give me enough energy to provide the best analysis on an ongoing basis.
And if you needed any analysis that was not on the page, you can ask me with a comment or a personal message..
Enjoy Trading... ;)
WBS1! trade ideas


DOUBLE TOP PATTERN | CRUDEOIL - SEP 25Crude Oil (1 Hour Timeframe)
Pattern: Double top spotted in crude oil.
Bearish Indicators Identified: Crude oil is trading within a falling wedge pattern, hinting at potential for a bearish breakout. The price is testing key support zones while repeatedly rejecting at the resistance.
Fundamental Outlook: Weaker-than-expected Chinese demand and Fed rate cut expectations are applying downward pressure on crude prices, although OPEC+ production cuts continue to provide support.
Key Levels: Watching for movement below 6040 for confirmation of bearish trend continuation.
Targets: 6000, 5900, 5850
Breakout Confirmation: A strong move below 6040 will confirm the breakout. Above 6200 could signal reversal.
Risk Management: Set stop losses to manage risk.
Disclaimer: This is a technical analysis and should not be considered financial advice. Trading involves risk, and past performance is not indicative of future results.
IF THIS WILL HELP YOU, PLEASE LIKE THE POST ❤️

WTI tests 71.50-72.50 resistance zoneOil traders mull over the demand outlook with China's outlook improving after a slew of stimulus, but the US outlook in question after weak consumer confidence data. EIA stockpiles are due later.
Oil trades below its falling trendlines and its 200 SMA. The price has recovered from a September low of 65.50. However, the recovery has run into resistance at the 71.50-72.50 zone, which buyers will need to overcome to negate the near-term downtrend. A rise above this resistance zone opens the door to 75.00, the falling trendline resistance, and 77.25, the 200 SMA.
Failure to rise above 71.50-72.50 could see the price ease back towards 70.00 before bringing 65.50 into focus.

Lesson 5: Patience – The Key to Long-Term Trading SuccessWelcome to Lesson 5 of the Hercules Trading Psychology Course—Patience: The Key to Long-Term Trading Success. Building upon the foundational traits of Initiative and Discipline covered in previous lessons, today we delve into the essential virtue of Patience. Whether you’re trading stocks, commodities, cryptocurrencies, or any other financial instruments, patience is a crucial element that can significantly influence your trading outcomes.
Why is Patience Essential in Trading?
Patience is more than just waiting; it’s about making informed decisions and allowing your strategies the necessary time to unfold. In the fast-paced world of trading, it’s easy to feel the urge to act immediately, but this impulsiveness can often lead to mistakes and missed opportunities.
Self-Inflicted vs. External Impatience
A lot of our impatience is self-inflicted, stemming from our own desires for quick profits and immediate gratification. However, some impatience arises from external factors beyond our control, such as sudden market fluctuations or unforeseen economic events. Understanding the sources of impatience is the first step toward managing it effectively.
Avoiding Financial Scams
Impatience can make traders vulnerable to financial scams that promise quick returns. Scammers often prey on individuals who are desperate and impatient, offering schemes that sound too good to be true but ultimately lead to significant losses. Recognizing these scams and maintaining patience can protect you from falling victim to deceitful practices.
The Long Game vs. Rushing
Playing the long game in trading is far more beneficial than rushing into quick trades. Patience allows you to wait for optimal trading opportunities, align your strategies with market conditions, and build a sustainable trading career. Without patience, even the best strategies can falter under the pressure of immediate results.
Realistic Trading Plans
For those who aren’t starting with substantial capital, patience is key to building a realistic plan for making a living through trading. Setting achievable goals, managing expectations, and avoiding the allure of “get-rich-quick” schemes are essential for long-term success and financial stability.
Key Concepts in Trading
Successful trading isn’t just about technical analysis or spotting trends; it’s equally about mastering the psychological aspects of trading. Two critical components are money management and trading psychology.
Money Management
Effective money management involves controlling your risk, setting appropriate trade sizes, and ensuring that no single trade can significantly impact your overall portfolio. It’s about protecting your capital and making informed decisions that align with your financial goals.
Trading Psychology
Understanding the psychological side of trading—such as initiative and discipline—is where the real magic happens. Many traders struggle with maintaining initiative, which can hinder their trading performance. Additionally, discipline helps traders stick to their strategies and avoid impulsive decisions based on emotions.
The Marshmallow Test and Trading Patience
The Marshmallow Test, conducted in the 1960s and 1970s at Stanford University, examined how patient children could be. Participants were given the choice between eating a marshmallow immediately or waiting for a short period to receive a second marshmallow. The results revealed that those who exercised patience tended to have better life outcomes, including higher academic achievement and better emotional control.
Fast forward to today, and our culture’s emphasis on instant gratification can make it challenging to cultivate patience, especially in trading. The markets don’t cater to our need for immediate satisfaction, and many trading promotions set unrealistic expectations for quick wins. Patience helps traders resist these temptations and focus on long-term success.
Forex Education and Leverage
While this lesson focuses on all financial markets, it’s worth noting that trading education often emphasizes the use of leverage—a tool that can amplify both profits and losses. Leverage is enticing because it allows traders to control larger positions with a smaller amount of capital. However, without proper understanding and disciplined risk management, leverage can lead to significant losses.
Many educational programs and trading platforms showcase flashy tools and promising high returns, which can mislead inexperienced traders into thinking that success is easy. True mastery of trading involves understanding the nuanced nature of market movements and the importance of disciplined strategies over flashy indicators.
The Realities of Trading
Many individuals enter trading with the misconception that it’s a quick path to financial freedom or a way to eliminate debt. However, the reality is that patience is crucial. Beginners may experience early successes that lead to overconfidence and excessive risk-taking, resulting in substantial losses that shake their confidence.
In their rush to recover losses, some traders fall for scams that promise miraculous returns but deliver nothing. This cycle of chasing losses can lead to a pattern of deceit and continual loss, highlighting the importance of patience and disciplined trading.
How Scammers Exploit Trading Desperation
When traders are desperate and lack knowledge, they become easy targets for scammers. These fraudsters exploit the trader’s impatience and desire for quick profits by offering schemes that seem promising but are fundamentally flawed. One such scam is the dual line scam, which has roots in sports betting but has infiltrated trading markets as well.
Scammers make outrageous claims about turning small investments into massive returns, enticing traders with the allure of easy money. They often charge hefty fees for these bogus opportunities, leaving traders financially devastated while the scammers reap the rewards.
The Price of Deceitful Trading
Consider the example of a trader named Marco, who manipulates the system to profit deceitfully. Marco convinces multiple individuals to bet on opposite outcomes, ensuring that he profits regardless of the market’s direction. Such tactics not only lead to significant losses for unsuspecting traders but also erode trust within the trading community.
Why People Fall for Get-Rich-Quick Schemes
Individuals like David, Holly, and Sergio are drawn to charismatic figures like Marco because they believe in the promise of effortless success. Despite experiencing losses, the initial taste of profit keeps them hooked, reinforcing unrealistic expectations. This highlights a fundamental flaw in chasing quick profits without understanding the underlying complexities of trading.
Why Patience is Key to Achieving Success
True trading success requires embracing the long game and committing to continuous self-improvement. Quick money may seem appealing, but it often leads to traps that undermine your trading career. Patience allows you to set realistic goals, persevere through challenges, and build a solid foundation for long-term profitability.
Most traders struggle because they don’t maintain their goals long enough, leading to high failure rates despite significant effort. Perseverance and patience are essential to navigating the ups and downs of trading and achieving lasting success.
How Can You Succeed in Trading?
Success in trading doesn’t necessarily require starting with a large capital. While a substantial investment can provide more opportunities, there are pathways for those with limited funds:
Trading on Behalf of Others: Demonstrating consistent wins through demo trading can allow you to manage funds for others, building your reputation and capital over time.
Attracting Investors: Wealthy individuals often seek skilled traders to help them earn more than traditional bank interest rates. Showcasing your trading abilities can open doors to lucrative opportunities.
Proprietary Trading Firms: These firms provide the capital you need to trade, but they require proven results and may involve upfront costs for training and desk fees.
Key Strategies for Successful Trading
To excel in trading, it’s essential to implement effective strategies:
Find a Reliable Trading System:
Look for systems with a solid track record, ideally with results spanning at least a year.
Test your system on a demo account or with real money, starting with a manageable investment.
Document Your Results:
Market your documented trading results online to attract opportunities.
Consistent documentation helps in building credibility and attracting potential investors.
Engage with Trading Communities:
Participate in forums, webinars, and trading groups to share experiences and gain insights.
Networking with other traders can provide support and new strategies.
Continuous Learning:
Stay updated with market trends, new trading tools, and advanced strategies.
Invest in your education to refine your skills and adapt to changing market conditions.
Why Play the Long Game in Trading?
Patience and a long-term perspective are crucial for overcoming obstacles and achieving trading goals. Trading is a journey filled with challenges, and maintaining a realistic timeline helps you stay proactive and committed.
By embracing the long game, you recognize that success doesn’t happen overnight. Instead, it results from consistent effort, disciplined strategies, and the ability to navigate through both profitable and challenging times. Subscribing to a disciplined and patient approach ensures sustainable success and minimizes the risks associated with impulsive trading decisions.
Conclusion: Embrace Patience to Transform Your Trading Journey
Patience is more than just waiting; it’s about making informed decisions and allowing your strategies the necessary time to unfold. By embracing patience, you empower yourself to navigate the complexities of all financial markets with confidence and determination.
In Lesson 5, we’ve explored why patience is essential, how impatience can lead to financial scams, and the importance of playing the long game in trading. These elements are vital for building a strong foundation and achieving consistent profitability across all financial markets, whether you’re a swing trader or a day trader.
Action Steps:
Reflect on Your Patience:
Assess how patient you are in your current trading approach. Identify areas where impatience may be affecting your decisions and commit to cultivating greater patience.
Develop a Comprehensive Trading Plan:
Create a detailed trading plan that outlines your strategies, risk management techniques, and criteria for entering and exiting trades. Ensure that this plan emphasizes patience and long-term success.
Implement Robust Risk Management:
Protect your capital by setting appropriate stop-loss orders, limiting trade sizes, and diversifying your portfolio across different financial instruments.
Maintain a Trading Journal:
Document every trade to gain insights into your trading behavior and identify patterns that need improvement. Reflect on your trades to reinforce patience and discipline.
Practice Emotional Control Techniques:
Incorporate mindfulness practices, meditation, or journaling into your daily routine to manage stress and maintain emotional equilibrium.
Engage with the Trading Community:
Join forums, attend webinars, or participate in trading groups to share experiences and gain support from fellow patient traders.
Trust in Your System:
Have confidence in your trading system. Understand that success takes time and that patience is a critical component of achieving long-term profitability.
By implementing these strategies and focusing on unique, relevant keywords for each lesson, you can effectively optimize your Hercules Trading Psychology Course for search engines while providing valuable and engaging content to your learners. This balanced approach ensures that your course ranks well without falling into the pitfalls of keyword cannibalization, ultimately attracting a broader and more targeted audience.
Ready to take the next step?
Continue your journey by enrolling in Lesson 6: Emotional Control in Trading, where you’ll learn techniques to manage your emotions, build emotional resilience, and maintain a balanced mindset, ensuring consistent trading success across all financial markets.


Crude Oil Trend FollowingCCI is above +100 on the 1 hour chart
We are at the beginning of the 1 hour trend and creating the 2nd wave.
Previous resistance is now becoming support.
We are also finding support at the 1 hour TrendCloud.
4 hour chart is also in an uptrend.
Trade entry at PDO
Let's see if we can catch this 1 hour trend for 5 waves.

USOIL 24-09Pair : US Oil - Crude Oil
Description :
Impulse Correction ( 38.20% )
Bearish Channel as an Corrective Pattern in Short Time Frame with the Breakout of Upper Trend Line
CHOCH
Break of Structure
Demand Zone
Options Blueprint Series [Intermediate]: US Election Oil Play1. Introduction
The 2024 US Presidential Election could have a significant impact on global markets, especially energy sectors like crude oil. With key policies and geopolitical tensions hinging on the outcome, many traders are eyeing a potential price surge in WTI Crude Oil futures. Our prior article (linked below) presented a potential opportunity for crude oil prices to rise by over 40% within a year following the election. This could bring WTI Crude Oil Futures (CLZ2025) from its current price of 67.80 to around 94.92.
To capitalize on this potential opportunity, a strategic options play can be used to leverage this potential move, providing not only a chance to profit from a bullish breakout but also some protection against downside risk. This article explores a Breakout Booster Play using options on the December 2025 WTI Crude Oil futures contract (CLZ2025), designed to benefit from a possible post-election oil price surge.
2. Technical Overview
In analyzing the December 2025 WTI Crude Oil Futures (CLZ2025), a strong support level is identified. The 61.8% Fibonacci retracement level aligns perfectly with a UFO support zone at 55.62, suggesting a significant area where buying interest could emerge if prices fall to this level.
The current price of CLZ2025 is 67.80, and the technical analysis points to the possibility of a substantial bullish move following the 2024 US Presidential Election. The projected price increase of 40% could push crude oil prices up to 94.92 over the next year. However, even a more conservative target of 20% (around 81.36) could offer considerable upside potential.
This analysis provides the foundation for constructing an options strategy that not only takes advantage of the potential upside but also offers a buffer zone against downside risk by capitalizing on key support levels.
3. The Options Strategy
The options strategy we'll use here is a Breakout Booster Play designed to take advantage of the expected rise in crude oil prices. Here's how the strategy is constructed:
1. Sell 2 Puts at the 55 Strike:
Expiring on November 17, 2025, these puts are sold to collect a premium of approximately 3.27 points per contract.
By selling 2 puts, we collect a total of 6.54 points.
This creates a buffer zone, allowing us to take on some downside risk while still profiting if prices remain above 55.
2. Buy 1 Call at the 71 Strike:
Also expiring on November 17, 2025, the call is purchased for 6.28 points.
This call gives us the potential for unlimited upside if crude oil prices rise above 71.
Net Cost: The net cost of this strategy is minimal, with the collected premium from the puts (6.54) offsetting most of the cost of the call (6.28). The result is a credit of 0.26 points, meaning the trader gets paid to enter this position.
Break-Even Points:
The position would lose money only if crude oil falls below 54.87 (factoring in the premium collected).
Profit potential becomes significant if crude oil rises above 71, with large gains expected if the projected move to 81.36 or 94.92 materializes.
This strategy effectively positions the trader to profit from an upward breakout while maintaining a buffer against downside risk. If crude oil drops, losses are limited unless it falls below 54.87, at which point the trader would be required to take delivery of 2 crude oil futures contracts (long).
4. Profit and Risk Analysis
Profit Potential:
The key advantage of this options strategy is its profit potential on the upside. If crude oil prices rise above 71, the purchased call will start gaining value significantly.
If crude oil reaches 94.92 (a 40% increase from the current price), the long call will be deep in the money, resulting in substantial profits.
Even if the price rises more conservatively to 81.36 (a 20% increase), the strategy still allows for meaningful gains as the call appreciates.
Since the net entry cost is essentially zero (with a small credit of 0.26 points), the potential profit is high, and it becomes especially powerful above 71, with unlimited upside.
Risk Management:
This strategy comes with a 19% buffer before any losses occur at expiration, as the break-even point is 54.87. However, it is important to note that if the trade is closed before expiration, losses could be realized if crude oil prices have dropped, even if the price is above 55.
Risk Pre-Expiration: If crude oil prices fall sharply, especially before expiration, the trader could face significant losses. The risk is theoretically unlimited because, as the market moves against the sold puts, their value could rise dramatically. If a trader needs to close the position early, those puts could be worth significantly more than the premium initially collected, resulting in losses.
Potential Margin Calls: If crude oil drops far enough, the trader may receive a margin call on the short puts. This could happen well before the price reaches 54.87, depending on the speed and size of the drop. If not managed properly, this could force the trader to close the position at a significant loss.
While there is a built-in buffer, this trade requires active monitoring, particularly if crude oil prices start to decline. Risk management techniques, such as stop-loss orders, rolling options, or hedging, should be considered to mitigate losses in case the market moves unexpectedly.
5. Contract Specs and Margins
WTI Crude Oil Futures (CL)
Tick Size: The minimum price fluctuation is 0.01 per barrel.
Tick Value: Each 0.01 movement equals $10 per contract.
Margin Requirement: Approximately $6,100 per contract (subject to change based on market volatility).
Micro Crude Oil Futures (MCL)
Tick Value: Each 0.01 movement equals $1 per contract.
Margin Requirement: Approximately $610 per contract, offering a lower capital requirement for smaller positions.
Why Mention Both?
Traders with larger capital allocations may prefer using standard WTI Crude Oil futures contracts, given their greater exposure and tick value. However, for smaller or more conservative traders, Micro Crude Oil Futures (MCL) provide a more accessible way to enter the market while maintaining the same exposure ratios in a smaller size.
6. Summary and Conclusion
This options strategy provides a powerful way to capitalize on a potential post-election rally in crude oil prices, while offering downside protection. The combination of selling 2 puts at the 55 strike and buying 1 call at the 71 strike, all expiring on November 17, 2025, creates a structured approach to profit from a bullish breakout.
With current analysis based on machine learning suggesting a potential 40% increase in crude oil prices over the next year, the long call offers unlimited profit potential above 71. At the same time, the sale of the puts at the 55 strike gives the strategy a 19% buffer, with the break-even point at expiration being 54.87.
When charting futures, the data provided could be delayed. Traders working with the ticker symbols discussed in this idea may prefer to use CME Group real-time data plan on TradingView: www.tradingview.com - This consideration is particularly important for shorter-term traders, whereas it may be less critical for those focused on longer-term trading strategies.
General Disclaimer:
The trade ideas presented herein are solely for illustrative purposes forming a part of a case study intended to demonstrate key principles in risk management within the context of the specific market scenarios discussed. These ideas are not to be interpreted as investment recommendations or financial advice. They do not endorse or promote any specific trading strategies, financial products, or services. The information provided is based on data believed to be reliable; however, its accuracy or completeness cannot be guaranteed. Trading in financial markets involves risks, including the potential loss of principal. Each individual should conduct their own research and consult with professional financial advisors before making any investment decisions. The author or publisher of this content bears no responsibility for any actions taken based on the information provided or for any resultant financial or other losses.

Nice Setup on Crude Oil4 hour chart MACD is showing bearish divergence and also cycling down.
1 hour chart is in a downtrend and CCI is below -100
15 chart shows a downtrend and Fibonacci retracement level of .618 inside a supply zone.
Let's see if we can hit .618 and take the trade short all the way to the 50SMA on the 4 hour chart.

2024-09-23 - priceactiontds - daily update - oilGood Evening and I hope you are well.
tl;dr
Oil - 230 ticks surprise downside by the bears but bulls prevented the ugly daily bar, which leaves us with a neutral bear bar. Market closed above the daily ema and right at the bull trend line that was broken earlier. Selling was strong enough to expect a second leg but anything below 69 would surprise me.
comment: Finally some decent selling again. Bears need to keep it below 71 to trap many late bulls buying too high. I have a measured move target around 67.2 but for now I doubt we get that low. Selling today was strong enough to expect a second leg. Given the fast move upwards, I would not look to buy this dip and wait until market has found a better bottom than 69.5.
current market cycle: trading range inside big broad bear channel from the daily chart
key levels: 69.5 - 72
bull case : Bulls bought the lows but need to get above 70.60 to stay inside the bull channel. They would also need to close the current bear gap to 70.8ish to have better arguments to trade back up. They prevented the worst by closing above the daily ema and not letting the bear bar looking too good so market is pretty neutral going into tomorrow. Above 70.7 I favor the bulls for 71 or 72 again.
Invalidation is below 69.5.
bear case: Bears want a second leg down to 68 or lower. If they can generate strong follow through tomorrow, many bulls could cover their longs and the selling might accelerate. For now it’s low probability and more likely is more sideways movement and some oscillating around the daily ema.
Invalidation is above 70.7.
short term: Neutral between 70-71, bearish below 69.5 and bullish above 70.7.
medium-long term - Update from 2024-09-08: Bears broke below multi month support and want a retest of 64.46 or lower. Right now the selling is a bit too steep to be sustainable. When we get a more complex pullback and form a decent channel, I will write a longer update here. Can this bear trend be the start of a bigger where we see Oil below 50$ again? I have absolutely no idea but the current daily chart can not not lead to that conclusion.
current swing trade: None
trade of the day : I was in denial of the strength of the selling. 2m ema was not touched and that could have been the trade of the month. Bar 41+42 formed a double top with the bars 2-4 and bar 43 was strong enough to flip market always in short. Very bad trading on my end to not take it.


#202439 - priceactiontds - weekly update - wti crude oil futuresGood Evening and I hope you are well.
tl;dr
wti crude oil: Daily bars looking weak but it does not matter, it’s a small pullback bull trend and it’s going higher. Not a single bar went below the previous so we are max bullish. 72 is very likely get hit on Monday and the first bigger target is 73. There market decides if this bigger bear trend is still alive or we have found a credible bottom at 64.
Quote from last week:
comment: Selling the 4h ema on Tuesday was as perfect as it gets. Bulls bought the lows again and 65 held. Neutral around 68 because both sides have reasonable arguments.
But also this:
Given the max bearish sentiment that everyone and their dog is writing about on x, I favor the bulls to trap late bears much more than I expect continued selling but as long as bears are below the daily ema, they are in control of the market.
comment: Low effort comment last week. Deal with it. Bulls have formed a small pullback bull trend from the 64 low and bears selling below 67 are still trapped. Bears have not gotten one daily bar below the prior bar during the past 8 days. No reason to expect this to change all of a sudden.
current market cycle: bear trend
key levels: 64-74
bull case: 4h tf. Look at it. Every touch is bought. Until that stops, only look for longs. Bulls are only making higher lows and higher highs. Their next target is the obvious bear trend line around 73.5/73.7. Even if bears come around and print something below 70, bulls would most likely buy it for a retest of 71.5 or 72.
Invalidation is below 68.5.
bear case: Bears who sold below 67 were trapped and market just keeps going higher. Bears gave up completely on Thursday and Friday was most likely bulls taking profits and opex things why we stalled. Until bears print something below 69, they have no arguments as of now. Sure we are still inside the bear channel but the upper trend line is still almost 400 ticks away. Best they can probably get is sideways movement 70-72.
Invalidation is above 72.
outlook last week:
short term: Neutral around 68. I have alerts and wait for one side to clearly take control again. Slightly favoring the bulls if they stay above 68 and get momentum going again.
→ Last Sunday we traded 68.65 and now we are at 71. Bad outlook. Bulls took over completely. I still think it was a surprise since market did not even retest anything below 67. Would give the outlook again.
short term: Bullish near the 4h 20ema until it stops working. Take profits at new highs unless bulls show even bigger strength.
medium-long term - Update from 2024-09-22: Bears channel is the main pattern right now but bulls are trying to test the upper trend line. There we will see if the bear trend is has another leg down or we move sideways. There is an argument that the spike below 69 was a trap and we continue inside a range 69 - 75/77.
current swing trade: None
chart update: Added bull trend lines from the 4h tf.

MCLZ2024 - Micro WTI Crude Oil (DEC24): Targeting 72.00Will demand in the oil market continue into the future?
With current geopolitical tensions and conflicts raging on, I believe that the demand for oil is likely to increase into the coming months.
Follow along with my MCLZ2024 chart to stay up to date with @trader9224's current trade idea.
For those new here or looking to follow along, with the new week of trade, comes a new trade plan.
This week I will be focused on the micro WTI future contracts.
Comment below with questions, comments, or a chart of your own!


Oil looking good so farNot a trendline trader but look how this trendline is respected
We did approx 400 ticks this week
If the next week is good and we go the same pace we can end up at 75,60 at some point
Looks like we are in uptrend and hopefully next week oil will treat us good

COT Strategy - Crude Oil LongsDISCLAIMER: This is not trade advice. This is for educational purposes only to demonstrate how I am looking to participate in this market. There is significant risk involved in trading, do your own homework and due diligence.
COT Strategy
Crude Oil (CL)
My COT strategy has me on alert for long trades in CL again this week. To clarify, this was setup last week also, and triggered me long this week via a CCI divergence long trigger. Based on this weeks COT strategy analysis, I think this is a nice market for further upside and will look to enter again via 18MA & 10H8C MAC entry methods.
COT Commercial Index: Buy Signal.
Net Positioning: Max long of last 3 years - bullish.
Small Spec Index: Buy Signal.
Valuation: Undervalued vs Gold & Treasuries.
Front Month Premium Market.
True Seasonal up to Mid October.
Supplementary Indicators: Stochastic.
Remember, this is not a "Long Now" idea. These indicators are not timing tools. They simply tell us that this market could have a move of some significance to the upside, which we will participate in with a Daily long trigger.
Good luck & good trading.

Light Crude Oil Futures (CL1!) on the NYMEX struggle
Price Movement
Current Price: The current price is $71.00, showing a recent increase of $2.35 (3.42%).
Trend: The price has been fluctuating within a range, marked by a purple rectangle, indicating consolidation between approximately $60 and $80.
Volume
Current Volume: 1.45 million, suggesting moderate trading activity.
Historical Performance
The table below the chart shows monthly percentage changes from 2013 to 2024.
Seasonality:
March and April tend to have positive returns historically, with April showing an average increase of 4.38%.
October and November often exhibit negative returns, with October averaging a decrease of 2.18%.
Technical Indicators
The chart includes several annotations indicating significant price changes over time.
Resistance and Support Levels:
Resistance appears around $80.
Support is near $60, as indicated by the lower boundary of the consolidation range.
Conclusion
The chart suggests that crude oil prices are in a consolidation phase. Traders might look for a breakout above $80 for bullish confirmation or a breakdown below $60 for bearish signals. Historical data indicates potential seasonal trends that could influence future price movements.

Weekly analysis crude oilRed line's are support
Green line's are resistance
Only for learning purpose

Will a Jumbo Rate Cut Fuel Crude Oil Rally? US equities soared to record highs on higher-than-expected rate cuts by the US Federal Reserve. Additional rate cuts implied by the Fed dot plot signals a goldilocks economic scenario. A booming economy coupled with low crude oil inventory levels with intensifying geopolitics could tip crude oil prices into a rally.
Oil prices rose higher yesterday as hard economic landing concerns eased. Despite the rise, oil prices still languish at near-record lows for the year.
This paper posits a long position in CME Micro WTI Crude Oil Futures with an entry at $69.90/barrel with a target of $76.50/barrel and a stop at $67.30/barrel.
JUMBO RATE CUT BY THE US FEDERAL RESERVE
The Federal Reserve cut interest rates by 50 basis points (bps), bringing the federal funds rate to 4.75%-5%. With inflation easing and the labour market softening, the Federal Open Market Committee (FOMC) opted for the aggressive rate cut.
US inflation is nearing its 2% target. Job growth has slowed. Unemployment, though rising slightly, remains low. To maximise employment while guiding inflation on a downward trajectory, the FOMC delivered a 50 bps rate cut.
The unemployment forecasts were revised to 4.4%, up from June's 4% estimate. Inflation outlook was lowered to 2.3% from 2.6%.
NOT ONE BUT THREE OIL BULLS ARE LURKING IN THE SIDELINES
Rate cuts, low inventory, and intensifying geopolitical tensions could tip oil prices into a rally.
Rate Cuts and Crude Oil
Typically rate cuts boost oil prices by weakening the dollar and increasing demand for dollar-denominated commodities.
Tank-Bottom Inventory Levels
US commercial crude oil inventories have fallen to their lowest level in a year. Inventories at Cushing have hit tank-bottom levels. For now, a larger-than-expected drop in US crude inventories for the week ending 13/Sep had a negligible impact on oil prices.
The EIA reported a 1.6 million barrel decline, surpassing analysts' expectations of a 200,000 barrel drop.
Traders dismissed the drop in inventory, attributing it to temporary facility shutdowns on the US Gulf Coast due to inclement weather.
US refineries plan to undertake their lightest preventive maintenance season in three years as estimated by IIR Energy. Higher refining activity should result in increased demand for crude oil in the coming months.
Intensifying Geopolitics
Talks between Libya's rival factions have collapsed leading to a significant decline in Libyan exports. Compounding that are the escalating Middle East conflicts with pagers and walkie-talkies explosions in Lebanon.
OIL BULLS FACE FEEBLE MACROECONOMIC CONDITIONS IN CHINA
Earlier this month, OPEC , EIA , and IEA lowered their 2024 global oil demand forecasts, citing weaker demand from China's slowing economy.
Recent data shows continued weakness. Industrial output growth is at a five-month low. Oil imports are declining with slower refinery output. Property prices continue to fall. Retail sales growth remains tepid.
Housing prices continued to decline, with a 5.3% YoY drop, the steepest since 2015. New home prices fell 0.73% MoM in August, a sharper decline than July's 0.65% drop.
Property investment dropped 10.2% YTD, while housing completions fell 23.6%, indicating that declining property prices are deterring investment.
HYPOTHETICAL TRADE SETUP
When oil bulls lurking in the dark attack, expect oil prices to spike. Options markets are positioning for this scenario. Open Interest Put/Call Ratio at 0.77 as of 18/Sep in CME WTI Crude Oil points to a bullish slant.
CME Micro WTI Crude Oil Futures offer the same exposure to crude oil price movements as standard WTI futures, but at 1/10th the contract size, making them a more accessible and flexible option for traders, enabling more granular hedging.
This paper posits a long position in CME Micro WTI Crude Oil Futures with the following trade setup:
• Entry: $69.90/barrel
• Target: $76.50/barrel
• Stop: $67.30/barrel
• P&L at Target (per lot): $660 ((76.50 – 69.90) x 100)
• P&L at Stop (per lot): $ 260 ((67.30 – 69.90) x 100)
MARKET DATA
CME Real-time Market Data helps identify trading set-ups and express market views better. If you have futures in your trading portfolio, you can check out on CME Group data plans available that suit your trading needs tradingview.com/cme .
DISCLAIMER
This case study is for educational purposes only and does not constitute investment recommendations or advice. Nor are they used to promote any specific products, or services.
Trading or investment ideas cited here are for illustration only, as an integral part of a case study to demonstrate the fundamental concepts in risk management or trading under the market scenarios being discussed. Please read the FULL DISCLAIMER the link to which is provided in our profile description.

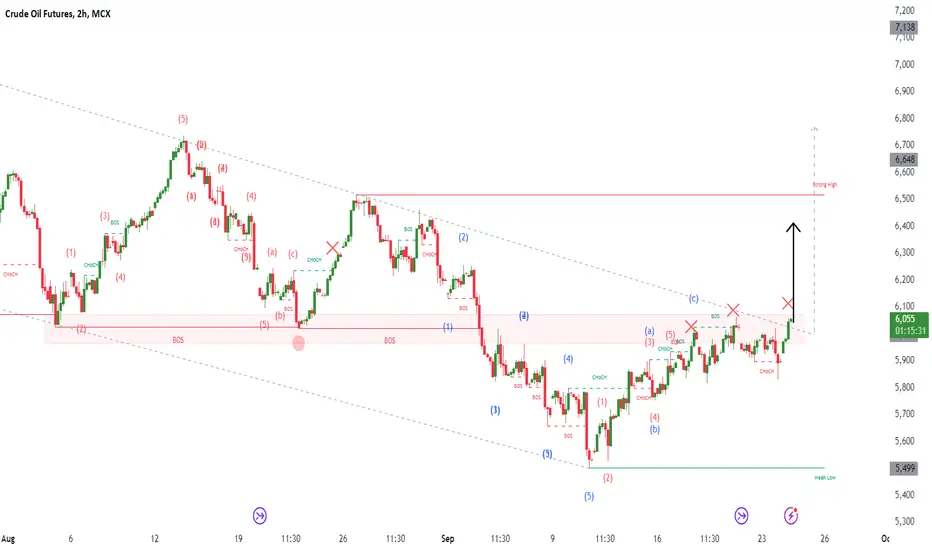
CRUDEOIL BREAKOUT ? FROM FALLING WEDGECrude Oil (1 Hour Timeframe)
Pattern: Falling wedge pattern, signaling a potential breakout.
Entry: Long position above 6040
Target Levels:
1st target: 6100
2nd target: 6140
3rd target: 6200
4th target: 6235
Stop-Loss (SL) : yours
Risk Management: Set stop-losses appropriately to manage risk and avoid potential losses.
Fundamental Factors:
Fed Rate Cut: The Federal Reserve's decision to cut interest rates is seen as positive for oil demand, potentially boosting prices.
Geopolitical Tensions: A recent attack on Iran-backed Hezbollah raises concerns about wider conflict in the Middle East, which could disrupt oil supplies and push prices higher.
Disclaimer: This technical analysis is based on the provided data and should not be considered financial advice. Trading involves risk, and past performance is not indicative of future results.
IF THIS WILL HELP YOU, PLEASE LIKE THE POST ❤️


testchecking the first trade date is a very important date to consider if u are gonna dive deep into the gann feild , very long but exciting journal
