8752 Break Could Open Path to Retest Record HighsA clean break above the March 20 high of 8752 would generate a bullish setup, allowing for longs to be established with a stop beneath for protection, targeting a retest of the record high at 8898.
Price action has been bullish in recent days, with a break of minor downtrend resistance on Thursday
Related futures

XRP/USDT 1H: Bullish Momentum Holding – Next Stop $2.95?!XRP/USDT 1H: Bullish Momentum Holding – Next Stop $2.95?
🚀 Follow me on TradingView if you respect our charts! 📈 Daily updates!
Market Structure & Momentum:
Price: $2.73, maintaining bullish structure after breaking $2.60 resistance.
RSI at 70.39, indicating strong momentum but nearing overbo

FTSE 100 futures: Buy the dip for resistance retest?FTSE futures continue to coil in a triangle pattern dating back nearly a year. While that suggests we may eventually see a decisive break at some point, today’s setup looks at playing the existing range.
The price has been well supported on dips towards and through 8200 recently, bouncing on four

Footsie Hasn’t Topped Yet; Shows Bullish PatternWe talked about Footsie back in May 2024, where we mentioned and highlighted an ongoing 5th wave in the weekly chart with space up to 8800 – 9400 target area.
Footsie a.k.a. FTSE100 or UK100 stock market index is still bullish with nice and clean inverted H&S pattern on a daily chart. After a high

FTSE 100 futures reverse hard to stage bullish breakoutFrom dire to delightful in the space of two sessions – that’s was the rollercoaster ride UK FTSE 100 bulls had to endure late last week with futures taking out stops layered below 8152 before reversing hard on Friday, taking out the 50-day moving average and downtrend resistance dating back to the r

Footsie Is Trading In 5th WaveWe have been talking for a long time about bullish UK stock market index FTSE100 a.k.a. Footsie. We also shared the chart with our members more than a year ago, where we were tracking wave 4 correction within an ongoing five-wave bullish impulse.
After a longer sideways consolidation, it turned out

FTSE 100 Analysis - Continuous, Just as the Markets !This is a Thread, so Follow for Technical Analysis performed with TrapZone Pro & UMVD Indicators.
* Trend is Based on TrapZone Color
* Bar Colors give us Momentum Green from strong Up Moves. Red Bars point to strong Down Moves.
* Red UMVD = Selling Pressure & Green UMVD = Buying Pressure. Purple is


FTSE 100 index Weekly chart FTSE 100 index looks like its getting ready for a breakup that can take the index to new highs in the coming weeks
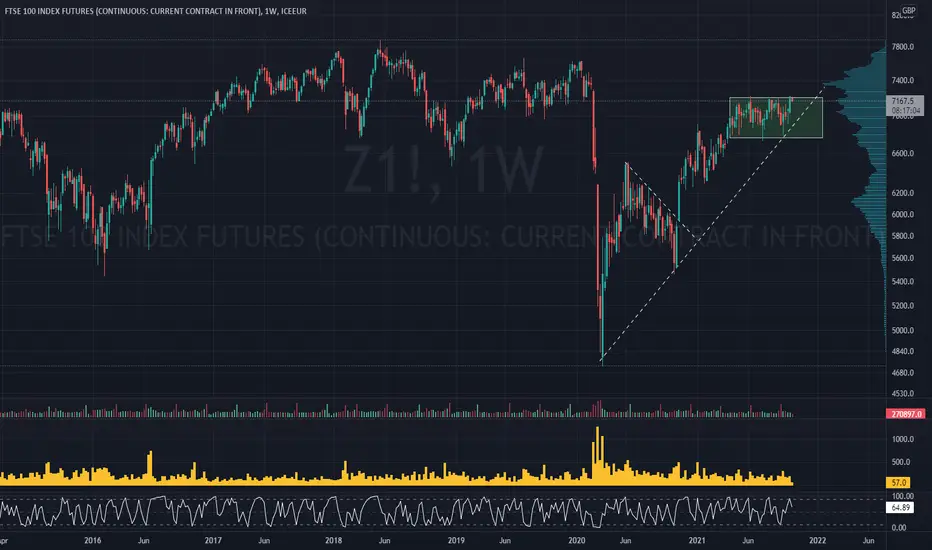
Long FTSE on break above 6290The FTSE has lagged other major indices since the March lows but could now be set to play catch up.
Price still around the 50% retracement level and in a narrow 300 point range for the past month or so.
8/21 EMAs positive and a clean break above 6290 would pave the way for a breakout.
Possible t

See all ideas
Summarizing what the indicators are suggesting.
Neutral
SellBuy
Strong sellStrong buy
Strong sellSellNeutralBuyStrong buy
Neutral
SellBuy
Strong sellStrong buy
Strong sellSellNeutralBuyStrong buy
Neutral
SellBuy
Strong sellStrong buy
Strong sellSellNeutralBuyStrong buy
A representation of what an asset is worth today and what the market thinks it will be worth in the future.
Displays a symbol's price movements over previous years to identify recurring trends.
Frequently Asked Questions
The current price of FTSE 100 - Stnd Index Futures is 9,152.5 GBP — it has risen 0.14% in the past 24 hours. Watch FTSE 100 - Stnd Index Futures price in more detail on the chart.
The volume of FTSE 100 - Stnd Index Futures is 270.00. Track more important stats on the FTSE 100 - Stnd Index Futures chart.
Open interest is the number of contracts held by traders in active positions — they're not closed or expired. For FTSE 100 - Stnd Index Futures this number is 404.01 K. You can use it to track a prevailing market trend and adjust your own strategy: declining open interest for FTSE 100 - Stnd Index Futures shows that traders are closing their positions, which means a weakening trend.
Buying or selling futures contracts depends on many factors: season, underlying commodity, your own trading strategy. So mostly it's up to you, but if you look for some certain calculations to take into account, you can study technical analysis for FTSE 100 - Stnd Index Futures. Today its technical rating is buy, but remember that market conditions change all the time, so it's always crucial to do your own research. See more of FTSE 100 - Stnd Index Futures technicals for a more comprehensive analysis.