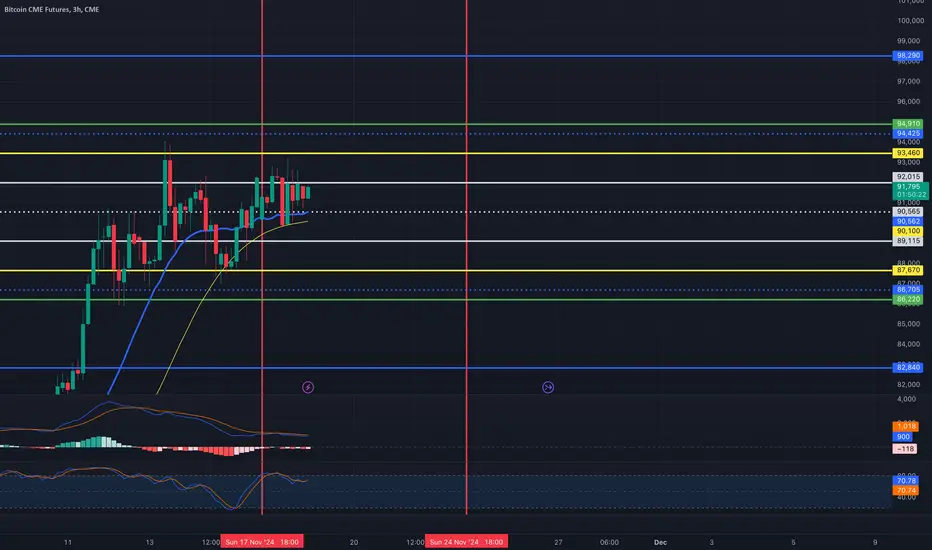
Possible Buying areasgood day traders, I've decided to share my First analysis on futures and these are the possible buying areas I see, between the dynamic trendline or the major low. It's best to wait for a bullish confirmation between these two areas before entering to increase your probability of winning, don't forget proper risk management
BMC1! trade ideas

CME Bitcoin futures chart look bearishCME #btc #bitcoin futures price has made bearish double top and distribution seems has just started. Bearish continuation may be expected, beware.


Bitcoin tends to falter the day after ThanksgivingThe 124k target remains in play overall, but for now I suspect the shakeout from its 100k milestone has more to offer bears. And while bitcoin prices are showing a nice breakout from a flag pattern on the 1-hour chart, bulls should take note that today (the day after Thanksgiving) tends to be a bearish day on average. And that could make any moves towards 100k tempting for bears to fade into over the near term.
MS


Bear market first two quarters of 2025 expecting BTC to be bearish just a pull back to the monthly order block then skyrocket again looking at price range from 65k-70k

Strong Buy on Micro BTC 15 min timeframe (Futures)Above the 50 and 300 EMA
Entered on a pullback from my indicator
Targeting 200 ticks
~One to two Risk : Reward ratio

Will the CME gap get filled?
BTC is looking for a liquidity void, and the CME gap looks perfect for it, but will it get filled?
i'm still bullish long term

BTC CME Chart - Mind the Gap!Currently there exists a gap of around 3000 USD between roughly 80.000 USD and 77.000 USD. This gap is around 20-22 % from the last top and also marks a zone between two fibonacci lines (0.283 from the last lowest low and the 0.382 line from the low before that).
My educated guess is that we get a relatively 'normal' traceback to that zone. To fill the gap and to build up momentum for another rise in the bitcoin price.
Note that pullbacks of 20 percent are quite normal, although the range in Dollars can get larger and larger as we go higher and higher.
Please like if you share my opinion.

Btc1!/UsdtCME:BTC1!
Simple to understand market going to fill this gap soon i am not moving my Spot position when market give a opportunity then i am going to buy some spot bags...
Disclaimer : Not Financial Advice

BTC Huge Gap!!! We going back to 75k?Hey guys!
Congrats all with BTC ATH and recent profits, I was not commenting the situation, because it was pretty clear, and we all know what was happening.
But also, as we know, even in the bull cycle have to be corrections and consolidations.
So here at the futures chart, we can see a huge gap around the healthy correction possible zone (max to 30%). Also, we have RSI oversold for sure and descending volumes.
Plus, in December there were no promises about decreasing US Interest rate, so possibly December can end up in this correction phase.
What's your thoughts about when and how much we could go? Let's chat in the comments =)

BTC1! WEEK OF 11/18/24BTC1! WEEK OF 11/18/24
To maintain simplicity, once the price moves beyond the WHITE range, monitor for a potential retest of the breached level.
Be prepared to initiate long or short positions targeting the YELLOW ranges.While prices may surpass the YELLOW range targets, these levels provide a robust framework for securing profits. 🎯🫡
*These levels are derived from comprehensive backtesting and research, demonstrating over 90% accuracy. This statistical foundation suggests that price movements are likely to exceed initial estimates.*
$BTC1! Fib Simulation of Fractal (UPD)Perceiving the price action as a function of trading time justifies the quantitative approach in drawing geometric relationship between phases of cycles. Hence, it's safe for me to assume that market is a time fractal which has its own path regardless the collective opinions of the market participants. Logistic curve that reflects well the speed of information spreading made me ignore the voices of masses. The principle aligns with EMH - that the condition of the market is already reflected in the current price.
Impulsive and corrective waves are governed by golden rule in one way or the other. That's why I used fibonacci channels to build predictive models which reflect the interconnectedness of composite fractals to the whole cycle. By measuring the extreme levels of historic wave, the derived fibonacci channels exposed the timing, size and probability levels of the next ones.
In regular TA, people are wrongfully focused on covering their immediate expectations from the market, analyzing a narrow data range of the chart. Whereas, Fractal Analysis graphically shows how current price is interconnected with the entire history of fluctuations in a single probabilistic map.
In this update I fused earlier discovered structures and boundaries to the chart
Added more series of fib ratios derived from white triangle (src 0;1)
Linear boundaries of macro-fractal:
Implementation of fibs with big time Intervals:
As violet Fibs:
Other observations:
We're in a big triangle derived by linear extension 2021 tops and Full cycle (COVID - 2022 LOWS)
Source:
Implementation:
(On interactive chart it darkens till intersection)

Bitcoin’s CME futures gap gives a clue for the 1st big correctonAnytime you see a gap in price action like this they almost always get filled, and typically get filled sooner than later. So while there is a chance bitcoin could turn the current mild retracement into a deeper pullback that goes down to fill this gap, until the current support on btc is broken, which is the top trendline of the rising wedge it now currently has 3 consecutive daily candles above(not shown here), I think it’s more probable that bitcoin waits for a much more powerful resistance line that results in a much stronger rejection before it corrects back down far enough to fill this gap. If the current pullback doesn’t lead to the gap fill then my guess is once we retest the top green trendline of this group of channels:
That this would be the perfect time to have our first significant correction of the current parabolic phase of the bull market. I will be prepared for either zone to have a chance to fill that gap and plan accordingly, Also a few measured move targets around the 115 - 116k range so a pullback could potentially occur around that zone as well. *not financial advice*

We may still have small bullish before correctionBitcoin has been in a big uptrend since Trump was elected president. By the time Bitcoin went up it left a CME gap. These gaps work for the liquidity of the market and are like magnets. People have noticed it and are waiting for the closing of the gap.
Same thing happened in 2023 Nov-Dec. After the gap bitcoin went up like now, but people start to predict the closing gap and went for short. At the sametime the Whales are waiting people to change their mind that we are continuing to go up after all. After 10% up from new highest high, whales close the gap.
2023 December Bitcoin made a new highest high in a round 44,880$, 10% up to 49,500$. After a 20% dip to close the gap at 39,000$. 2024 November Bitcoin made new highest high in a round 94,085$ and is heading at 10% up to 103,600$. If history repeats itself, we should have a round 20% dip to closing the gap.
Although the situation is similar there is still a big difference, because we are talking about the 100,000$ limit which is really a psychological number. Source: own made research and analytics from Tradingview and CoinMarketCap

BITCOIN CME weekly chartAs BTC approaches 100K on CME there is Big GAP formed between (78000-80500) Its a red red Sign For Swing Traders and Invester as BTC should fulfill these Major GAPs. Also testing 1.414 reversal region of FIB extension
Also there is Supply to demand region and high volume area around (67000-70000)
If BTC retrace towards 70K it will good Opportunity for Bulls and Investors.... Soon Bear will dominate the market in week or two. Mark my words


UPDATE Bitcoin hit our $100,000 first target - Way soonerIf you've been following my TradingView ideas.
You'll know Bitcoin broke out of a Falling Wedge pattern on 27 September 2024. It then came back down to sweep liquidity from the buyers.
Moved up and we got a confirmation signal that upside was imminent from $67,000.
Since then, it's been text book that the market has been moving up a trajectory of 45 degrees and then escalated its upside when Trump became president.
So, the first psychological target has been reached at $100,000 and the next target of $105,000+ is easily on the cards.
So, things are still looking up with Bitcoin. Investors are even studying Bitcoin fundamentals which state it should go higher due to political and economic reasons. Who thought?
ANd with Alt Coins also having their days, it looks like Crypto Summer is here to stay.

VMA setup. Velocity moving average.
We trade structure And never fear of a manipulation!
We get in on beginning wick entry.

BTC is dumb especially what it is turning into.I mean look at this bear flag on the futures... Micro Strat is the top signal... 100k is for the birds.. Send this shit back to 10k

Bitcoin Reacted Well to InflationBitcoin serves as an inflation hedge, going beyond its role as a decentralized digital currency that facilitates peer-to-peer transactions without intermediaries like banks or governments.
When inflation peaked at 9% in 2022, both Bitcoin and gold exhibited upward trends—a pattern that has continued to the present day.
Although the latest inflation figure stands at 2.6%, the current levels of gold and Bitcoin, driven by market demand, indicate that inflationary concerns persist.
Today, we’ll explore how to buy Bitcoin during market dips.
Mirco Bitcoin Futures & Options
Ticker: MBTX4
Minimum fluctuation:
$5.00 per bitcoin = $0.50 per contract
BTIC: $1.00 per bitcoin = $0.10 per contract
Disclaimer:
• What presented here is not a recommendation, please consult your licensed broker.
• Our mission is to create lateral thinking skills for every investor and trader, knowing when to take a calculated risk with market uncertainty and a bolder risk when opportunity arises.
CME Real-time Market Data help identify trading set-ups in real-time and express my market views. If you have futures in your trading portfolio, you can check out on CME Group data plans available that suit your trading needs www.tradingview.com

Bitcoin Elliott Wave Analysis: Wave 5 in Action! Bitcoin is technically riding Wave 5 on both higher and lower timeframes – a strong indication of potential momentum toward its maximum potential! 🎯
📊 Key Levels
Target: $102,000 (Fib 1.618 extension level)
Stop Loss: $91,800 (below Wave 4)
Entry: Market Price
📈 Risk-to-Reward: 2.5:1 RRR
This setup aligns perfectly with Elliott Wave theory, signaling an excellent risk-reward opportunity. Ride the momentum and stay sharp – Bitcoin might be heading toward new highs! 🌟
💡 Pro Tip: Always manage your risk and stick to your plan!
⚠️ Risk Disclaimer: Trading cryptocurrencies involves a high level of risk and may not be suitable for all investors. Prices can be highly volatile, and you could lose your entire investment. Always conduct your own research and consider your financial situation before trading. Never risk more than you can afford to lose.
#Bitcoin #ElliottWave #CryptoTrading #BTC #RiskManagement

BTC vs ETH cup and handleBackground: lots of talk about BTC cup and handle pattern
Image: BTC and ETH side by side
Movement: crypto goes big to small cap regarding movement (except ADA seems to usually be first legit move)
Plan: classic upward play once handle breaks
