FVG has been filledFollowing my last post of new creation of FVG on BTC daily, FVG has beed quickly filled yesterday to close gap
BMC1! trade ideas

New FVG on daily BTCNew FVG on daily BTC chart appear 45.5K & 46K.
BTC Correction start to be defined.
Also we can still looking for 51K

BTC1!As we near the January 10 BTC ETF deadline, it appears BTC is once again picking up momentum after having been confined to range from 40-45k since early December.
Whichever way this breaks, I wouldn't fade.
618 of the whole move first level for longs to overcome.
CME has its final two gaps en route to all-time high at 51k and 53k respectively thereafter.
Third quarter retrace to highs around 55k tertiary.

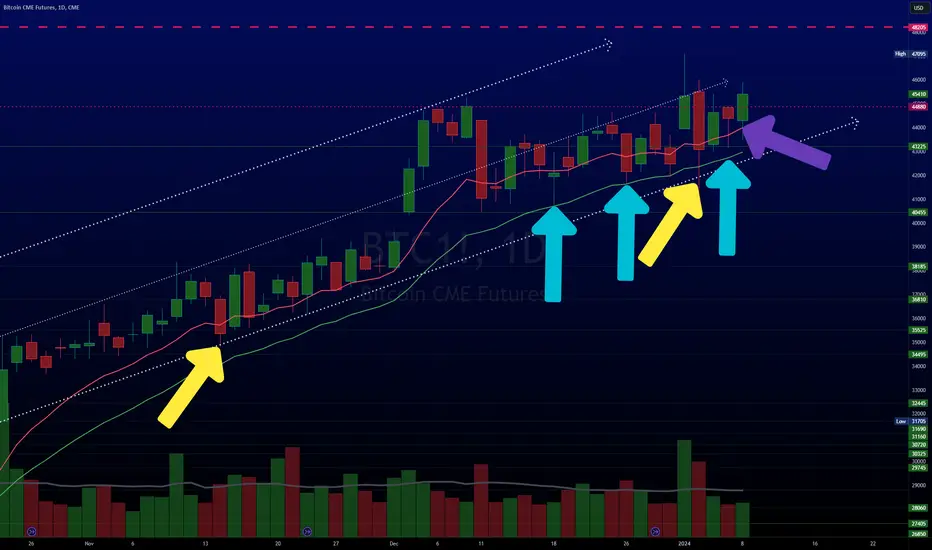
$BTC holding while weakening, what? LOLGOOD MORNING
Don't see an increase in CRYPTOCAP:BTC shorts. With #ETF news perhaps traders do not want to be short.
Don't see a #BTC a breakdown, JUST weakening of the RSI during this current move.
BUT
#Bitcoin keeps bouncing off the trendline, yellow arrow.
We also see bouncing off the 20 Exponential Moving Avg, cyan, & the red = TREND strength.
As posted few days ago, the top part of the range keeps getting poked. The more poking the weaker resistance gets!

#LQR #TOBTC #CME_Bitcoinin CME Market bitcoin got a Gap around 39230 - 40315 which is to important as support and its may making Price back to it
so becarefull with all your buy positon
always DYOR!

BTC SHORT/CRAB, LET GO.BTC looks to be in a short term distribution phase, with a likely top already in ~47k on CME.
Expect moderate volatility this quarter, where I expect constant violent 10% swings in either direction between 46k and 41k until the ETF approval. Afterward, expect a drop to ~38.5k by the end of January. Note, January EOM has the highest likelihood of dropping the furthest beyond the "Q1 High probability range noted on the chart" towards 34.5k.
Breaking out the Q1 Range will likely result in continued momentum to follow until the next line of support/resistance, noted at 50k or 34.5k.
The last line of defense will be ~31.6k in the event of a full liquidation cascade as it supports the previous sideways structure we had between 32k and 25k since March last year and acts as the 0.5 fib from the ATH to this cycle low. If we drop further under 30k, than you must accept the increased probability of 46k being a bull trap and being the largest rug pull to occur and we head toward revisiting 20k, 15, and even 10k.
RWI (Random Walk Index) and LS (Liquidation Screener) are the indicators used. RWI is printing bearish divergences along with starting to crossover toward bearish trend. LS probably has shown the top as it has hit the red bearish territory and recently dropped out of it and heading over the median line currently at 33.7k (but is rising and i could see it bottom out toward the lower side of Q1 probability range by EOM JAN or even EOQ)
Overall, I believe the ETF may be a sell-the-news event that will in the grand scheme of things crab between 46k and 41k, until the end of Q1, but with a short visit to 38.5k. Breaking out the expected range of 46k-38.5k, begets continued momo in the same direction. Take note this is likely due to lowered overall volatility of BTC maturing as a whole. But alts may push forward after the expected flush.
Let go. Relax.
Q1 Ranges:
High probability
46k-38k
Moderate probability
52k-30k
Max probability
54k-18k
Trades:
Short @ 44k
TP 41k, 39k, (may carry it down to 30k depending on PA under 39k)
SL 47k
Short @ 50k ( if expected range breaks out)
TP 40k, 35k, 32k
SL 54k
Long @ 39k
TP 44k, 50k
SL 37.5k
Long @ 35k & 32k
TP 40k, 50k
SL 29k

Bitcoin| my opinion.I think in the near future (1-5 days) we will go down to the 40900 level, then we will need to look from this level.
It's a work of fiction its nor financial recommendation.

Shocked @ $BTC and #crypto hit today?Good Morning!!!!!!!
In reference to the rout #crypto is taking, everyone's playing Monday morning quarterback.
The post quoted, pls see more info on our profile page, wasn't the 1st post with warning!!!
We had mentioned the breakout had a lot of selling with little buying to support holding the move. CRYPTOCAP:BTC gave up a large chunk of the gains.
We also spoke on #BTC $ flow lessening & the weakening RSI.
The CRYPTOCAP:BTC RSI looks to cross sub 50, it must hold 40ish area.
#BTC $ Flow hasn't looked good at all, buy on the rumor and sell news. Could be what's happening.
#Bitcoin forming a BEARISH ENGULFING. Recall NASDAQ:NDX did this and was walloped for a bit before recuperating. KEEP and EYE ON VOLUME TODAY!
Weekly, Bitcoin has formed an outside week, more on this later.
AMEX:BITO

BTC1!In hindsight, that break below 46140 at 15:00 UTC January 2nd was the textbook Wyckoffian crack of the ice pre-distribution.
Now that we're here, it's important to note that this dip filled gap at last Friday's close, deviated below and reclaimed mid of whole move in testing it as support, which makes me think the distribution is done for now.
So long as can keep closing above mid we'll bounce back from this stronger.
Still think 618 before 3xxxx.

Bitcoin's Bullish Surge: Potential Targets and Path AheadBitcoin has surged beyond a symmetrical triangle, hinting at a potential target around 48500. This aligns well with the March 2022 high of 48475, marking an initial upward goal. Moreover, there's room for further growth if we consider the prior rally as a flagpole and the recent consolidation as a midpoint, indicating potential for Bitcoin to advance even more.
Should Bitcoin surpass the 48500 mark, it could pave the way for a push towards 57555, which stands at the 78.6% retracement level of the entire downward movement from the November 2021 peak to the November 2022 low.
Disclaimer:
The information posted on Trading View is for informative purposes and is not intended to constitute advice in any form, including but not limited to investment, accounting, tax, legal or regulatory advice. The information therefore has no regard to the specific investment objectives, financial situation or particular needs of any specific recipient. Opinions expressed are our current opinions as of the date appearing on Trading View only. All illustrations, forecasts or hypothetical data are for illustrative purposes only. The Society of Technical Analysts Ltd does not make representation that the information provided is appropriate for use in all jurisdictions or by all Investors or other potential Investors. Parties are therefore responsible for compliance with applicable local laws and regulations. The Society of Technical Analysts will not be held liable for any loss or damage resulting directly or indirectly from the use of any information on this site.

Bitcoin short from 47k in cme futures.The retest that i was waiting during the year of 2023 has just been met .
Even though i expected that retest to occur during the may or june of 2023 at 40k level, bitcoins price has just hit 47k in cme whilst on other exchanges it remains at 46k level .
I do believe this is bitcoins final push to the upside ,and this is a major sign for more downside to come .
Now all i think about is the gap at 20k level.
Now short mode is ON , every push to the upside is a short position for me.
The big short is coming , closer than ever , also waiting for 10th of january where i do believe that is priced in , and once etf approves it, btc will plummet just like it did in 2017 with cme futures.


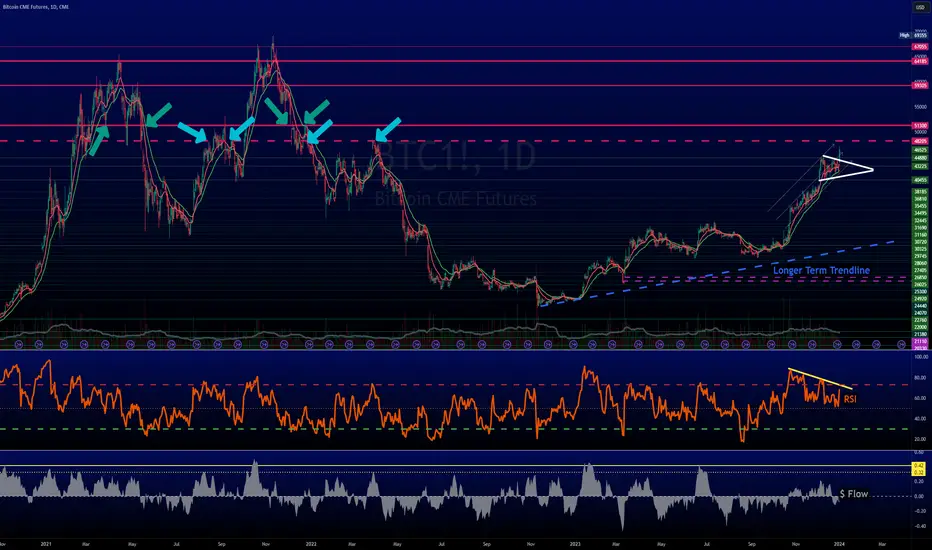
BTC held the 44kish call for 2023, 48-50k next before pauseGood Evening/Morning!
The call for CRYPTOCAP:BTC topping around the 44k range for 2023 was GOOD!
1st trading day and #bitcoin rips higher!
How's that for coincidence, huh?
The call for #BTC being in a temp pause & in a CONTINUATION pattern was GOOD!
IMO, the next level that #Bitcoin is most likely to test is the 48k with a good possibility of hitting low 50k area.
Let's continue.......
The RSI is still trending lower and $ Flow is not that great either.
Things can change though...
Why 48-50k? Arrows show the areas of resistance.
Even after breaking above this staunch resistance area, 50kish, Bitcoin didn't trade very long above it.
More on what we think later.... Still time...
For more info visit our profile page...
Insights into Bitcoin Futures as 2024 brings new regulations inIntroduction to Bitcoin Futures
Bitcoin Futures represent a significant intersection of traditional financial markets and the innovative world of cryptocurrencies. They allow traders to speculate on the future price of Bitcoin, providing a way to hedge against price volatility or to profit from price movements. As we step into 2024, the potential approval of spot Bitcoin ETFs is poised to further transform the landscape for Bitcoin Futures.
The Impact of Spot Bitcoin ETF Approval
Spot Bitcoin ETFs are directly tied to the current price of Bitcoin (spot price). Their likely potential approval by U.S. regulators could have substantial implications for the Bitcoin market. Firstly, it's expected to increase market liquidity by providing an accessible avenue for traditional investors to enter the cryptocurrency space. Secondly, it could lead to greater price stability and potentially higher prices due to increased demand. However, it's also important to consider the potential risks, such as amplified market reactions to regulatory news and changes in the underlying asset.
Parallel Analysis of Other ETFs
To understand the potential impact of a Bitcoin ETF, it's instructive to look at the introduction of other commodity and currency-based ETFs:
GLD (Gold ETF): Following the introduction of GLD, which is linked to COMEX Gold Futures (GC), the gold market saw increased liquidity and interest from new investor segments, contributing to significant price rallies.
GLD Performance Chart
SLV (Silver ETF): Similar to GLD, the introduction of SLV, linked to COMEX Silver Futures (SI), led to increased investor participation and price movements in the silver market.
SLV Performance Chart
FXE (Euro ETF): Linked to CME Euro Futures, FXE provided investors an easy way to gain exposure to euro currency movements, affecting trading volumes and price volatility.
FXE Performance Chart
USO (WTI Crude Oil ETF): Tied to NYMEX WTI Crude Oil Futures, USO's introduction affected the oil market by providing more access and potentially contributing to price movements during significant market events.
USO Performance Chart
Historical Implications for Bitcoin
The history of these ETFs suggests a pattern: the introduction of an ETF could lead to increased market participation and, often, significant price movements. For Bitcoin, the approval of a spot ETF could similarly increase market participation and price volatility, at least in the short term. Over the long term, it could help stabilize and mature the market as more institutional investors get involved.
Forward-Looking Insights
Given the potential approval of spot Bitcoin ETFs, traders and investors in Bitcoin Futures might expect several scenarios. An immediate increase in volatility could be likely as the market adjusts to the influx of new participants. Over time, we might see a more liquid and stable Bitcoin market.
Planning for a Risk-Defined BTC Opportunity:
Risk Management : Experienced traders prioritize risk management. Using stop-loss orders or hedging techniques is imperative to avoid undefined risk exposure.
Precision in Entries and Exits : Aligning entries and exits with relevant market price levels can help manage risk. When a price point generates a bounce, the trader stays in the trade; if a price level is violated, the disciplined action is to exit the trade promptly for a predetermined loss.
Relevant Price Levels for BTC : Currently, BTC shows relevant resistance levels starting at 51,585 and support between 39,640-34,295.
Proposed Trade Plan:
ENTRY: 39,640
STOP-LOSS: 34,295
TAKE PROFIT TARGET: 51,585
This trade plan offers a 2.23 Reward-To-Risk ratio, providing a structured approach to capitalizing on potential market movements.
In order to manage risk and use the right contract size, traders need to take into consideration the Point Value for BTC Futures being $25 per point.
Traders should prepare for both the opportunities and risks this change could bring, considering strategies that allow flexibility and risk management.
Conclusion
The potential approval of spot Bitcoin ETFs in 2024 is set to make waves in the Bitcoin Futures market. Drawing parallels from the history of other ETFs, we anticipate increased market participation and potential price movements. As we navigate this evolving landscape, staying informed and adaptable will be key to capitalizing on the opportunities and navigating the challenges ahead.
When charting futures, the data provided could be delayed. Traders working with the ticker symbols discussed in this idea may prefer to use CME Group real-time data plan on TradingView: www.tradingview.com This consideration is particularly important for shorter-term traders, whereas it may be less critical for those focused on longer-term trading strategies.
General Disclaimer:
The trade ideas presented herein are solely for illustrative purposes, forming a part of a case study intended to demonstrate key principles in risk management within the context of the specific market scenarios discussed. These ideas are not to be interpreted as investment recommendations or financial advice. They do not endorse or promote any specific trading strategies, financial products, or services. The information provided is based on data believed to be reliable; however, its accuracy or completeness cannot be guaranteed. Trading in financial markets involves risks, including the potential loss of principal. Each individual should conduct their own research and consult with professional financial advisors before making any investment decisions. The author or publisher of this content bears no responsibility for any actions taken based on the information provided or for any resultant financial or other losses.

$BTC_F: Bitcoin CME futures chart is strongBitcoin futures chart looks TREMENDOUSLY bullish...
I was looking at protective puts in case of a negative SEC decision causing a black swan decline but this chart makes me think it's not necessary to buy insurance here. (although payoff was like 22 to 1 for OTM puts expiring by Jan 12th)
If this signal here works, the 'Explosion Pattern' in the latest accumulation pattern suggests a 2 to 3x target range move within 13 trading sessions.
Crossing fingers, let's see if this analysis is correct, weight of evidence across the board is with the bulls here.
Cheers!
Ivan Labrie.

BTC liquidation map Hello! I am still adhering to our previous idea, but with a slight emphasis on a new perspective. Instead of focusing on traditional analysis, let's pay attention to liquidity zones and potential opportunities for correction.
Let's consider the liquidation map: we are focusing on 34k as a key level, where the largest liquidation of long positions is observed, estimated at over 6 billion! This confirms that the majority of market participants are still choosing long positions. And this is indeed a smart move, as our trend is long. We must act in accordance with the trend and not look for reversal points unnecessarily.
But, as you know, I always strive to be prepared for any scenarios. Therefore, I have left a limit order in this potentially key area to be ready for unexpected market movements.
👉 Remember: flexibility and adaptability are the keys to success in investing. Stay tuned for updates!

Days before BullBull gon be the next few days , btc will continue the corecction , after that will break the higher resistance zone and reach to 49-52k ,Then Dumps to the 20's k

btc 2 year price predictionrandom predictions for 2024 and 2025 for bitcoin
189k by 10/13/2025
Bitcoin ETF approval coming january 8th, trading january 15th. 100k by end of year.

Lil more data on BTC and ETHAdding more to previous post
Did not notice the CRYPTOCAP:BTC DAILY $ FLOW - Kinda gross, really fell off.
#BTC RSI has been weakening for a bit, we've mentioned this few times.
#bitcoin is once gain testing the Green Mov Avg.
CRYPTOCAP:ETH RSI & $ FLOW, like BTC, is weakening.
Volume has been trending lower.
#ETH is still on an uptrend but it is facing pressure.
Weekly, #ethereum is still okay but consolidation is very likely.
#crypto
Please see profile for more data. More info there.

BTC1!Each of last 3 weeks we've sold off after CME open to test lower bound of this parallel channel that has supported price since late October..
This week's selloff includes a convenient backtest of the mid of the whole move (50% retrace of all-time high from lows), which is good place to position long from imho
Will we simply reclaim lower bound of channel and then send to upper bound of channel? Or is this time different?
My money is on upper bound of channel next..

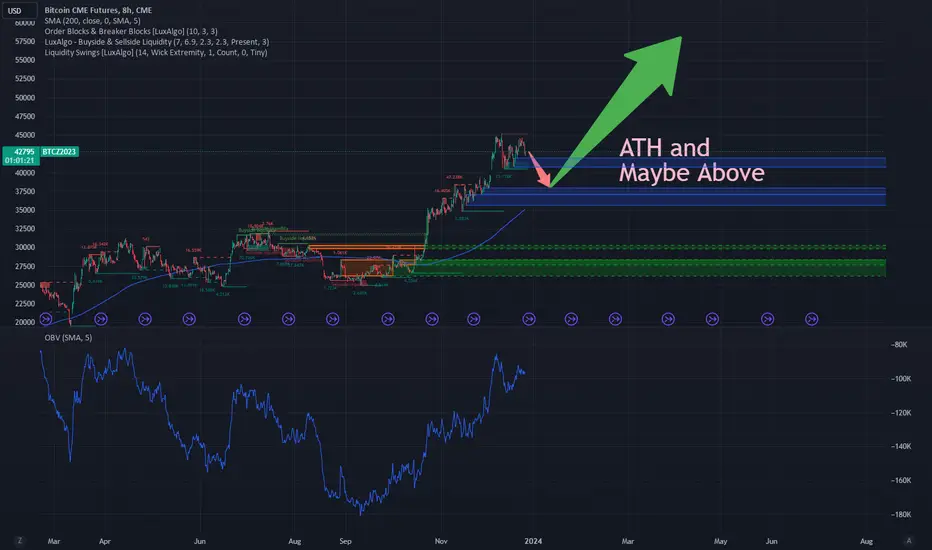
Bitcoin is Mooning and will Moon MoreEven though many investors are skeptical about the rapid rise of Bitcoin, from our perspective, the primary coin has established a stable upward trend that is unlikely to end soon.
It is anticipated that there may be another pullback to the $38,000 range to fill the futures gap.
Additionally, this area represents a zone of high liquidity. Overall, it currently appears that the price will subsequently continue its upward trend.
Price targets are in the range of the all-time high (ATH) from November 2021 and potentially beyond.
Bitcoin Futures: A Quantitative Approach to Analyzing BTCIntroduction to Bitcoin Futures
Bitcoin, the pioneering digital asset, has carved a niche in the financial markets with its futures contracts. Bitcoin Futures provide traders and investors a regulated avenue to speculate on the price of Bitcoin without holding the actual cryptocurrency. This article delves into a quantitative analysis to analyze the next week's potential value of Bitcoin Futures, employing a sophisticated Neural Network model.
Current Market Landscape
The Bitcoin market is known for its rapid price movements. Recently, regulatory news, technological advancements, and shifts in investor sentiment have contributed to market fluctuations. Understanding these trends is crucial for traders looking to navigate this dynamic landscape.
Quantitative Analysis of BTC Futures' Potential Price Movements
Neural Networks & Machine Learning: At the heart of our quantitative approach is a Neural Network model. This model has been trained on historical weekly data of Bitcoin Futures, including key price points and other relevant market indicators.
Data Preprocessing: To ensure accuracy, the data underwent rigorous preprocessing, including normalization to make it suitable for the Neural Network. This step is essential in highlighting the true patterns and trends in the data without noise or scale issues distorting the model's view.
Model Training: Our model was trained over 500 iterations, adjusting its internal parameters to minimize prediction error. This training process involved feeding the model historical data and letting it learn from the actual price movements.
Evaluation and Prediction: After training, the model's performance was evaluated. The actual prices were compared against the model's predictions to assess robustness. This evaluation is crucial in understanding the model's reliability.
Impact of External Factors
Bitcoin Futures are affected by a range of external factors, including regulatory changes, market sentiment, and technological developments. These factors can cause sudden and unpredictable market movements, making the analysis of future potential prices challenging. Our model takes into account the historical impact of these factors, but it's important to remember that unforeseen future events can lead to deviations from predicted values.
Forward-Looking Market Views
Based on our Neural Network's learning and the recent market data, the model predicts that the value of Bitcoin Futures for the next week will be around "$44,026.60". This prediction is visualized in our graph comparing actual prices against predicted values over time, providing a clear view of the model's accuracy.
Given the fact that the current value of BTC is slightly under 43,000, a trader could plan a long trade targeting 44,026.60 as their exit price. Entries could be taken in many ways such as utilizing key technical supports or waiting for breakouts above key resistance price levels. In all cases, a professional approach to taking risk in the marketplace always require managing such risk using stop-loss orders and making sure the trade size has been pre-calculated. There are many more options on how to have a contingency plan in place in case BTC moved in the opposite direction our AI expected it to. More on this in future articles.
The model's learning curve, depicted in the accuracy graph, shows how the prediction accuracy improved over training iterations, reflecting the model's increasing proficiency at understanding the market.
Conclusion
Our quantitative analysis, utilizing a sophisticated Neural Network model, provides a prediction for the next week's value of Bitcoin Futures. While this prediction is grounded in historical data and advanced algorithms, it's important for traders to consider the inherent volatility and unpredictability of the Bitcoin market. The predictive model is a powerful tool, but it should be used as part of a broader strategy that considers market news, economic reports, and other indicators.
When charting futures, the data provided could be delayed. Traders working with the ticker symbols discussed in this idea may prefer to use CME Group real-time data plan on TradingView: www.tradingview.com This consideration is particularly important for shorter-term traders, whereas it may be less critical for those focused on longer-term trading strategies.
General Disclaimer:
The trade ideas presented herein are solely for illustrative purposes, forming a part of a case study intended to demonstrate key principles in risk management within the context of the specific market scenarios discussed. These ideas are not to be interpreted as investment recommendations or financial advice. They do not endorse or promote any specific trading strategies, financial products, or services. The information provided is based on data believed to be reliable; however, its accuracy or completeness cannot be guaranteed. Trading in financial markets involves risks, including the potential loss of principal. Each individual should conduct their own research and consult with professional financial advisors before making any investment decisions. The author or publisher of this content bears no responsibility for any actions taken based on the information provided or for any resultant financial or other losses.
