#bitcoin #btc has closed a historical #CME #GAPAs you see on the chart, there was very important #CMEFUTURES gap at 35 - 36K area which was opened in #luna collapse times. Now, #btcusdt price has CLOSED this historical gap and what now?
It' s too early to say #btcprice will go on through the #bullrun or " BTC will directly go to close the OTHER historical GAP at 20 - 21K region!.."
Now, just relax and watch the #market and especially #BTCdominance. #BTCD will reveal the direction of the market. I will update my thoughts.
As you see on the chart, there only 1 #CME #FUTURES #GAP left at 20 - 21K region. Don' t underestimate this and also don' t be pessimistic, just carefully watch #bitcoin moves.
NOT FINANCIAL ADVICE. Dyor.
BMC1! trade ideas

BTCUSD - CME Gap Filled Down OnlyKuwa mwangalifu! Cuidado! Be careful! Pas op!
CME Gap has been filled!

BTC CMENow BTC CME Gap is filled.
This trading plan incorporates mechanical strategies along with smart money concepts.
Please be aware that investing in FX, Crypto, or any financial instrument carries inherent risks. It's advisable to consult a financial advisor or conduct thorough research before making any investment decisions.

CME gap filled on fake news. Headlines read Blackrock spot Bitcoin ETF lists… This application will not have an answer till after the new year…. DYOR for facts and don’t trade on headlines. Meanwhile the short liquidations are brutal beyond belief. I don’t believe the head and shoulders pattern is negated unless we close the week above the close at head. (32kish). My bet is that we will not close the week above. I entered a trade at CME gap and plan to ride the wave down. If I’m wrong then my stop is set just beyond. Good luck

Will Bitcoin do a repeat of 2019-2020?Banking Crisis and Technical Rallies
If there is one thing that is fundamentally bullish for crypto its bank failures. Crypto was built for this: banks becoming insolvent and the inability to trust the Fed or a third party to secure your wealth and value.
And we have gotten nothing short of a major rally over the past few weeks on the back of what has happened. With the Fed, Swiss, and ECB being forced to provide liquidity for failing banks, this rally in crypto could continue. Especially as a bunch of billionaires from Silicon Valley Bank need to store some of their wealth outside the banking system. Crypto is perfect for this.
From a technical perspective, we have had some key developments that line up and we can dive into some analysis to see where things may be headed.
I want to look at 2019 to early 2020 as I think this comparison is shaping up very closely.
Notice the orange triangle pattern - The last time we had this type of capitulation when Bitcoin fell to ~$3,000, it marked the bottom. At this juncture, a lot of people thought the end was nigh. We had a similar capitulation event occur which lead to the same triangle formation on the back of the failure of FTX. The capitulation event in 2019 marked the bottom. So far the failure of FTX, Celsius, 3AC, and others has marked the bottom of this cycle. The fractal is strikingly similar
2019 was followed by a massive multi-month rally which took Bitcoin back to its 50% retracement from its previous high. If we were to do something similar it would put us in the $40,000- $45,000 range or just shy of that in the 37-40k range.
Some technicals:
1. Weekly MACD is positive and sloping up.
2. Moving averages on the daily time frame are sloping positively.
3. The weekly 9 MA is crossing above the 200 MA.
4. RSI is showing strength.
Between technicals and Bank failures, we could see Bitcoin and the rest of crypto continue to run higher from here.

$BTC forms Head & Shoulder BUT has chance to rally hugeCRYPTOCAP:BTC must begin to break above this area in order to annul the ominous head & shoulder pattern that it is forming.
RSI looks pretty healthy at the moment.
Volume has been heavier than recent with slight buy bias.
CMF = $ Flow looks mediocre. However, there's a small increase.
Weekly, #BTC has not closed above 31100 for all of 2023. A close above could cause shorts to cover and fuel to rally more.
#Bitcoin

Bear or Bull next?... a detailed analysis Bullish:
1. W1 C&H, tgt 41,260
2. D1 gap ~35,500
3. Possible continued bullish action if DXY drops. (Looking soft the past few days, but has possible TA tgts up to $130-ish.)
Neutral:
1. USDT is in a symmetric triangle on HTF.
Bearish:
1. unable to break above Jul 19, 2021 low wick range 31,760 - 29,215 (yet)
2. poss H&S forming, tgt 21,455
3. D1 gaps below current price: (apx) 29,800, 27,150, 26,300, 20,700, 20,000
4. Below solid yellow TL and dotted yellow TL
5. PA currently in peak of shoulder wick zone (red)
6. candles & volume only appear to show mild strength thus far
Conclusion:
The next few days are "make or break". For bullish continuation PA needs to break above and hold 31,800 on a daily close. This will invalidate the HNS and simultaneously be a clearing of the Jul 19, 2021 wick zone.

BTC1!Previous two upthrusts this year, in April and July, have fallen short, but I believe this 3rd ETF hyped one is setting up to fill CME’s 35925 gap before end of year.

Bitcoin CME GapsThese CME gaps have a tendency to get "filled” – meaning that the market corrects back into the gap. While sources struggle to agree on the exact percentage, most of them agree that at least 65% of CME gaps are filled eventually.
..................................................................................................................
We are not registered or licensed in any jurisdiction whatsoever to provide investing advice or anything of an advisory or consultancy nature.
and are therefore are unqualified to give investment recommendations.
Always do your own research and consult with a licensed investment professional before investing.
This communication is never to be used as the basis of making investment decisions, and it is for entertainment purposes only.

BTC if grow up it wont across the level 48000 (shorting level)Hello kind traders
As I draw on my chart the best corredor of shorting is around the bleu lines ans specially 48000. then it can reach the TPs I mentionned on chart
Remeber that I do not have a cristal ball predicting markets move, but I try to be efficient and rational
Good luck

BTC - LongGood luck to everyone! This analysis is for educational purposes only and does not constitute financial advice. Conduct your own analysis before making trading decisions.

$BTC move is rumor & selling HEAVYOct 11 was last CRYPTOCAP:BTC post we made. There was a slight neg bias and it sold off a bit. Haven't posted much on it as we've focused on #equities & economic data.
Did notice 3 days of #BTC holding support area & not shocked at todays move. Bounced at recent uptrend, did not draw it in.
Notice anything? Look at volume & money flow. This #Bitcoin move is SHORT covering and there is a lot of selling here.

Bitcoin - Short; For now... Then, dependent on what happens around the $20,000 level, up, then down, ... etc., etc.
This is all speculation, of course, then again, that is the name of the game. - Right?!
Trade it as it unfolds.

An alternative strategy/analysis "CME GAPS"Just a simple analysis or strategy for everyone to understand but please do your own research!
-As you can see, after every gap is formed and after the price fluctuates, it will eventually return to the unfilled gap levels.
What are CME GAPS?
CME gaps refer to the difference between the trading prices of Bitcoin futures contracts when the market closes on Friday and reopens on Sunday. The gap occurs because there are no trades between the closing period on Friday and the opening on Sunday. The gap can also occur during holidays when the CME is closed. A gap is an unfilled interval on a chart, and it usually occurs when price sharply moves up or down with very little to no trading occurred in between.

$BTC weakening & comparison of Futures vs Spot, AGAINCRYPTOCAP:BTC is weakening further. Although the CMF shows TINY accumulation.
#BTC MACD histogram shows a slight neg divergence. This means that there is a decent chance MACD crosses over, negative.
Find it interesting that the Head & Shoulders neckline is right at the Nov 2022 bottom #Bitcoin trendline, blue dotted line.
--------------------------
Now let's compare Futures vs Spot
RSI on spot CRYPTOCAP:BTC is much weaker compared to derivatives.
CMF shows huge differences between Futures vs Spot #BTC:
Futures Sold off & slow grind up vs Spot volatility
This was short covering vs Spike = false reading
Countless examples over the years on why using #bitcoin futures/derivatives charts is better, #crypto

BTC UpdateI think it'll hit the July high again, but then again, I'm thinking the stock market will as well, and that's a safer bet.
It hasn't been trading with the market on a day to day basis but for the most part, BTC is trending with the general market. Other cryptos are in the garbage pile along with garbage stocks like PTON, SFIX, FCEL, BLDP, etc.
VFS stock shows how quickly bubbles die in a high interest rate environment. I don't recommend cryptos, but just posting this because I know some of my followers trade crypto and I plotted it so might as well post it.
$BTC needs to wake up FAST🚨🚨🚨
We pointed out the Heads & Shoulder pattern few weeks ago.
For an idea of how dangerous this pattern is, look at how bad the TVC:DJI CBOE:SPX & NASDAQ:NDX were recently hit.
There's a tiny amount of CRYPTOCAP:BTC accumulation, CMF.
Weekly
#BTC had a bullish crossover but it was WEAK. Not strong at all.
For the moment, #bitcoin is still trading above its moving averages.
It has lost a lot of steam lately. Needs to wake up FAST.
#crypto

$BTC $31K - $36K gap explainedHere we attempt to show the reason many chartists expect CRYPTOCAP:BTC to make a quick move to $36,000+ once we clear 31K to 32k.

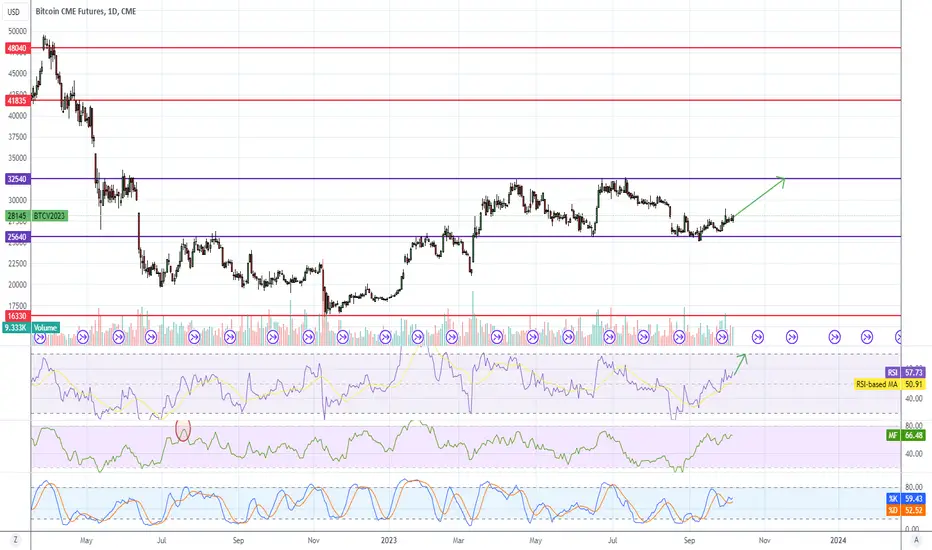
#btc short term strategy #bitcoin setup There are 2 GAPs in CME Futures #btcusd chart. I expect BTC to visit this gaps. My expectation is not only set on gaps. Also there is an important long liquidation zone exist. And also #DXY the #dollarindex is still moving upwards.
NOT FINANCIAL ADVICE.

BTC CME gaps to be filled We are entering an important zone ➡️ above previous high and around 0.5fib...
Let's wait and see if we support or lose the R/S line. When lose, I close my long CRYPTOCAP:BTC position and start to look for short setups... If we support, we will continue 🐨
Be alert...
#trading #bitcoin

An Extreme GAP Strategy for #bitcoin #btcIn the chart you' ll see the CME GAPs. Market maker will want to price #btc to these zones. There' s also a huge liquidation these points and also 23500. Sooner or later, these three prices must be visited. The second variation may be like : First 23500 then 20000s and then 35K.
NOT FINANCIAL ADVICE. These are only my notes. DYOR.

Understanding Bitcoin CME Gaps: Importance/Trading StrategiesBitcoin CME Gaps are price gaps that occur in the Bitcoin futures market, specifically on the Chicago Mercantile Exchange (CME). These gaps happen when the closing price of a Bitcoin futures contract on the CME differs significantly from the opening price of the next contract. Here's why they are important and how to trade them briefly:
Importance:
Technical Analysis: Traders often pay attention to CME Gaps because they can act as significant support or resistance levels on Bitcoin's price chart.
Market Psychology: These gaps can signal abrupt shifts in market sentiment, which can influence future price movements.
Volatility: Bitcoin is known for its price volatility, and CME Gaps can exacerbate price swings, making them important for risk management.
How to Trade:
Fill the Gap: Some traders believe that CME Gaps tend to get "filled" eventually, meaning that Bitcoin's price will return to the level of the gap and close it. They might place buy orders just above the gap and sell orders just below it.
Confirmation: It's essential to wait for confirmation before trading CME Gaps. This can include observing price action, volume, and overall market sentiment.
Risk Management: Trading CME Gaps can be risky. Use stop-loss orders to limit potential losses, and don't bet too much of your capital on a single trade.
Remember that while CME Gaps can be significant, they are not foolproof trading signals, and trading cryptocurrencies is inherently risky. It's crucial to have a well-thought-out trading plan and consider other factors, such as fundamental analysis and market news, in your decision-making process.

BTC: Is this Choice a Prelude to a Storm?In the world of cryptocurrency, the winds of change are ever-shifting. Bitcoin, the pioneer of digital currencies, has seen its fair share of ups and downs. Today, as we witness its return to familiar territory, the question that looms large is whether this is the calm before the storm.
The cryptocurrency markets are known for their volatility, and Bitcoin's recent movements have raised eyebrows. Many are speculating that a significant downturn may be on the horizon. Could Bitcoin be poised for a rapid descent, preparing itself to welcome the giants of the corporate and institutional world?
As we delve into the intricacies of Bitcoin's current trajectory, join us on a journey through the highs and lows, and explore the factors at play. Is this the moment when Bitcoin finds its true place in the financial landscape, or are we on the verge of a seismic shift that will reshape the crypto industry once again?
Stay tuned as we unravel the mysteries behind Bitcoin's return and what it may signify for the future of digital finance.
