LOOKS LIKE BULLISH STRONGER as shown on the chart we have very strong resistance levels front for the price
once it can close above them will open the way to retest the above resistance as shown on the chart
once we got weak signal and rejection thats mean we back to support levels below
wish you happy trade
SDX1! trade ideas

DXY - What's next! DXY - What's next!
$DXY - We are within the ranges of lows: 103 1/2 areas highs: 105 3/4 areas
A break above or break below.
Trade Journal

US DollarUS Dollar - Continuous Weekly: Looking for support in the 102 to 103 area. Still unsure if this potential low would be for a bear market rally or a swing low for a correction move in and continue up in the bull market

DXY Action Areas Ahead Of CPI & FOMCIn this update we review the recent price action in the DXY and identify pivotal trade locations and price objectives to target

dxy, 12-12 updategood evenin',
wasn't too long ago when i called the top on the dxy.
all the dxy bull bro's were like, no way man its going to go up forever.
>okkk boomer, 😏
---
so here's my take on what comes next.
theorizing a bit into the future here-
idea goes like: we correct down in 3 waves, then put in an equal sized leg to the upside into the 120~130 region in
---
original post:

Dollar hanging onto key levelThe United States Dollar Index managed to not develop new low this week as it trades in consolidation at 105 key region.
However, downside momentum seem to limited as 50 exponential moving average has multiple contact within a short period.
We may potentially see upside movement of the Dollar potentially towards the 107.155 resistance region.
However, if the Dollar Index is to make a new low, we will have a bearish confirmation of the Dollar.

US Dollar Produces Textbook Chart Pattern!The Dollar Index was contained inside an area of consolidation from January 2017
to June 2022 before finally breaking out to the upside above $103.
Price had a clean run producing strong bullish candles through to September 2022,
moving from $103 to $114.
Exhaustion then crept into this asset, causing a decline in price, which was to be
expected based on its history of deep pullbacks against the flow of the trend.
We are currently seeing a textbook pattern where price breaks out of consolidation
and retests the consolidation area.
If this unfolds as expected, we should see a bounce from support and a resumption
of the prior bullish move.
At the time of writing, December’s candle is displaying as an indecision candle,
but as we are early in the month, the shape of the candle is likely to change.
If price moves up again, we will likely see volatility flow into a number of forex pairs
producing opportunities to open positions in this market.
If you enjoyed this post, make sure to like, and follow for more quality content!
If you have any questions or comments, comment below. We reply to every comment!
See below for more information on our trading techniques.
As always, keep it simple, keep it Sublime.

DXY 104.40 Target Achieved New Pattern EmergingIN this update we review the recent price action in the DXY futures contract and identify the next high probability trading opportunity and price objectives to target

Bites Of Trading Knowledge For New TOP Traders #18 (short read)Bites Of Trading Knowledge For New TOP Traders #18
----------------------------------------------------------------
What is the Blockchain? -
The Blockchain is a decentralized ledger that is append-only meaning that data can only be added to it. Once information is added, it is extremely difficult to modify or delete it. The Blockchain enforces this by including a pointer to the previous Block in every subsequent Block.
The pointer is a Hash of the previous block. Hashing involves passing data through a one-way function to produce a unique Fingerprint of the input. If the input is modified even slightly, the Fingerprint will look completely different. Since the Blocks are linked in a Chain, there is no way for someone to edit an old entry without invalidating the Blocks that follow, allowing a secure structure.
What Is a Blockchain Consensus Algorithm? -
A consensus algorithm is a mechanism that allows users or machines to coordinate the agreement of what is a valid block in the Blockchain in a distributed setting. It needs to ensure that all participants in the system can agree on a single source of truth. Types of consensus algorithms include Proof of Work (PoW) and Proof of Stake (PoS).
What is Proof of Work? -
Proof of Work (PoW) is a mechanism for preventing the same bitcoin funds from being spent more than once. Proof of Work consists of a consensus algorithm, which is a protocol that sets out the conditions for what makes a block in the Blockchain valid. It ensures the security and integrity of bitcoin’s distributed ledger.
RISKS AND OPPORTUNITIES FOR CORPORATES AND INDIVIDUAL INVESTORS -
Common application of financial market instruments for managing risk and opportunities.
Hedging Portfolio Risk
Hedging bitcoin exposure with the Bakkt ® Bitcoin (USD) Cash Settled Monthly Futures (BMC) contract is a way to manage portfolio risk by taking a directional position opposite to the underlying asset as protection.
For example, a hedger may have plans to hedge downward price movement in bitcoin using futures contracts based on in-house market and portfolio analytical processes. The market analysis may use common technical analytical techniques such as support and resistance to formulate the trade decision.
If bitcoin is expected to weaken as it nears the resistance area, the hedger may plan to enter into a short futures position using the Bakkt ® Bitcoin (USD) Cash Settled Monthly Futures contract under either price levels of $27,500 or $32,500 to lock in the value of their underlying bitcoin position. Alternatively, if the hedger was in a short bitcoin position and wanted to hedge their position as price rose, entering a long futures position above price levels $12,500 or $16,500 could be considered.
TRADDICTIV · Research Team
--------
Disclaimer:
We do not provide investment advice, nor provide any personalized investment recommendations and/or advice in making a decision to trade. Before you start trading, please make sure you have considered your entire financial situation, including financial commitments and you understand that trading is highly speculative and that you could sustain significant losses.

Is the Dollar breakout confirmed?The United States Dollar Index remains under pressure throughout the week while having a momentarily breakout of the key support region at 105.0.
Last Friday's candlestick closed with a wide shadow with a small body, possibly showing sign of market indecision.
With this, reversal towards the upside is still likely but only with confirmation and keep stop tight.
What are your thought?


Dollar downside pressure remains HIGH but is still supportedThe United States Dollar Index failed to keep its recovery in strength and fell back to low of the lower time frame range.
The Dollar Index downside pressure remain high as the FEDs minutes indicated slowing the pace of rate hikes being appropriate gave a more positive sentiments throughout the market.
A breakout confirmation of the key support region at 105.0 can indicate a shift in the medium to long term trend.

US DOLLAR MY MONTHLY VIEW.Hello ladies and gentlemen, according to my chart analysis of the U.S. DOLLAR INDEX FUTURES , there is a high probability of a decline towards the levels of 91.000 that we have see before in (2018-2019) ,we will see that level again with high probability based on my analysis in the next few months or why not next year .

DXY Bearish Below 108.70 Targeting 104.50Technical & Trade View
US Dollar Index Futures
Trade View
Bias: Bullish Above Bearish below 108.50/70
Technicals
Primary resistance is 108.50/70 watch for bearish reversal patterns here
Primary pattern objective is 104.50
Acceptance below 106 next pattern confirmation
Acceptance above 108.70 opens a test of 109.25
20 Day VWAP bearish , 5 Day VWAP bearish
Options Expiries for today’s New York cut
EUR/USD: 1.0050-55 (1.4BN), 1.0060 (408M), 1.0085 (247M), 1.0280 (853M), 1.0300-10 (1.94BN), 1.0315-20 (344M), 1.0330 (236M), 1.0350-55 (904M), 1.0395-05 (809M), 1.0475 (276M)
USD/JPY: 140.00 (900M), 141.25-30 (371M), 141.40-45 (225M), 141.75-85 (873M), 142.00 (491M), 142.50 220M)
USD/CHF: 0.9520-30 (395M)
GBP/USD: 1.1800 (303M), 1.1850-55 (341M)
EUR/GBP: 0.8725 (358M), 0.8750 (315M), 0.8775 (376M), 0.8800 (368M)
AUD/USD: 0.6600 (342M), 0.6700 (226M)

BTCUSDT FUTURE WEEKLY ANALYSEThe DXY is actually bullish on the weekly this means that BTC will continue dumping down SELL BTC

Dollar Index trading sideway, breakout will be crucial!Last week the Dollar Index met its measured target of the descending triangle breakout.
Bullish bias still remains as the Dollar Index continues to trade above the 200 simple moving average (SMA). To look for entries, let us zoom into the lower time frame in this week's analysis.
In the lower time frame, we can see that the Dollar Index is trading in consolidation awaiting for the next direction. Any breakout of the 107.155 resistance region would indicate the continuation of the current trend with the initial target of 109.00 region. Conversely, a downside breakout of the 106.16 region would like go below the major support level at 105.0.

Is the end of the upward trend: DXY?Hello and good evening friends
The bull market for the dollar can still continue, but it may take more time if a major correction takes place. If the analysis is canceled, the continuation of the correction pattern will be big
Good luck and be patient in your dealings

LONG USDXcasting backward 60 days IPDA most recent shift was to the upside on USDX, we retraced back into the range, and then got a rejection on that discount FVG. if you take note of the 113.850 lvl you would notice how clean it is and its also a round number in a premium array, I think that's where IPDA might wanna reprice USDX back to plus the short term sentiment has been bearish on USDX. in Addidtion we also have an underlying strong fed rate so USDX should make new highs and foreign pairs like GU,EU should make New lows

DXY 106 Target Achieved, New Pattern EmergingTechnical & Trade View
US Dollar Index Futures
Trade View
106 Target Achieved, New Pattern Emerging
Bias: Bullish Above Bearish below 108.50
Technicals
Primary resistance is at 108.50
Primary pattern objective is 104.50
Acceptance below 106 next pattern confirmation
Acceptance above 108 opens a test of 109.50
20 Day VWAP bearish , 5 Day VWAP bullish
Options Expirations For Friday’s New York Cut
EUR/USD: 1.0200-05 (839M), 1.0225 (687M), 1.0240-50 (597M)
1.0300-10 (1.19BLN), 1.0325 (678M), 1.0350 (206M)
1.0450 (2.7BLN), 1.0475 (268M), 1.0500 (566M)
USD/JPY: 138.90-00 (660M), 139.45 (567M), 140.00-05 (413M)
140.50 (1.4BLN), 142.00 (590M)
USD/CHF: 0.9425 (265M), 0.9535 (400M), 0.9875 (500M)
GBP/USD: 1.1700 (560M), 1.1750-55 (257M)
AUD/USD: 0.6650 (528M), 0.6660 (701M), 0.6750 (202M)
NZD/USD: 0.6120 (255M), 0.6150 (202M)
USD/CAD: 1.3160 (820M), 1.3200 (280M), 1.3250 (408M)
1.3300 (272M), 1.3325 (1.3BLN), 1.3350-65 (592M)
Institutional Insights
According to analysts at Credit Agricole ‘The USD has been seen as the key beneficiary of the unfolding global economic slowdown: (1) the US economy is more resilient than its European and Asian counterparts; (2) the Fed has emerged as one of the more hawkish G10 central banks in a boost to the USD’s real rate appeal; while (3) risk-averse investors continue to seek refuge in high-yielding USD cash. We expect the USD to peak only in Q123 as it remains supported by its status as a high-yielding, safe-haven currency. The fact that the USD is overbought and overvalued also means that the pace of any additional gains could slow down in the next 3-6M, however. Further out, depending on the severity of the global downturn, the USD should cede some ground vs other safe havens like the JPY and CHF –under a global ‘hard landing’ –or pro-cyclical currencies like the AUD, CAD, NOK, NZD, GBP and EUR –under a ‘softer landing’

US dollars LongUs dollar long.Many people was looking to go short on it, I will try for long.
1-Trend line Long. Weak break down for me.
CFTC report still long on USD.
Keep in my eyes and will see.
I take on H&S long

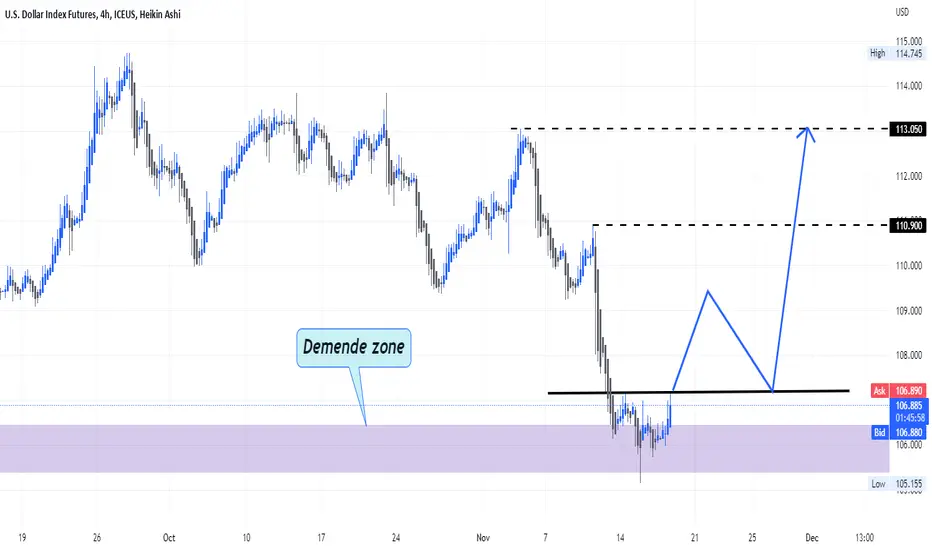
U.S. DOLLAR INDEX FUTURESU.S. DOLLAR INDEX FUTURES
The dollar has reached very strong demand areas. We can see a very strong rise in the event that some resistance areas penetrate
US Dollar buyers at AVWAP from YTD low.The US Dollar index seems to be finding buyers at the Anchored VWAP from the YTD low

Dollar Index possible level of reversalLast week, we mentioned that the Dollar Index has formed a descending triangle and the direction of the breakout would give us the indication of the next move.
Price broke out towards the downside and the next major support would be at the 105.00 orange region as indicated on the chart. This region can be seen as a major supportive level as it is:
1. Horizontal support
2. Measured Move of the Descending Triangle
3. Possible 200 SMA support if price continues within the downside
