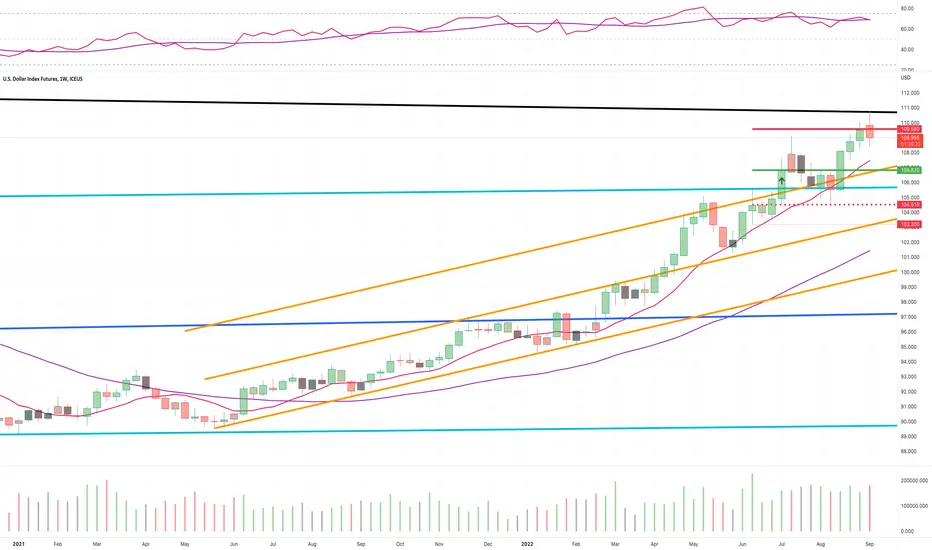
U.S. DOLLAR INDEX FUTURESGold achieved the goals and climbed to the top of a strong grandfather as we analyzed beforehand and achieved the goal of the price canal as well
SDX1! trade ideas

$DXY - It has been my best friend for while...$DXY - It has been my best friend for while...
We have a saying in trading: The trend is your friend until it breaks!
We reaching key areas, my longer term target if we break above 110 areas next 120 IF we get there. I do really like to keep an open mind to either direction. However, we had a large pull back this morning which makes sense to have. Keep an eye on the key areas we at break above or below shorter term and longer term the big question is - Is this a pattern brewing of a rising wedge to have a pull back medium term?
Things to keep in mind are the key fundamental data we had FOMC yesterday dovish and 75 hike it was expected the slimmer chance weeks went by of 100 and that did sound like a joke imo. However, we pulling back FX Majors check HT as it really key and we entering near end of month as well.
Remember: Follow your own trade plan, it will make you very successful.
TJ

DXY Targeting A 115 Test NextIn this update we review the recent price action in the DXY and identify the next high probability trading opportunity and price objectives to target

dollar index updateand finally it's end of wave 3 of terminal ,
Now it's clear that we are in Wave 3th continuing terminal and goes like this in couple of weeks

has dxy topped priced in everything yet ?I really doubt dxy go any further this year, 2.15 expansion really need to hold

DX1! - Weekly Market Update, 9/26US Dollar Index remains the BIG winner in the market these days on the backs of fed policies prompting a new opportunity for this to grind higher as the broad markets continue to get slaughtered.

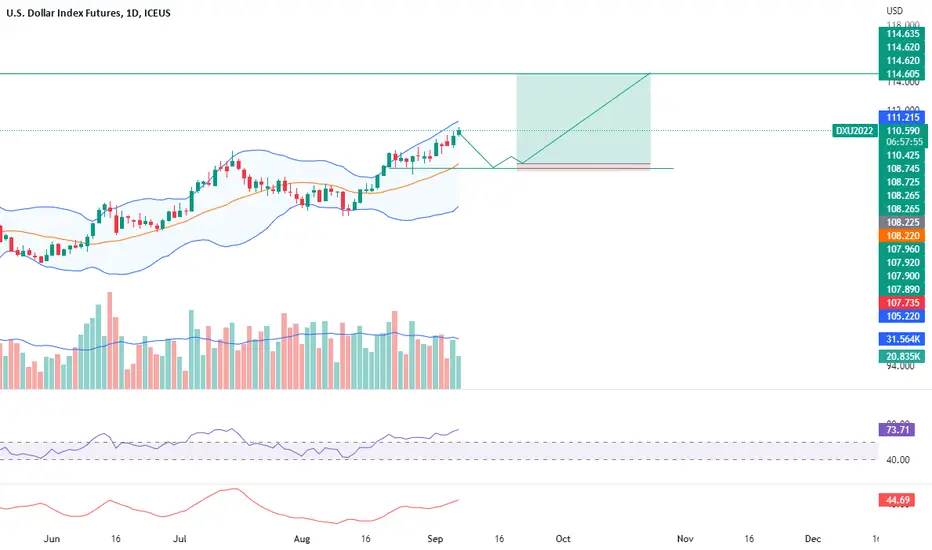
Elliott Wave View: Dollar Index (DXY) Bullish Cycle Looks IncompShort term Elliott Wave view on Dollar Index (DXY) suggests cycle from 8.10.2022 low is in progress as an impulse Elliott Wave structure. Up from 8.10.2022 low, wave 1 ended at 110.786 and dips in wave 2 ended at 107.69. The Index has resumed higher in wave 3 with internal subdivision as another 5 waves in lesser degree. Up from wave 2, wave ((i)) ended at 110 and dips in wave ((ii)) ended at 109.27. Index then resumed higher again in wave ((iii)).
Up from wave ((ii)), wave (i) ended at 110.26, and pullback in wave (ii) ended at 109.35. Index resumes higher in wave (iii) towards 111.57, and pullback in wave (iv) ended at 110.612. Near term, while above wave (iv) low at 110.61, expect the Index to extend higher within wave ((v)) to complete wave 3. Afterwards, it should pullback in wave 4 to correct cycle from 9.13.2022 low before the Index resumes higher again. As far as pivot at 107.7 low stays intact, expect pullback to find support in 3, 7, or 11 swing for further upside. Potential target higher is 100% -161.8% Fibonacci extension from 8.10.2022 low which comes at 113.8 – 117.6 area.

DOLLAR projectionWait for this entry and excute the plan, the institution need to go down and buy for long term

DXY To Fade Above 111.50'sIn this update we review the recent price action in the Dollar INdex and identify the next high probability trading opportunity and price objectives to target

DX1! - Weekly Market Update, 9/19US Dollar Index had successfully hit our upside target last week.
Strength continues to rise as the broader market continues to weaken.

How To Trade the Trend with best EntryHey Traders here is a quick video that explains the best entry point when trading the trend.
Sometimes the market will give you early signals that the trend will continue. Knowing when to find these signals or reversals can really benefit us in our trading.
Enjoy!
Trade Well
Clifford

DXY - Flag Could Signal A Pop SoonDXY appears to be printing a tight contraction flag pattern potentially building upside cause.
Could be more trouble for stocks metals and crypto.
Not advice.


U.S. DOLLAR INDEX FUTURESStrong dollar Saud in recent days but has made a strong correction and Hwa is rising now there is a high probability of Saud to 110.47

Triple divergence of the weekly RSI on US Dollar Index Triple divergence of the weekly RSO in the US Dollar Index ahead of the US CPI and the FOMC points to a significant loss of upside momentum, we would allow for the possibility for the market to mean revert to its 20-week ma at 105.76.
Disclaimer:
The information posted on Trading View is for informative purposes and is not intended to constitute advice in any form, including but not limited to investment, accounting, tax, legal or regulatory advice. The information therefore has no regard to the specific investment objectives, financial situation or particular needs of any specific recipient. Opinions expressed are our current opinions as of the date appearing on Trading View only. All illustrations, forecasts or hypothetical data are for illustrative purposes only. The Society of Technical Analysts Ltd does not make representation that the information provided is appropriate for use in all jurisdictions or by all Investors or other potential Investors. Parties are therefore responsible for compliance with applicable local laws and regulations. The Society of Technical Analysts will not be held liable for any loss or damage resulting directly or indirectly from the use of any information on this site.

DYX Downside Target Achieved, What Next?In this update we review the recent rice action in the Dollar Index and identify the next high probability trading strategy and price objectives tot argte

DX1! - Weekly Market Update, 9/12US Dollar Index tests overhead resistance as anticipated.
We'll await a break above or a potential reversal from here lower.
USD Index Hits ResistanceUSD Index is coming impulsively higher in the 4-hour chart after a three-wave A-B-C correction in wave IV back in August, so the current recovery is a new five-wave rise. But it's a fifth wave that can be now in late stages here at 110 - 111 area. Divergence and potential wedge formation also suggest that the upside can be limited. Drop below 108.00 will suggest that the top is in place, at least a attemporary one. Also, the current DXY has a lot to do with EURUSD of course, which for now stayed about the recent low as European Central Bank President Christine Lagarde noted that they are ready for further hikes on upcoming meetings, taking the deposit rate into neutral territory.

/DX dollar index possible predictionAfter FED decision about interest rate in september 2022., dollar index could go to 102.
Dollar index will weak a little.
Dollar index of 102 will be if FED do not raise interest rate or reduce the interest rate (low possibility).
If the FED increases the interest rate by, for example, 0.75% and then interest is 3.25%, then dollar index will rise more to 120 (EURUSD 0.85) in next period - a very small possibility in September 2022.

20 Reason for Long DXYUpdate 07/09/2022
1 Structure 1/2: Bear
2 imbalances : Correction target marked
3 Current Move1/2 : Corrective
4 Entry TF : D1
4.1 ETF Structure: Bull
4.2 move : impulse
5 Support Resistance: Pull Back support waiting
6 FIB: waiting according to drawing for buy entry
7 candle Pattern: shrinking candles
8 Chart Pattern:
9 Volume : decrease correction now
10 Momentum: Bullish
11 Volatility : Divergence
12 strength: full favor of bulls
13 Sentiment : No1
14 Final Summary: go with Bull buys all signs are favor of buyer
15Buy /Sell/Wait : wait for buy
16 Entry:108.222
17 Sl: 107.555
18 Tp: 114.555
19 Risk to reward Ratio: 1:13
20 Excepted Duration : 45
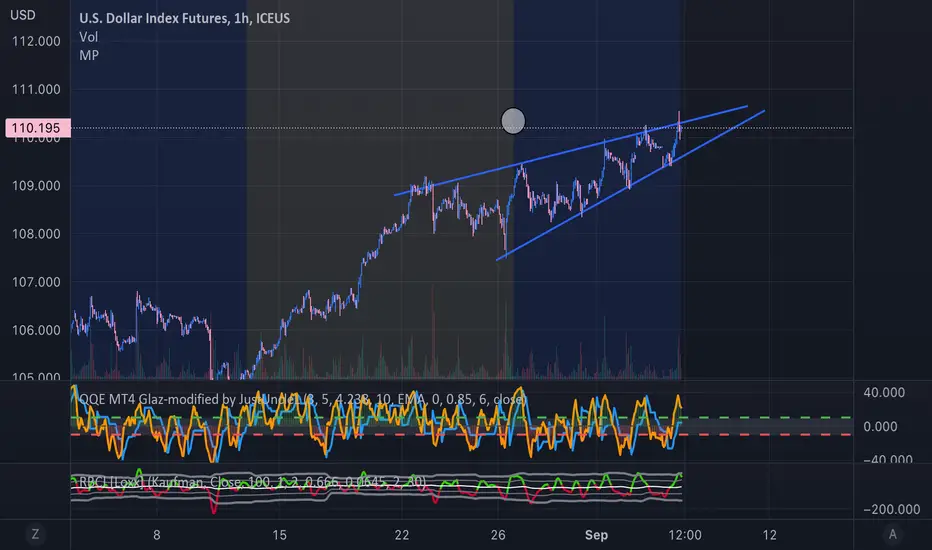
DXY is printing a reversal in ascending wedgeThe DXY seems to be printing into an ascending wedge after a long uptrend which is a possible reversal signal.
Some stats on ascending wedge (source: www.centralcharts.com)
- In 82% of cases, the exit is bearish.
- In 55% of cases, a rising wedge is a reversal pattern.
- In 63% of cases, the pattern’s price objective is achieved when the support line is broken.
- In 53% of cases, the price makes a resistance pullback on the rising wedge’s support line.
- In 27% of cases, false breaks (false exits) appear.
This will likely break down, and could signal another rally for stock indices and crypto.
I almost can't believe that markets could rally with the macro landscape, but Powell's recent messaging seems to be mostly ignored and traders are calling the fed's bluff. Watch into the CIE data the day before the fed minutes and rate decisions are made, and if the fed isn't posting super hawkish rate hikes, you could really get a run on some crypto assets through september despite the fact that it's historically a bearish month.
Dollar Index Up 5%The Dollar Index is up 5% since breaking above the resistance level at $103 in June 2022
and the buyers are looking strong for September so far.
Price was previously in consolidation between January 2017 and June 2022 and when
price consolidates for lengthy periods of time such as this, we can expect strong moves
in the direction of the breakout like we see at the moment.
There is a lot of clear space above price for it to continue climbing higher, so the buyers
may use this to their advantage.
This is the best time to look at the forex market, which has been sleeping for a number
of years now. Expect big long-term trends when markets come alive after a long period
of doing nothing.
If you like enjoyed this post, make sure to like, and follow for more quality content!
If you have any questions or comments, comment below. We reply to every comment!
See below for more information on our trading techniques.
As always, keep it simple, keep it Sublime.

Bites Of Trading Knowledge For New TOP Traders #15 (short read)Bites Of Trading Knowledge For New TOP Traders #15
----------------------------------------------------------------
What is an Interest Rate Differential? -
An interest rate differential is a change in the interest rates between the currencies of two countries. It is a measure of how money from two countries compares to each other.
What is the Carry Trade? -
The carry trade is where an investor borrows in a currency where the interest rate is low and converts those funds into a currency where the interest rate is higher.
For example, if one currency has an interest rate of 5% and the other has a rate of 1%, it has a 4% interest rate differential. If you were to buy the currency that pays 5% against one that pays 1%, you would be paid on the difference with daily interest payments.
RISKS AND OPPORTUNITIES FOR CORPORATES AND INDIVIDUAL INVESTORS -
Common application of financial market instruments for managing risk and opportunities.
Diversification: Portfolio Risk Using FX Futures
Portfolio diversification is the process of investing your money in different asset classes and securities in order to minimize the overall risk of the portfolio.
For both corporate and individual investors, having access to markets that enable the building of a diversified portfolio is an important consideration when managing futures focused accounts.
Similar to managing risk, the market to trade would be a key variable to clearly state and support with reasons for trading or investing. Reasons for selecting one market over another could include price volatility, liquidity, daily volume traded, size of the minimum price increment, and value of the minimum price increment. Comparing these variables between markets will help decide the suitability and/or risk of each.
For example, the parameters for a price driven strategy may be designed to be applied to any market whether it be index equity futures or forex futures. However, the signals for entry may not always trigger if a trader were just to focus on a single index equity futures. Having access to markets such as the Micro MSCI USA Index futures could add diversification to a portfolio in an efficient manner.
Having access to other futures markets to apply the strategy to allow for the creation of a diversified portfolio with varying entry and exit points or the ability for more trading oriented investors increased opportunities to execute price driven strategies more often across a range of futures markets.
TRADDICTIV · Research Team
--------
Disclaimer:
We do not provide investment advice, nor provide any personalized investment recommendations and/or advice in making a decision to trade. Before you start trading, please make sure you have considered your entire financial situation, including financial commitments and you understand that trading is highly speculative and that you could sustain significant losses.
