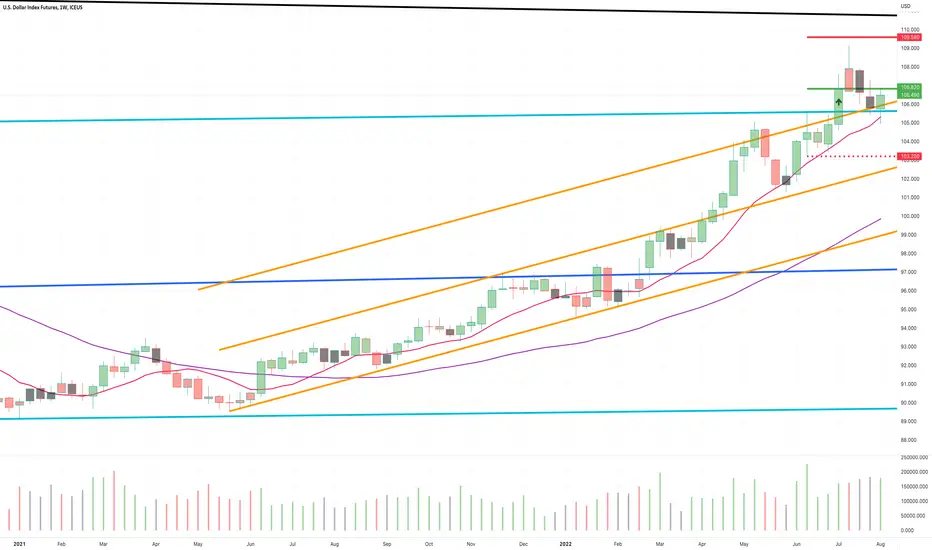
DX1! - Weekly Market Update, 8/8/22US Dollar Index posts a BUY signal ... Ideal entry, stop and target imaged on the chart.
Support and Resistance structures have been adjusted accordingly for your reference.
Wishing you a blessed and profitable week ahead.
SDX1! trade ideas
The dollar is in a bearish trend in a major correctionHello and good day. DXY is in a major correction, like its Euro counterpart, but in a bearish market. And it is likely to be a double zigzag or a big zigzag. Good luck and be patient in your trading decisions.

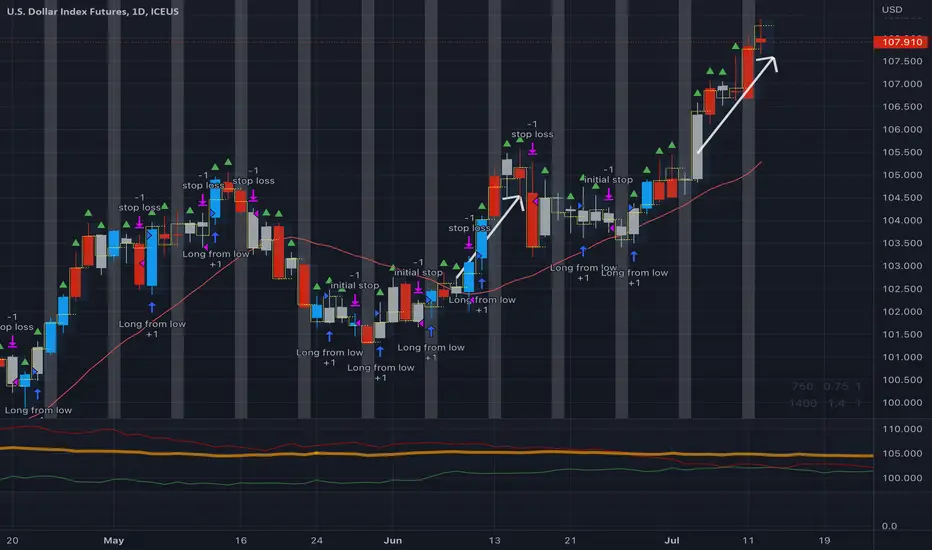
US Dollar Bounces Strong!The Dollar Index is a slow creeper and could prove to be a strong mover over the
next few months as it is forming a consistent pattern of higher highs and higher lows.
We saw a strong move to the upside on July 5th and price continued to move up
until July 14th which is where price started to pull back.
Price moved down to a cluster of support consisting of the 50 simple moving average
and the support level from the May 13th high at $105.06.
Price has now bounced off this level of support and forming a nice impulsive move
to the upside right now. If price can maintain this momentum, we should see a move
above the previous high at $109.14 from the high of July 14th.
If that breakout does transpire, then we are likely to see a long-term trend unfold in
the Dollar and other currency pairs,
If you like enjoyed this post, make sure to like, and follow for more quality content!
If you have any questions or comments, comment below. We reply to every comment!
See below for more information on our trading techniques.
As always, keep it simple, keep it Sublime.

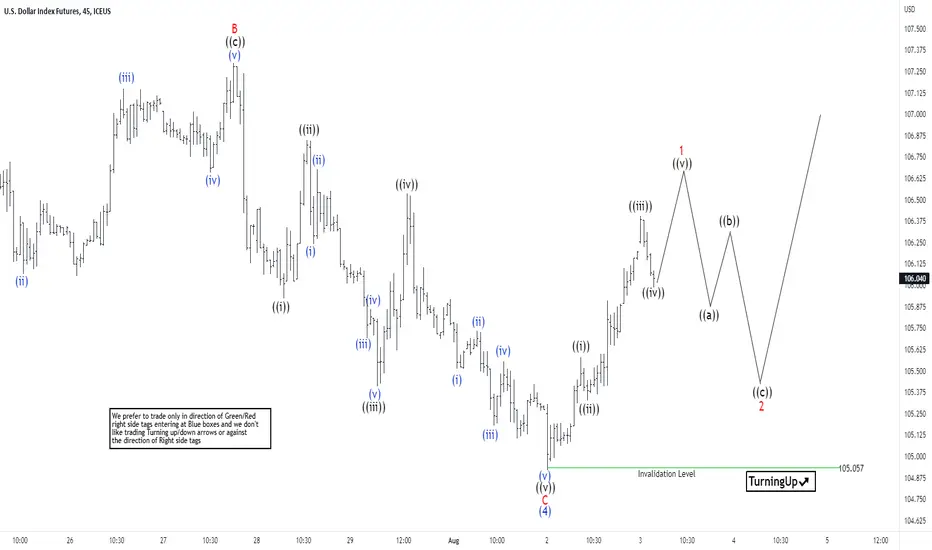
Elliott Wave View: Dollar Index (DXY) Resumes HigherShort Term Elliott Wave view in Dollar Index (DXY) suggests rally to 109.29 on 7.14.2022 peak ended wave (3). Pullback in wave (4) ended at 105.05 with internal subdivision as a zigzag Elliott Wave structure. Down from wave (3), wave A ended at 106.38. Wave B rally ended at 107.42. The Index then resumes lower in wave C which ended at 105.05. The 45 minutes chart below shows the internal subdivision of wave C in 5 waves. Down from wave B, wave ((i)) ended at 106.06, and rally in wave ((ii)) ended at 106.975.
Index resumes lower in wave ((iii)) towards 105.54, and rally in wave ((iv)) ended at 106.66. Final leg lower wave ((v)) ended at 105.05 which completed wave C of (4). The Index has turned higher in wave (5), but it still needs to break above the previous wave (3) peak at 109.29 to rule out a double correction. Up from wave (4), wave ((i)) ended at 105.7 and dips in wave ((ii)) ended at 105.45. Index then resumes higher in wave ((iii)) towards 106.55. Expect the Index to extend higher 1 more time to complete wave ((v)) of 1, then it should pullback in wave 2 to correct cycle from 8/2/2022 low before the next leg higher. As far as pivot at 105.05 low stays intact, expect dips to find support in 3, 7, or 11 swing for further upside.
DOLLAR LONGI am Looking Dollar Super Bullish In coming days Dollar facing Huge Demand Zone and Rising Trend Line any Strong Bullish Candle will Evidence For Further Bullish Move while Bullish Hidden Divergence showing Trend Continuation . A daily close My Rising Trend Line and Rectangular will Start Down Trend with Mention target

Dollar Index should consolidate a Cup & Handle patternThe USDollar index seemed to soften in the past week, also due to an unwinding incipit of the short Yen trade. However, the DXY chart seems to have shaped a bullish cup & handle pattern that should consolidate on the support area, DXY 103.75. The next risk-off stock market correction could see a further strengthening of the USDollar Index up to DXY 115.

My new vision for the dollar I think we have reached the top of the dollar .. The next period will be a decline and this will continuation of the rise of cryptocurrencies,
these and all the ideas on my page in Trading View are not a recommendation to buy or sell, I am posting them for my self only
Thanks

USD main driver any currency or transection My projection still bear until new election for US president because we need business minded person to grow the economic and country... good luck

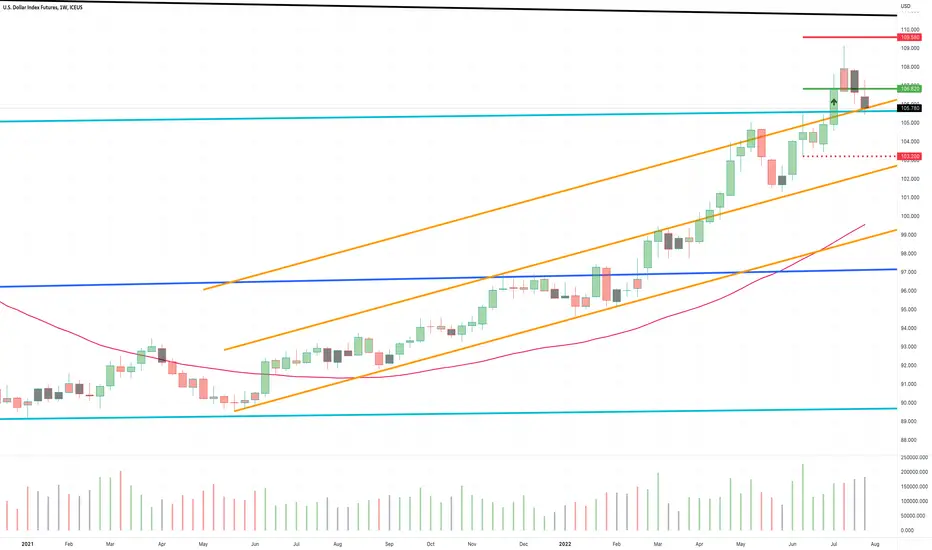
DX1! - Weekly Market Update, 8/1/22US Dollar Index testing support currently.
Ideal entry, stop and target imaged on the chart.
Support and Resistance structures have been adjusted accordingly for your reference.
Wishing you a blessed and profitable week ahead.
USD technicals damaged Looking at the USD futures, and interesting picture is starting to prevail...
The weekly chart is heading to a lower USD in the next couple of weeks. and to resume uptrend, it needs to reclaim above the green resistance line, which is unlikely at current status. RPM and MACD are burnt out and crossed down to a moderation in the coming weeks.
The daily chart accentuate that view as the FOMC rate raise of 75bp yesterday closed the day with a bearish daily candle and a lower low clocked today... so downside to the support over the next couple of weeks is likely. Technical indicators are all bearish crossed down too.
This has big picture effects... on equities, and commodities, which will be pushing up again, stoking more inflation. This is a major consideration in all my analyses going forward.
Much discussions going on everywhere about the economics of it, but the charts seems to reflect that the expectation is where the FOMC is done with raising rates for now... at least.
Watch what happens when the support level is met...


DXY reaching 36 years and 8 months old Resistance!!!I do not post traditional market stocks nor do I trade but I found this one somewhat interesting.
DXY will soon be reaching its 36 years and 8 months old resistance.
Reaching the resistance it has been forming since Nov 1985 (according to the data provided on tradingview)
It will be interesting to watch the coming months as the US economy is facing tough situations here.
Fall in GDP in two successive quarters.
What do you think?
How will it affect the stocks in the coming years?
I would love to know your views.
Let me know if you want me to look into some stocks.
Do hit the like button, it helps!
Stay safe
#PEACE

DXY in a correction of a greater degreeHello, good day to all my friends. DXV has started to correct in a larger degree and it is likely to execute a zigzag pattern. Crossing the center line of the channel is a confirmation of the bearish trend. Good luck and trade patiently.


DX1! - Weekly Market Update, 7/25US Dollar index posted a BUY signal a few weeks back.
Price popped and has since settled. Support is located below current price.
Channel structures have been adjusted accordingly for your reference.

DXY Trading The CorrectionIn this update we review the recent price action in the Dollar Index futures contract and identify the next high probability trading patterns and price objectives to target

DX1! - Weekly Market Update, 7/18/22US Dollar Index LONG trade from last week remains in play.
Trade details have been plotted on the chart for your review.

U.S. DOLLAR CURRENCY INDEX
For now, the former 103.80 resistance area is a support area that would be a good idea to test before moving further up.
Notice the market structure from 2000 to 2003.

DXY - reaching sell zoneDXY - is reaching sell zone. Watch for topping in that area. Then if rejected we may enter a dollar bear for a while and this will help gold and BTC.

Strong Dollar makes is tough on other marketsUS Dollar – Weekly continuous: Surpassed the Primary recover target at 102.25 and making highs not seen for 20 years.
My opinion. Cash commodities can struggle to keep upward momentum when US Dollar is strong. The world is experiencing a financial crisis it has not seen for several decades. The 07/08 recession Primarily hit the US with the Housing market bust and Dollars fled the US to other stronger currencies/assets. US Ag commodities were very volatile in the period but mostly strong with a weak dollar. If EU and Asian markets remain weak, safe haven assets like the Dollar could remain elevated to extremely high…Yet to be determined.
Open interest is/has been low in the commodity space, and we recently witnessed what a liquidity drain out of our markets from the big money can do. Major swings up and down to be expected in the nearby future.

Why are all assets except bonds going down? Answer: because of the fear /dollar index, as the dollar increase in value (investors pulling money out of assets)
Why not simly buy this future contract on any price above prior days high?
This was a highly profitable strategy with a trailing stop below prior days low.
US Dollar Up 3%The US Dollar has moved up 3% so far this month and entering price levels
we haven’t seen since 2002 and still climbing.
Price was previously in an area of consolidation, which ran from 2017. With a
breakout from a long period of consolidation, we can expect a strong move in
the direction of the breakout.
The 3% move to the upside this month equates to $3 and price may continue
to climb and if it does then forex pairs that the US Dollar influences are likely
to move as well.
The next level of resistance in the way is at $121, which is the high of July 2001.
A move to this level would create a trend large enough to allow us as trend-followers
to compound and profit heavily from such a move.
If you like enjoyed this post, make sure to like, and follow for more quality content!
If you have any questions or comments, comment below. We reply to every comment!
See below for more information on our trading techniques.
As always, keep it simple, keep it Sublime.

DX1! - Dollar Index Weekly Analysis, 7/11/22US Dollar Index has finally broken out with 1%+ confirmation.
I've identified the entry, stop and target. I personally would've liked to see more reward.
Support and Resistance structures have been adjusted for your reference this upcoming week.
Wishing you a blessed and profitable week!
