us dollaus dollar at these heights = gg for the markets.
keeping as simple as that.
the higher the us dollar goes, the more pressure is put onto the stock and cryptocurrency markets.
---
grand cycle w5 target = 113
expansion target = 116~119
---
stay safe out there o/
SDX1! trade ideas

Elliott Wave View: Dollar Index (DXY) Remains BullishShort term Elliott Wave view in Dollar Index suggests rally to 105.78 ended wave (1). Wave (2) pullback ended at 103.41 with subdivision as a zigzag Elliott Wave structure. Down from wave (1), wave A ended at 104.66 and wave B ended at 105.49. Index extended lower in wave C towards 103.41 to complete wave (2). Index has resumed higher in wave (3), but it still needs to break above wave (1) at 105.78 to validate this view and rule out a double correction in wave (2).
Internal subdivision of wave (3) is unfolding as a 5 waves impulse structure. Up from wave (2), wave ((i)) ended at 105.08, and dips in wave ((ii)) ended at 103.67. Index then resumes higher in wave ((iii)) towards 105.54, and pullback in wave ((iv)) ended at 104.64. Final leg higher wave ((v)) ended at 105.63 which completed wave 1. Pullback in wave 2 ended at 104.81 with internal subdivision as a zigzag in lesser degree. Down from wave 1, wave ((a)) ended at 104.95, wave ((b)) ended at 105.16, and wave ((c)) ended at 104.81. Near term, while dips stay above 103.41, expect the Index to extend higher.

US Doller index Goin to kill whole market For coming Weeks
Update 04/07/2022
1 Structure 1/2: Bear
2 imbalances : Correction marked
3 Current Move1/2 : Corrective
4 Entry TF : D1
4.1 ETF Structure: Bull
4.2 move : impulse
5 Support Resistance: CIP triangle
6 FIB: trigger event occurred
7 candle Pattern: flag
8 Chart Pattern: triangle breakout and CIP on same level cup and handle also
9 Volume : increasing till initial then low and now again increasing at breakout levels
10 Momentum: we measuring momentum via RSi sideways to bull mood right now
11 Volatility : support and intact with middle band
12 strength: full favor of bulls
13 Sentiment : extremely high 30+ rating
14 Final Summary: go with Bull buys all signs are favor of buyer
15Buy /Sell/Wait : buy
16 Entry:104.730
17 Sl: 104.1
18 Tp: 107 2nd 114
19 Risk to reward Ratio: 1:5
20 Excepted Duration : 15

Bites Of Trading Knowledge For New TOP Traders #13 (short read)Bites Of Trading Knowledge For New TOP Traders #13
----------------------------------------------------------------
What is Bitcoin and from where did it originate? -
Bitcoin is a digital form of a medium of exchange with no central bank control which issues fiat currencies. Instead, the financial system involving bitcoin is managed by thousands of computers distributed around the world, a decentralized ledger, where anyone can participate by downloading open-source software and connecting to the ecosystem.
The invention and implementation of bitcoin is credited to the person or persons known Satoshi Nakamoto in 2009. The white paper “Bitcoin: A Peer-to-Peer Electronic Cash System“ states that bitcoin was to be, “A purely peer-to-peer version of electronic cash would allow online payments to be sent directly from one party to another without going through a financial institution.”
What is the Blockchain? -
The Blockchain is a decentralized ledger that is append-only meaning that data can only be added to it. Once information is added, it is extremely difficult to modify or delete it. The Blockchain enforces this by including a pointer to the previous Block in every subsequent Block.
The pointer is a Hash of the previous block. Hashing involves passing data through a one-way function to produce a unique Fingerprint of the input. If the input is modified even slightly, the Fingerprint will look completely different. Since the Blocks are linked in a Chain, there is no way for someone to edit an old entry without invalidating the Blocks that follow, allowing a secure structure.
What is Mining? -
Mining is the process in which transactions between users are verified and added to the decentralized ledger. The process of mining bitcoin is responsible for introducing new coins into the existing circulating supply and is one of the key elements that allows bitcoin to work within the peer-to-peer decentralized network, without the need for a third party central authority.
What Is a Blockchain Consensus Algorithm? -
A consensus algorithm is a mechanism that allows users or machines to coordinate the agreement of what is a valid block in the Blockchain in a distributed setting. It needs to ensure that all participants in the system can agree on a single source of truth. Types of consensus algorithms include Proof of Work (PoW) and Proof of Stake (PoS).
What is Proof of Work? -
Proof of Work (PoW) is a mechanism for preventing the same bitcoin funds from being spent more than once. Proof of Work consists of a consensus algorithm which is a protocol that sets out the conditions for what makes a block in the Blockchain valid. It ensures the security and integrity of bitcoin’s distributed ledger.
RISKS AND OPPORTUNITIES FOR CORPORATES AND INDIVIDUAL INVESTORS -
Common application of financial market instruments for managing risk and opportunities.
Alternatives: Correlation in Futures
Investors could allocate a portion of their portfolio to establish a managed futures position and use market correlations to determine alternative markets to enter that meet their account size and risk parameters.
For example, the Asia Tech 30 Index when charted against bitcoin shows a positive correlation between the two markets. Traders or investors may have interest in gaining exposure to bitcoin, but due to their smaller account size, may prefer to participate in a market that is correlated and fits their capital limitations. In this case, the Micro Asia Tech 30 futures contract could be a viable alternative to trading bitcoin with its lower margin requirements.
TRADDICTIV · Research Team
--------
Disclaimer:
We do not provide investment advice, nor provide any personalized investment recommendations and/or advice in making a decision to trade. Before you start trading, please make sure you have considered your entire financial situation, including financial commitments and you understand that trading is highly speculative and that you could sustain significant losses.

DX1! - Weekly Market Update, 7/5/22US Dollar Index continues to exhibit strength but continues to fail to breakout.
No actionable ideas at this time, while the bias remains to the long side.
I've adjusted support and resistance structures accordingly for your review.

USD Dollar forming double top?#usddollar, 15th Key reversal bar, next Insurance bar indication for short dollar. 105.55-60 resistance level for previous fall. High probability to hold this support to form double top. price may go rise up a little to catch stop losses of short traders. Target is 103.00.

BTC to $500,000 | DXY to new lowslong btc - short the dxy
when the dxy goes up btc goes down soon the opposite will happen all the way to $500k

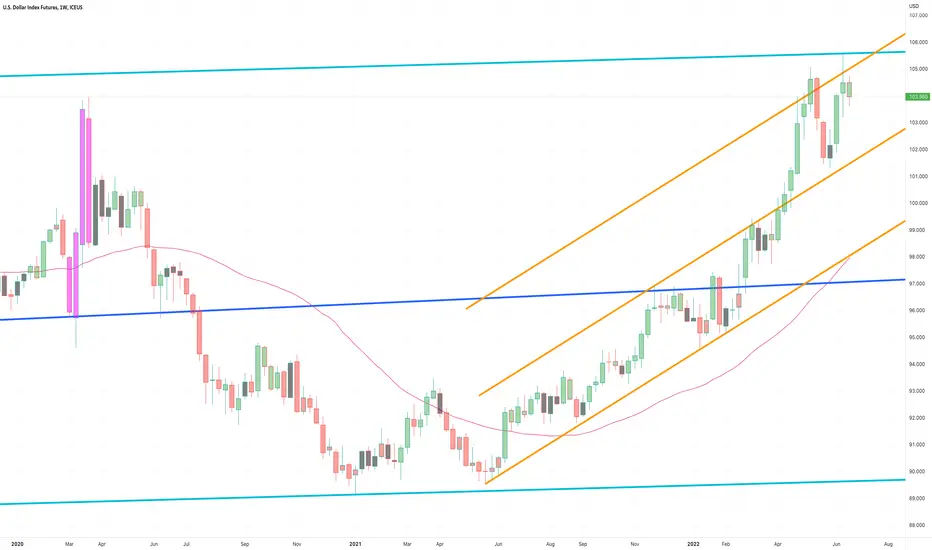
dxy 6-28 updatedxy is in the process of seeing a significant breakout.
this 105 level is basically a line in the sand for what can be.
above 105, opens a door to 109,113,116,119.
---
if you think things are bad in the market right now, you have seen nothing.
🛑

DXY Trading Wave 5 TerminationIn this update we review the recent price action in the Dollar Index futures contract and identify the next high probability trading pattern and price objectives to target

DX1! - Weekly Market Update, 6/27This week's hand drawn support and resistance channel analysis has been applied to the chart for your reference.
The darker the color, the older the structure. The lighter the color, the newer the structure.
Wishing you a blessed and profitable week ahead!
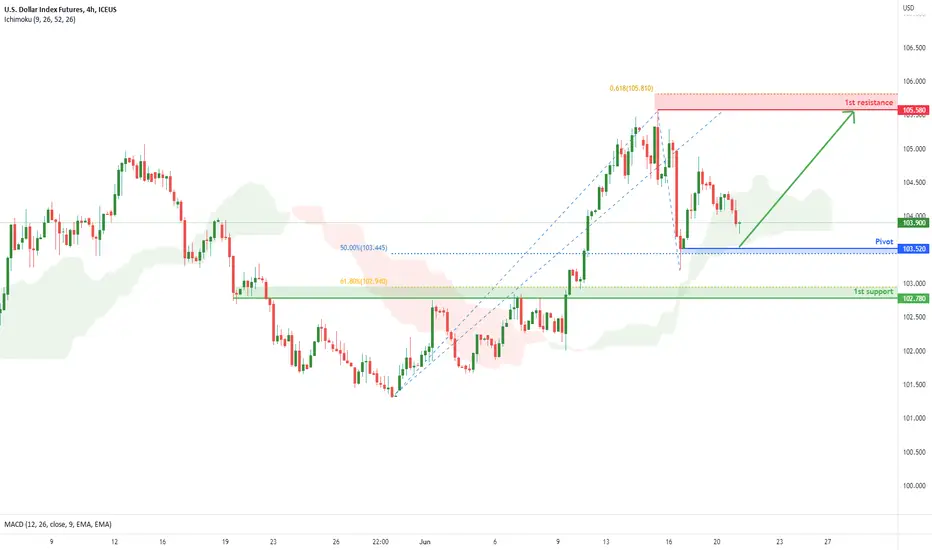
U.S. Dollar Index Futures (DX1!), H4 Potential for Bullish contType : Bullish Momentum
Resistance : 105.580
Pivot: 103.520
Support : 102.780
Preferred Case: On the H4, price expected to bounce off the ichimoku cloud support which supports our bullish bias that price will rise from our pivot at 103.520 in line with the swing low support and 50% Fibonacci retracement to the 1st resistance at 105.580 in line with the 61.8% fibonacci projection and horizontal swing high resistance.
Alternative scenario: Alternatively, price may break through pivot structure and drop to the 1st support at 102.780 in line with the pullback support and 61.8% Fibonacci retracement .
Fundamentals: As US Banks come back from the holiday, the DXY is expected to break out of the current consolidation to form a directional bias. Although there is no major news for the US today, the economic uncertainty continues, therefore expect to see increased volatility in the DXY .

U.S. Dollar Index Futures (DX1!), H4 Potential for Bullish contType : Bullish Momentum
Resistance : 105.580
Pivot: 103.520
Support : 102.780
Preferred Case: On the H4, price expected to bounce off the ichimoku cloud support which supports our bullish bias that price will rise from our pivot at 103.520 in line with the swing low support and 50% Fibonacci retracement to the 1st resistance at 105.580 in line with the 61.8% fibonacci projection and horizontal swing high resistance.
Alternative scenario: Alternatively, price may break through pivot structure and drop to the 1st support at 102.780 in line with the pullback support and 61.8% Fibonacci retracement.
Fundamentals: As US Banks come back from the holiday, the DXY is expected to break out of the current consolidation to form a directional bias. Although there is no major news for the US today, the economic uncertainty continues, therefore expect to see increased volatility in the DXY.
USD DOLLAR probability short for 102.90#usd dollar, 14th June daily bar broke previous resistance to catch stop losses of short traders. 15th June made a key reversal bar dictation for weakness ahead. 102.90 initial target for short. while 101.50 target for medium term.

DX1! - Weekly Market Update, 6/20/22US Dollar Index continues to grind higher on broader market weakness but has yet to settle on a weekly basis 1%+ above the COVID-19 highs.
I've also updated support and resistance structures for your reference. Wishing you a blessed and profitable week ahead!

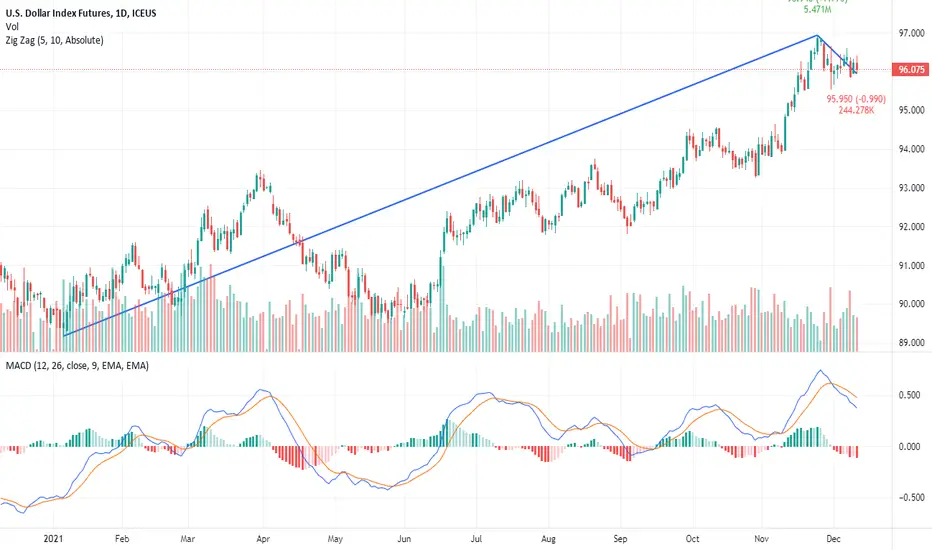
DollarPeople know what the Fed is going to do. We've heat peak inflation. And those inflation expectations will start to come down, and Fed will be tightening into a slowing economy. You'll see bond yields dip lower, and the dollar index will soften.
Technical the chart looks weaker and lower. WE should expect a long duration of loser $, this is not a day-week or month trend. The trend has turned and will soften over a long period of time.
Shorting the dollar is the best protection.
USDX - dollar index rate if we see dollar in 30 mints then its current position is 104.615 and on support . if the support is break the next level is 104.250 and 104 and if the bounce back then hit also the 05.250 point that's already his resistance level...

DXY Looking To Fade Above 106In this update we review the recent price action in the Dollar Index and identify the next high probability trading opportunity and price objectives to target

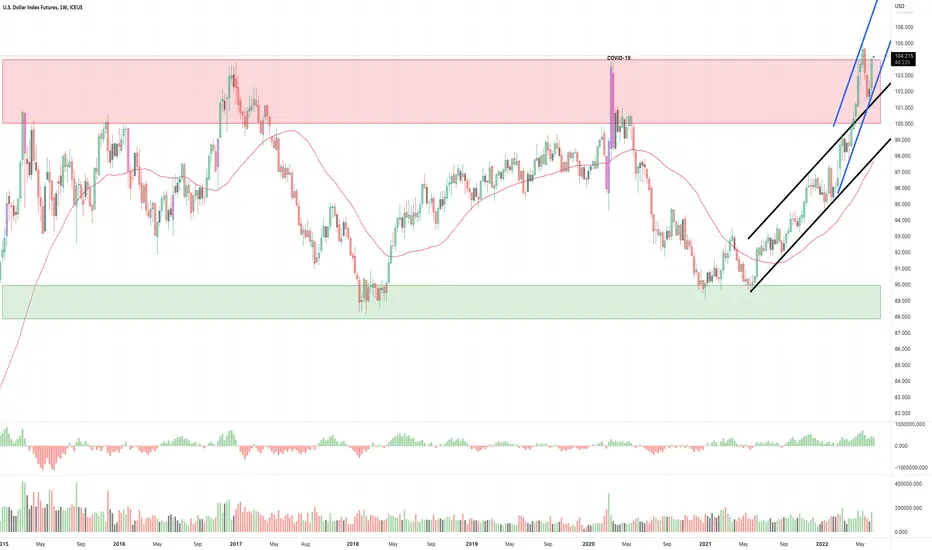
DX1! - Dollar Index looks creepyOK, that's creepy to me.
On this long term chart we see that price respects the Pitchfork very nicely. But that's not creepy, that's what I see day in and out.
But here it comes: IF this is a monster Bull Flag we see in the grey shaded area, the USD will explode to the upside in the comming months. That means, that with the higher and higher inflation in the US, daily goods become even more expensive, and at the same time, exporting becomes harder and harder.
Now, to stay competitive to the world with exports, the governments usually intervene by manipulating the currency down.
BUT now we face a huge problem:
The FED has printetd money endlessly...billions and billions, and that caused the mess, the inflation. Yes, it's not the Virus, it's the "Cocain" for the gamblers that was printed.
So, what would be necessery to manipulate the USD down? Printing money? But, they should STOP printing money so that the inflation can be tamed. Oh..ough..I think someone is trapped very, very bad.
I have no clue how this kneel could be unwinded without kinda reset, or the hard but efficient way of Paul Volker. It would be equivalent to the very, very bad headache after the furiousest party ever celebrated. (borrowed from Maverick Of Wallstreet on YT).
Oh, yes, you're right: The wealthiest got the party, the headache is for the crowd.
1.20 is the mark so far.
Cheers...

U.S. Dollar Index again attacking overhead resistanceIf the USDX can clear 106 the chart indicates a strong trend toward 119 to 120 is possible

DX1! - Weekly Market Update, 6/13/22US Dollar Index continues to exhibit strength on the back of broader market weakness, looking for confirmation to trade higher.
USD DOLLAR suspect bearish for 102#USDDOLLAR, usd dollar monthly key reversal bar made a new high closed off the low. weekly bar 16th-20th May formed two bar reversal for bearishness ahead. 13th May daily bar is a key reversal bar confirmed with next bar down a insurance bar. 104.40-70 supply area for short. stop loss above 105.10 which is 13th May high.

U.S. DOLLAR INDEX FUTURESThe dollar knows a very strong escalation and must pay attention to strong resistance zones from which it can bounce back strongly

US Dollar Index Futures (DX1!), H1 Potential for Bullish riseType : Bullish Rise
Resistance : 103.960
Pivot: 102.925
Support : 102.240
Preferred Case: On the H1, price is moving above the ichimoku cloud and along the ascending trendline which supports our bullish bias that price will rise from the pivot at 102.925 where the swing low support is to the 1st resistance at 103.960 in line with the swing high resistance, 127.2% fibonacci extension and 100% fibonacci projection
Alternative scenario: Alternatively, price may break pivot structure and drop to the 1st support at 102.240 in line with the overlap support and 78.6% fibonacci projection.
Fundamentals: The CPI is forecast to rise by 0.7 percent from the previous month's 0.3 percent, but this is unlikely to affect the two 50-basis-point rate rises already factored in for June and July. This gives us a weak bullish view for the US Dollar Index Futures.
