Bites Of Trading Knowledge For New TOP Traders #12 (short read)Bites Of Trading Knowledge For New TOP Traders #12
----------------------------------------------------------------
What is Hedging? -
Hedging is the action taken through the use of a financial instrument to minimize the loss or risk of the loss of value of an asset due to adverse asset price movements.
Who are Hedgers? -
Hedgers are market participants such as commodity producers who want to lock in selling prices of commodities they produce, or food manufacturers who want to lock in buying prices of raw materials purchased.
Market participants also include financial institutions handling financial assets and use derivative products such as futures to manage the risk of a portfolio of financial assets.
What is the difference between Physically Delivered vs Cash Settled Futures Contracts? -
Physical delivery is a term in a futures contract which requires the actual underlying asset to be “physically delivered” upon the specified delivery date, rather than being traded out with an offsetting contract.
Cash settled futures on the other hand allows for the net cash amount to be paid or received on the settlement date of the futures contract.
Futures exchanges may offer both types of contracts to market participants who have different purposes for trading futures contracts.
RISKS AND OPPORTUNITIES FOR CORPORATES AND INDIVIDUAL INVESTORS -
Common application of financial market instruments for managing risk and opportunities.
Diversification: Correlation in Futures
Investors could allocate a portion of their portfolio to establish a managed futures position to deliver non-correlated results under most market conditions, which may serve as a risk mediator within an overall portfolio. This may deliver lower relative returns during periods of price stability. However, during periods of market stress, managed futures could outperform the broad market.
For example, the Asia Tech 30 index which has no Thai companies as a component stock would not be expected to have any Thai Baht (USDTHB) currency exposure and which could be included in a managed futures portfolio at times where there is no or low correlation between the two markets and could be used as a hedge during times of negative correlation.
Diversification: Portfolio Focused on Asset Returns
Individual investors who have a portfolio of foreign stocks will have a return that is composed of the return of the foreign currency-denominated stock plus the change in currency exchange rates. Therefore, investing abroad means having exposure to two different sources of risk and return made up of the underlying asset and the exchange rate.
For a long-term investor, the focus on return-generating assets may be the priority rather than returns from currency exchange rates. This could imply removing currency risk through a clearly defined hedging strategy process initially and then adding back currency exposure at a later stage if it is determined that currency exposures could improve a portfolio’s return. Investors would need to analyze their expected returns with and without currency exposures and determine their net currency exposure that they would like to remove. U.S. Dollar based portfolios could use futures contracts such as the Mini US Dollar Index ® Futures to hedge a basket of foreign stocks denominated in their respective domestic currencies.
TRADDICTIV · Research Team
--------
Disclaimer:
We do not provide investment advice, nor provide any personalized investment recommendations and/or advice in making a decision to trade. Before you start trading, please make sure you have considered your entire financial situation, including financial commitments and you understand that trading is highly speculative and that you could sustain significant losses.
SDX1! trade ideas

DX1! - Weekly Market Update, 6/6/22US Dollar Index remains reactive to the resistance area I've been indicating over the past several weeks.
We're looking for a confirmation of breakout or breakdown, we haven't seen either yet.
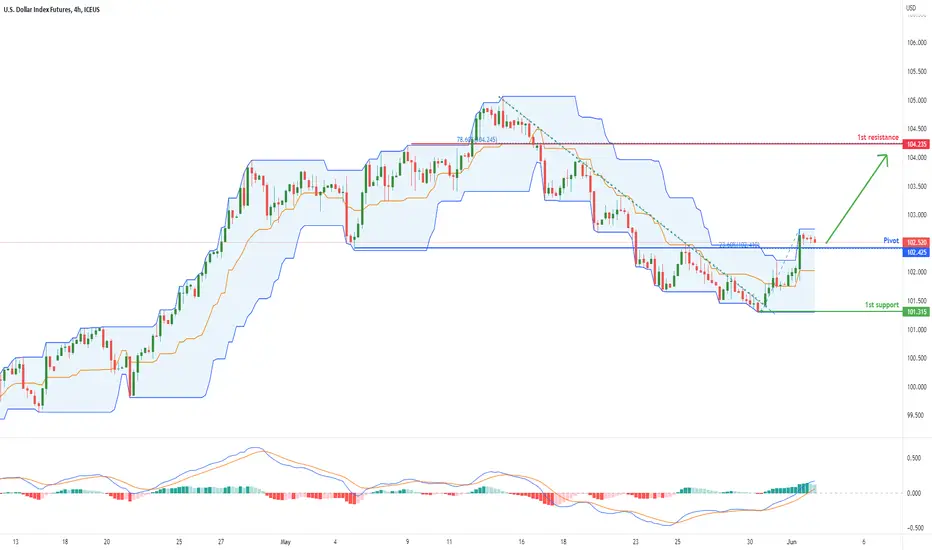
U.S. Dollar Index Future ( DX1! ), H1 Potential for Bearish Drop
Type : Bearish Continuation
Resistance : 104.235
Pivot: 102.510
Support : 101.315
Preferred Case: With the donchian channel and MACD showing further bullish momentum , we have a bullish bias that price will rise from our pivot at 101.315 in line with the horizontal pullback support and 23.6% Fibonacci retracement to our 1st resistance at 104.235 in line with the horizontal overlap resistance and 78.6% Fibonacci retracement .
Alternative scenario: Alternatively, price may break pivot structure and head for 1st support at 101.315 in line with the horizontal swing low support.
Fundamentals: The latest Fed-speak reiterated the high likelihood of two 50bps hikes in the next two central bank meetings. The path after will be data-dependent.
The ADP Non-Farm Employment Change is expected to increase by 295k (previous 247k). We currently have a weak bullish bias.
The Dollar Melting TheoryFrom the begging of the 2021 the Dollar is taking very serious position in the global currency map. In fact it is normal, because the US Dollar is still global reserve currency.
But is it possible this hegemonic position to be replaced with another currency?
Some of the biggest names in the investing world think so. Now there are four main theories about the Dollar future ....
You can read the full article here: rodopacapital.com

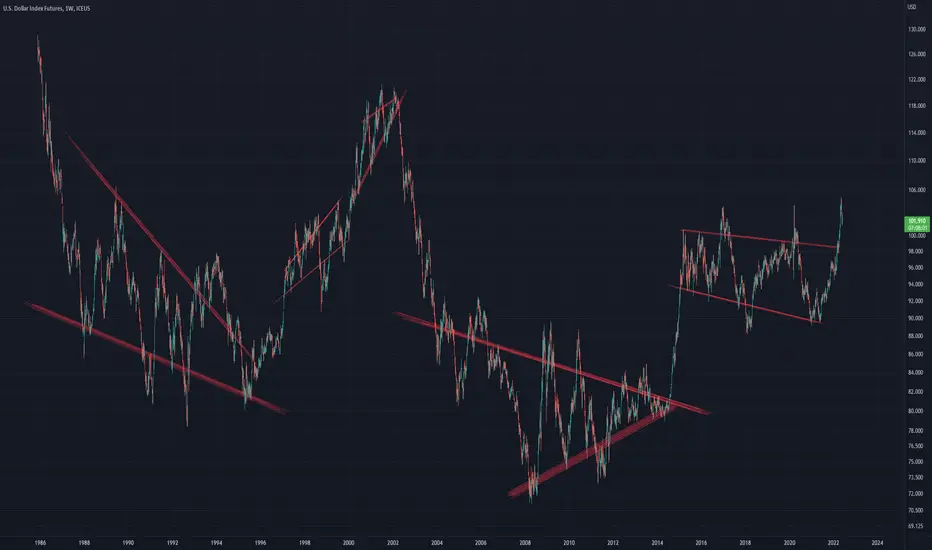
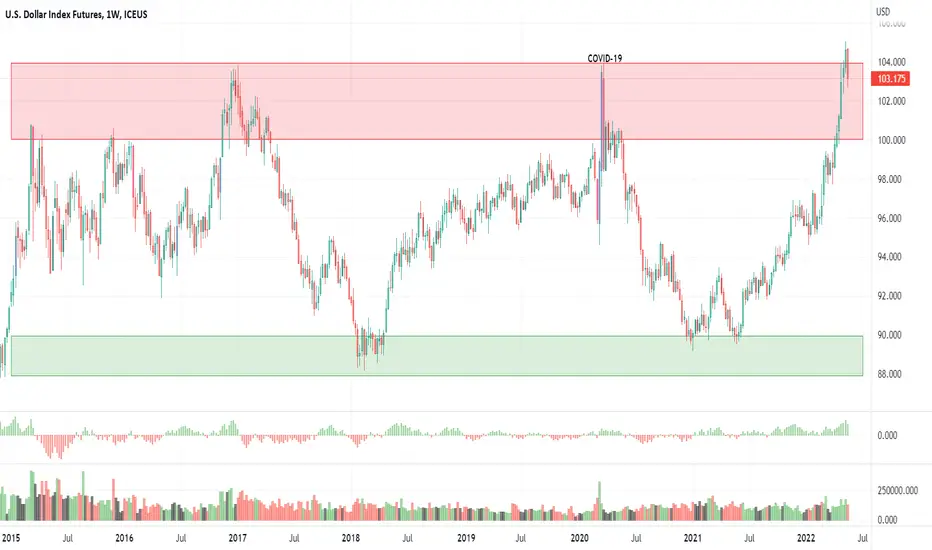
Dollar Index in range since 1988, weekly timeframeThe Dollar Index has been in a large range since 1986, breaking out of it on both sides at different times, but always returning to the large value zone. If the historical cycles are respected, it will most likely experience a large correction towards the center of the range at least, which would help the rise of many instruments from different markets, including the GC or XAUUSD, BTCUSD (a possible rally of cryptocurrencies), EURUSD and many others.

STRUCTURE & REJECTION SETUP we can say this is an update after the last idea was successfully
we expect this move become abc structure and the rejection level at the heavy volume of sellers as shown on the chart

WAVE & VOLUME SETUP we still expecting one more bullish wave we just need correction and retest high volume node levels as shown on the chart
follow the chart with price action confirmation

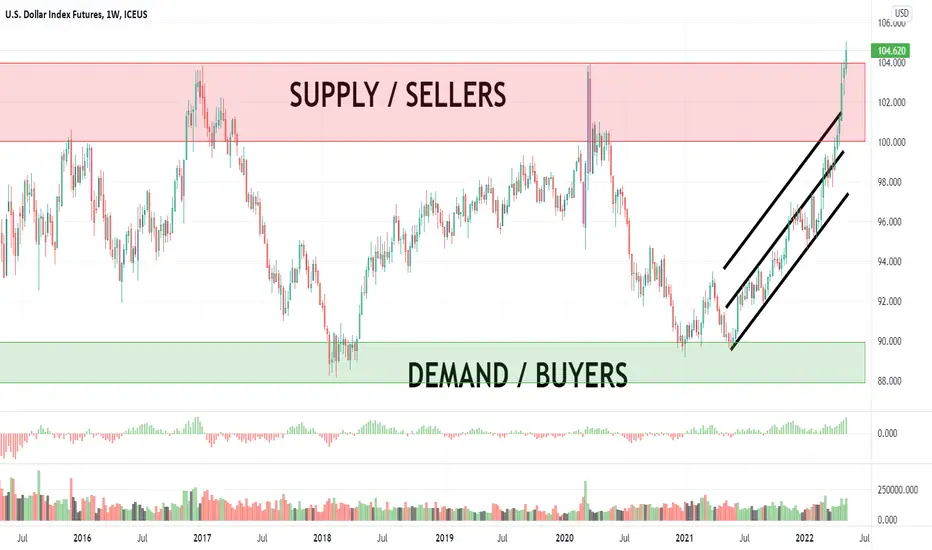
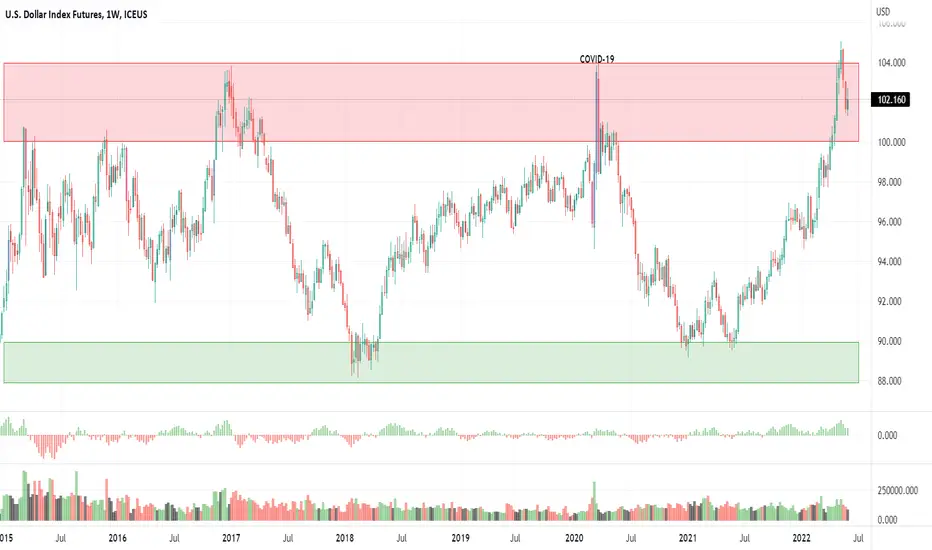
DX1! - Weekly Market Update, 5/31/22US Dollar Index continues to exhibit weakness as it retested and failed to settle 1%+ above the previous high when the Covid-19 sell off had occurred.

U.S. Dollar Index Future ( DX1! ), H1Potential for Bearish Drop
Type : Bearish Continuation
Resistance : 102.670
Pivot: 102.475
Support : 101.690
Preferred Case: With price expected to reverse off the ichimoku cloud , we have a bearish bias that price will drop to our 1st support at 101.690 in line with the swing low from our pivot at 102.475 in line with the horizontal overlap resistance and 50% Fibonacci retracement .
Alternative scenario: Alternatively, price may break pivot structure and head for 1st resistance at 102.670 in line with the overlap resistance and 61.8% Fibonacci retracement .
Fundamentals: With the two 50-bps hikes in the US fed fund rate primarily priced in, profit-taking is likely to ensue on the greenback, especially on pairs where the central banks just shifted towards policy normalisation, such as the RBA and ECB. With that, we currently have a mixed to weak bearish bias.

DXY Dollar Index : Tighten your seatbelt, airplane in space 9.5Simple, practical, efficient.
We are looking at the highest level since March 2020.
A very smart trader once told me - Buy low, sell high.
And looking at December 2016, March 2020 - Jackpot would have been hit both occasions with a short position, with 15% down for USD on average both times.
Now let's connect that to today.
What's similar? The level it self. 103.80-104.50 is the range both times the USD came down crashing, showing strong horizontal resistance in this 5 year window.
What else? Extreme stretched MACD showing overbought condition only similar to March 2020 and December 2016.
And? RSI 14 on weekly chart shows the most stretched overbought condition since 2015, when DXY came down from 100 to 91 within weeks.
Now let's look at the other possibility , a clear breakout higher than the horizontal resistance.
This would be a breakout of a very long-term consolidation , which would mean the beginning of a new up-trend that could take the USD to highs only seen before 22 years ago and before than the mid 80's.
Is this probable considering the extreme overbought condition across big and short timeframes?
Is this probable considering the highest national debt in history by far?
Is this probable considering the tech bubble burst?
Is this probable considering the worst inflation in 40 years?
Is this probable considering the rate hike is already priced in?
And the list goes on and on.
Make an informed decision, don't buy expensive.
-----------------------------------------------------------------------------------------------------------------------------------------------------------------------------------------------------------------------------
Thank you so much for reading! If you found my idea useful please like and follow, it would mean a lot for me.
My target is to help as many traders as possible, please comment and let me know what would help you most.
I promise to respond to everyone with detail, thanks again :)
-----------------------------------------------------------------------------------------------------------------------------------------------------------------------------------------------------------------------------

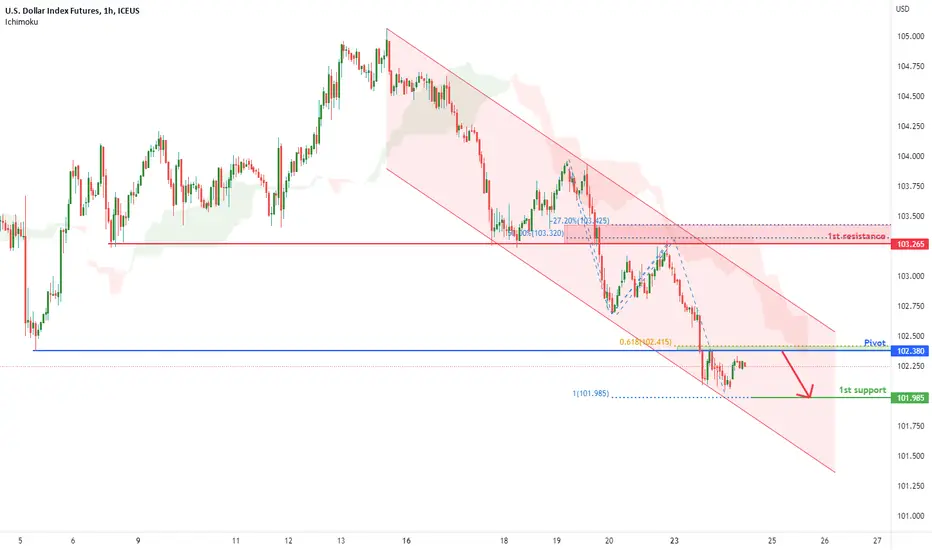
DXY Targeting A Wave 4 LowIn this update we review the recent price action in the Dollar INde and identify the next high probability trading opportunity and price objectives to target

U.S. Dollar Index Future ( DX1! ), H1 Potential for Bearish DropType : Bearish Continuation
Resistance : 103.265
Pivot: 102.380
Support : 101.985
Preferred Case: With price moving below the ichimoku cloud, we have a bearish bias that price will drop to our 1st support at 101.985 in line with the 100% fibonacci projection from our pivot at 102.380 in line with the horizontal overlap resistance and 61.8% fibonacci retracement.
Alternative scenario: Alternatively, price may break pivot structure and head for 1st resistance in line with the overlap resistance, -27.20% fibonacci expansion and 50% Fibonacci retracement.
Fundamentals: In the face of strong inflation, Bostic emphasized that two 50-bps raises at forthcoming Fed meetings are still realistic. We have a Mixed-to-Weak Bearish view on the index.
Fibonacci Convergence and turning points.
We suspect that the US Dollar up move that has been in play for a little over one year is most likely done for now. Firstly, the market has failed to maintain its bid to head above the 103.91/86 peaks seen in 2017 and 2020 AND the daily RSI has a large divergence reflecting a severe loss of upside momentum. This is seen when price makes a new high BUT the RSI does not. But for us the most telling factor is the convergence of the Fibonacci retracements.
Sorry what? This happens when Fibonacci retracements from a number of different lows or highs to find a level where 2 or more retracements are at or near the same level. Over the years I have observed when this happens it frequently coincides with a strong possibility of a turning point.
For example, a Fibonacci convergence can be seen on the US Dollar Index daily chart where we can see the 38.2% retracement from the September 2021 low and the 50% retracement from the 2022 low converge at 99.80/97. The 50% and 61.8% retracements lie 98.41/57 etc
Nearby support is 102.37, the 5th May low, but we suspect that the market will retrace towards its 55-day ma at 100.85 with the 38.2% and 50% retracements at 99.97/80 acting as our short-term target.
Disclaimer:
The information posted on Trading View is for informative purposes and is not intended to constitute advice in any form, including but not limited to investment, accounting, tax, legal or regulatory advice. The information therefore has no regard to the specific investment objectives, financial situation or particular needs of any specific recipient. Opinions expressed are our current opinions as of the date appearing on Trading View only. All illustrations, forecasts or hypothetical data are for illustrative purposes only. The Society of Technical Analysts Ltd does not make representation that the information provided is appropriate for use in all jurisdictions or by all Investors or other potential Investors. Parties are therefore responsible for compliance with applicable local laws and regulations. The Society of Technical Analysts will not be held liable for any loss or damage resulting directly or indirectly from the use of any information on this site.

U.S. Dollar Index Future ( DX1! ), H1 Potential for Bearish ContType : Bearish Continuation
Resistance : 103.235
Pivot: 102.830
Support : 102.370
Preferred Case: With price moving below the ichimoku cloud, we have a bearish bias that price will drop to our support in line with the horizontal swing low support and 78.6% fibonacci projection from our pivot in line with the horizontal pullback resistance.
Alternative scenario: Alternatively, price may break pivot structure and head for 1st resistance in line with the overlap resistance, 78.6% Fibonacci projection and 50% Fibonacci retracement. Take note of intermediary support at 102.680.
Fundamentals: The overarching aggressive hawkish Fed rhetoric has largely been priced in, allowing longs an excuse to take profit until the central bank chief Powell speaks on 25 May. We have a Mixed-to-Weak Bullish view on the trade.

Bitcoin wish! I hope to see this drop
This will help Bitcoin market to go up Easily
There is an inverse relationship between
Dollar Index and the Cryptocurrency Market

Dollar - DX DXY DOLLAR WEF Summit in DAVOS Began today, May 22, 2022.
World Economic Forum members are face to face
\as opposed to Virtual.
Topics include Ukraine, Energy, Nato, and Climate.
Government Policies will be shaped this weekend
for the next 18 months.
Volatility & Stability will be addressed with strategy
sessions will be addressed in breakout groups to present
a composite solution.
This meeting has been postponed as it is usually held in
January.
Acceleration of Policies and Agenda are to be anticipated.
The result will have broad-reaching Market implications.

DX1! - Weekly Market Update, 5/23/22US Dollar Index struggles to breakout of its multi-year rangebound pattern.
It has yet to offer us a weekly settlement above our 1%+ confirmation.
As the US Dollar tops, typically major corrections occur around it... Dot.com burst, Great recession, Covid-19, etc.
Wishing you a blessed and profitable week ahead!
DXY Is Slowing Down As Stocks Nearing SupportHello traders, today we will talk about US dollar Index- DXY compared to US stocks, specifically SP500.
What we see on DXY is an intraday five-wave decline from the highs after a completed higher degree wave 5th. In Elliott wave theory it means that US dollar may face bigger A-B-C corrective decline, especially if we consider 5th wave and strong support on SP500.
Now that SP500 keeps pushing lower with room for more weakness within wave 5, DXY could face a corrective recovery into wave B. Later then, when SP500 completes its 5th wave and finds the support, this is when can expect further weakness within wave C for the US dollar.
Trade well!
If you like what we do, then please like and share our idea.
Disclosure: Please be informed that information we provide is NOT a trading recommendation or investment advice. All of our work is for educational purposes only.

US Dollar may have reached a PEAK. Could be BIG for metalsThis chart shows the US Dollar has rallied back to highs - setting up what may be a triple-top.
I find it interesting that strong downward momentum in the US markets is freaking everyone out - yet my custom indexes suggest that the US/GLOBAL markets are seeking a bottom.
One thing is for sure - the US Dollar has RIPPED higher and could be setting up a dramatic shift if the global economy rolls into Stagflation.
I see the rally in the US Dollar as a flight to safety for foreign capital (moving into US assets and attempting to avoid foreign current risks).
Yet the Fed is actively trying to deflate that trend by raising rates.
In some way, the US Dollar may continue to stay stronger than other foreign currencies, but I see the US Dollar moving downward over the next 12+ months as the Fed attempts to burst asset bubbles.
Capital will flow where opportunities exist - that may still be in US Assets. But I see the US Dollar moving downward while other currencies move lower as well.
The great Unwinding is here. Should be fun.
Emotional Responses are Dangerous in this EnvironmentMarkets across all asset classes hate uncertainty because it causes traders, investors, and all market participants more than a bit of indigestion. Fear and greed are emotions that drive impulsive behaviors. Effective decision-making depends on a rational, logical, and reasonable approach to problem-solving.
The Fed finally addresses inflation
Recessionary risks are rising
Stagflation creates the worst of both worlds
Tools impact the demand side- The supply side is a challenge
Tools and rules for keeping emotions in check during scary times
Reducing impulsive, emotional responses is a lot easier said than done. While it is easy to mitigate emotion during calm periods, they take over and trigger fear or greed-based actions in the heat of the moment.
In mid-May 2022, the markets face a crossroads. The current market correction is a function of rising interest rates, the potential for an economic decline, a rising dollar, the war in Europe, supply chain issues, geopolitical tensions between nuclear powers, and a host of other domestic and foreign factors.
It is now the most critical period in decades to take an emotional inventory that will avoid catastrophic, impulse-based mistakes. Wide price variance in all markets could accelerate, and those with a plan are the most likely to succeed and protect their hard-earned capital.
The Fed finally addresses inflation
The US central bank had an epiphany after mistakenly believing that rising inflationary pressures were “transitory” in 2021. The Fed woke up smelling the blooming inflationary environment late last year when CPI and PPI data showed the economic condition rose to the highest level in over four decades.
At the May 4 meeting, the central bank hiked the Fed Funds Rate by 50 basis points to 75 to 100 basis points. The central bank told markets to expect 25 or 50-basis point hikes at each meeting for the rest of 2022 and into 2023. The Fed also laid out its plans to reduce its swollen balance sheet, allowing government and debt securities to roll off at maturity. While the Fed has switched to a hawkish monetary approach, it remains behind the inflationary curve. Last week, April CPI came in at 8.3% with PPI at 11%, meaning real short-term interest rates remain negative, fueling inflation. While wages are rising, they are lagging behind inflation. Consumers may be earning more but spend even more on goods and services each month.
Recessionary risks are rising
The US first quarter 2022 GDP data showed a 1.4% decline or economic contraction. The war in Russia, sanctions and retaliation, supply chain bottlenecks, deteriorating relations with China, political divisiveness in the US, and many other issues weigh on the US economy. Meanwhile, rising US interest rates have put upward pressure on the US dollar, pushing the dollar index to a multi-year high.
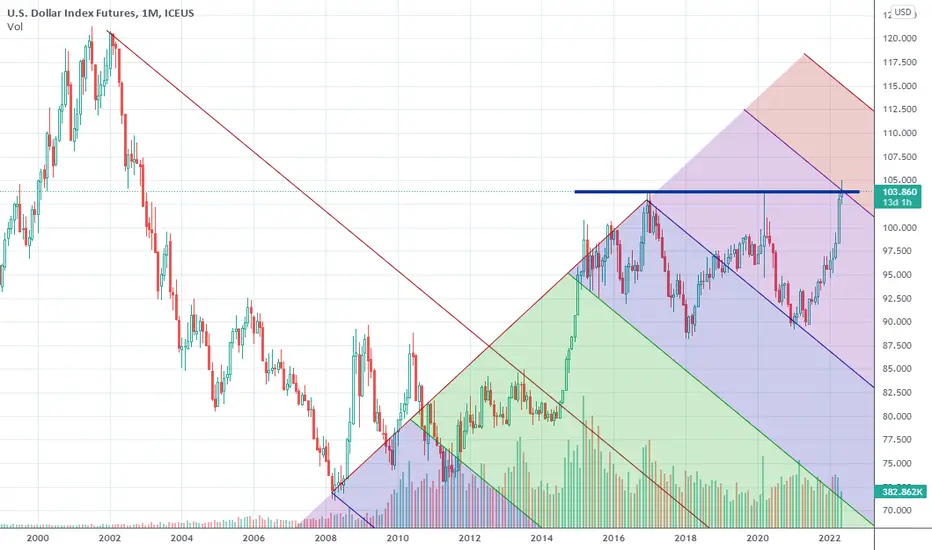
As the chart shows, the dollar index rose to 105.065 last week, a two-decade high. A rising dollar is a function of increasing US rates, but it makes US multinational companies less competitive in foreign markets.
The falling GDP in Q1 2022 increases the threat of a recession, defined as a GDP decline in two successive quarters, putting pressure on the Q2 data this summer.
Stagflation creates the worst of both worlds
Recession and inflation create stagflation, the worst of all worlds for central bankers seeking stable markets and full employment. The most recent economic data has put the US economy on the road towards stagflation as rising prices and a sluggish economy require competing monetary policy tools.
The Fed is addressing inflation with higher interest rates and quantitative tightening, but recession requires stimulus, the opposite of the current hawkish monetary policy path. The central bank must decide on which economic condition threatens the economy more. The Fed seems to have chosen inflation, but it is more than a reluctant choice. Tightening credit treats the inflationary symptoms, but it can exacerbate recessionary pressures as higher rates choke economic growth. Stagflation is an ugly economic beast.
Tools impact the demand side- The supply side is a challenge
Meanwhile, the US and other central banks have deep toolboxes that address demand-side economic issues. While inflation and recession require different tools, the Fed faces other compelling factors from the global economy’s demand side.
The war in Ukraine is distorting prices as sanctions on Russia and Russian retaliation distort commodity prices. Moreover, the “no-limits” alliance between China and Russia creates a geopolitical bifurcation with the US and Europe. With nuclear powers on each side of the ideological divide, economic ramifications impact the economy’s supply side. China is the world’s leading commodity consumer, and Russia is an influential and dominant raw materials producer. Energy and food prices are the battlegrounds.
Central banks have few tools to deal with supply-side shocks and changes, which can create extreme volatility in the prices of goods and services. The Chinese-Russian alliance transforms globalism with a deep divide. Global dependence on Chinese demand and Russian supplies distorts raw material’s supply and demand fundamentals. While the US Fed faces a challenge balancing inflation and the potential for a recession, the supply side issues only complicate the economic landscape, increasing market volatility across all asset classes.
Tools and rules for keeping emotions in check during scary times
The best advice for dealing with anxiety came from US President Franklin Delano Roosevelt, who said, “the only thing to fear is fear itself.” Conquering fear requires a plan that mitigates emotions no matter the market conditions.
The Fed’s toolbox is bare in the current environment, creating a volatile landscape. Chasing inflation and dealing with a recession in the face of supply-side shocks is a potent cocktail for price variance. Investors and traders need to change their orientation to markets to adapt to the current conditions. The following tools and rules can assist in mitigating the human impulses that lead market participants to make significant financial mistakes:
Hedge portfolios using market tools to protect the downside and allow for upside participation. Hedging reduces the impulse to liquidate portfolios because of fear.
Since volatility creates opportunities, approach markets with a clear plan for risk versus reward.
Remember that the market price is always the correct price. A risk-reward plan only works when risk levels are respected. Markets are never wrong, while traders and investors are often wrong.
A long or short position should constantly be monitored at the current price, not the original execution price. Positions are long or short at the last tick.
Adjust risk and reward levels based on current market prices.
Follow trends, not news, “experts,” or pundits. Trends reflect the crowd’s wisdom, and collective wisdom reflects the sentiment that drives prices higher or lower.
Never attempt to pick the top or the bottom in a market, let the price trends do that for you.
The rules are simple, but emotions are tricky. The emotions that trigger impulsive behavior cause market participants to ignore the rules. The critical factor for success in markets is discipline, defined as “the practice of training people to obey rules or a code of behavior, using punishment to correct disobedience.” When it comes to our hard-earned savings and portfolios, the punishment is losses.
Tuck those emotions away and face the volatile market landscape with a plan. Hedge your nest egg, and you will sleep better each night. Remind yourself that fear is the only factor you should fear.
--
Trading advice given in this communication, if any, is based on information taken from trades and statistical services and other sources that we believe are reliable. The author does not guarantee that such information is accurate or complete and it should not be relied upon as such. Trading advice reflects the author’s good faith judgment at a specific time and is subject to change without notice. There is no guarantee that the advice the author provides will result in profitable trades. There is risk of loss in all futures and options trading. Any investment involves substantial risks, including, but not limited to, pricing volatility , inadequate liquidity, and the potential complete loss of principal. This article does not in any way constitute an offer or solicitation of an offer to buy or sell any investment, security, or commodity discussed herein, or any security in any jurisdiction in which such an offer would be unlawful under the securities laws of such jurisdiction.

DX DXY USD - Dollar 2 HourAfter reaching parity with the Swiss Franc Facta, the DXY peaked ST over 1.05.
Our TOSS level was 104.55, it has been met Short Term on a Throw Over.
It's nowhere near done moving higher, but for now, will range to digest a large
move into the Safety Trade
It did peak while sentiment was reaching extremes unseen. Again we do not
expect Extreme Fear readings to give up much more than a persistent Fear
Reading.
Only Direct Subsidies to Consumers and FMonetary/Fiscal Pivots will resolve the
embedded Senticators.
____________________________________________________________________
My long-standing FX Accident Thesis is well underway and will continue into
October of 2023.
A new Low at the close of the session sends the DX lower, a potential distribution
is setting up nicely Shorter Term.
We'll need to see if this ends up with a larger distribution. It well may be turning
slightly on this pattern.
Observing the reaction on Gold will be telling, it did hit my PO @ 1798.90 dipping
in ever so slightly. Gold is reaching a DOM demand level.
The COT remains in a SELL for Large Participants.
Is a surprise in store, there appears to be one waiting in the shadows.

DX1! - Weekly Market Update, 5/16/22US Dollar index continues to grind higher. It's clear the dollar is the safe haven that the market is gravitating towards during this recent downturn as we are witnessing weakness in the gold futures market as well. The dollar as broken through and settled above an area of know resistance. Looking back, we've just traded higher than where the dollar had peaked prior to the Covid-19 initial sell off. I see longer term descending resistance currently @ $110.XX. Wishing you a blessed and profitable week!