Bites Of Trading Knowledge For New TOP Traders #1 (short read)Bites Of Trading Knowledge For New TOP Traders #1
---------------------------------------------------------------
What is Hedging? –
Hedging is the action taken through the use of a financial instrument to minimize the loss or risk of the loss of value of an asset due to adverse asset price movements.
Who are Hedgers? –
Hedgers are market participants such as commodity producers who want to lock in selling prices of commodities they produce, or food manufacturers who want to lock in buying prices of raw materials purchased.
Market participants also include financial institutions handling financial assets and use derivative products such as futures to manage the risk of a portfolio of financial assets.
What is the difference between Physically Delivered vs Cash Settled Futures Contracts? –
Physical delivery is a term in a futures contract which requires the actual underlying asset to be “physically delivered” upon the specified delivery date, rather than being cash-settled.
Cash settled futures on the other hand allows for the net cash amount to be paid or received on the settlement date of the futures contract.
Futures exchanges may offer both types of contracts to market participants who have different purposes for trading futures contracts.
Risks and opportunities for corporates and individual investors: HEDGING –
Hedging currency exposure with the Mini U.S. Dollar Index ® futures contract is a way to manage business currency risk by taking a directional position depending on business requirements for conversions to or from the U.S. Dollar.
For example, a hedger may have expected the U.S. Dollar to weaken from 93.50 on 31st March (based on an analysis involving the overall downward trend in the market having retraced to the Fibonacci retracement level 76.8%) and may have had plans to convert U.S. Dollars to Singapore Dollars over the coming months to make payments to suppliers in Singapore Dollars. The hedger could have opened a short position using the Mini U.S. Dollar Index ® futures contract at or around 93.50 to lock in the value of the U.S. Dollars that they planned to use in the future at the time of payment to the supplier.
TRADDICTIV · Research Team
--------
Disclaimer:
We do not provide investment advice, nor provide any personalized investment recommendations and/or advice in making a decision to trade. Before you start trading, please make sure you have considered your entire financial situation, including financial commitments and you understand that trading is highly speculative and that you could sustain significant losses.
SDX1! trade ideas


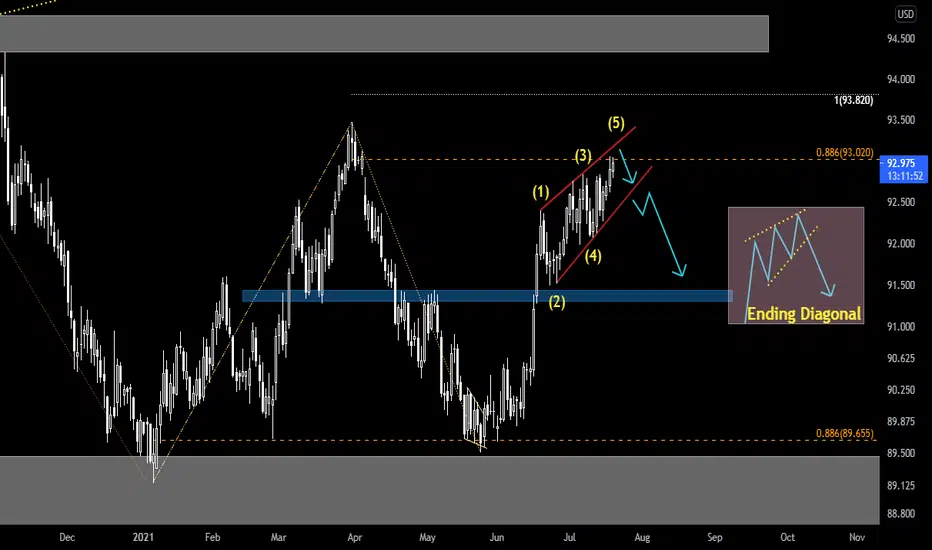
Dollar is on its final stage to complete wave five to the upsideU.S.Dollar Index Futures is on its final stage to complete wave five in a sequence of wave patterns to the upside; this means a pullback could be due.
The nearest major resistance estimates are 94.30 and 94.80; the dollar could gradually pull back if it fails to hold above the two critical levels.
Major support/resistance estimates are automated and marked on the chart as solid lines for future references

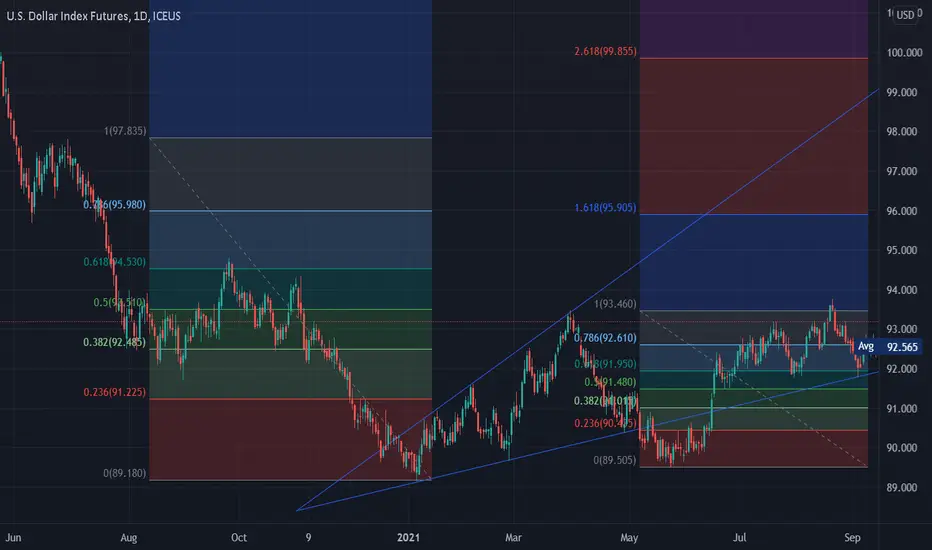
DXY - Back to 93.5?IF DXY stalls here good chance its going to retest the previous highs at 0.382 retracement. This could be a good opportunity for an entry.
Not advice

Correction or fallingIn each way we will see a sharp movement toward the bottom
If the supportive range can handle sales pressure, we will see a very powerful uptrend

USD - Rejection The dollar is approaching a multi year line of resistance and also some overbought levels as can be seen on the RSI. The last time the dollar approached this target was 2020 and had a huge rejection. I suspect the same line will again act as level of resistance.
“It’s going to be the biggest crash in world history. We have never had this much debt pumped up. Debt is the biggest problem of all…the debt to GDP ratio is out of sync. So when it comes down, and it’s going to bring everything down with it, that’s when I’m going to be buying more gold, silver, and Bitcoin,” Kiyosaki said.
He noted that the possible crash will result from decisions made by the Federal Reserve and the Treasury. Kiyosaki opines that decisions made by the institutions do not mirror the current state of the economy (Author of Rich dad Poor Dad).

DXY Elliott wave analysisOn 4h chart look like we completed a impulse here, and now we are in correction, 93 is level we need to watch if it correction above it maybe we will have continue ext

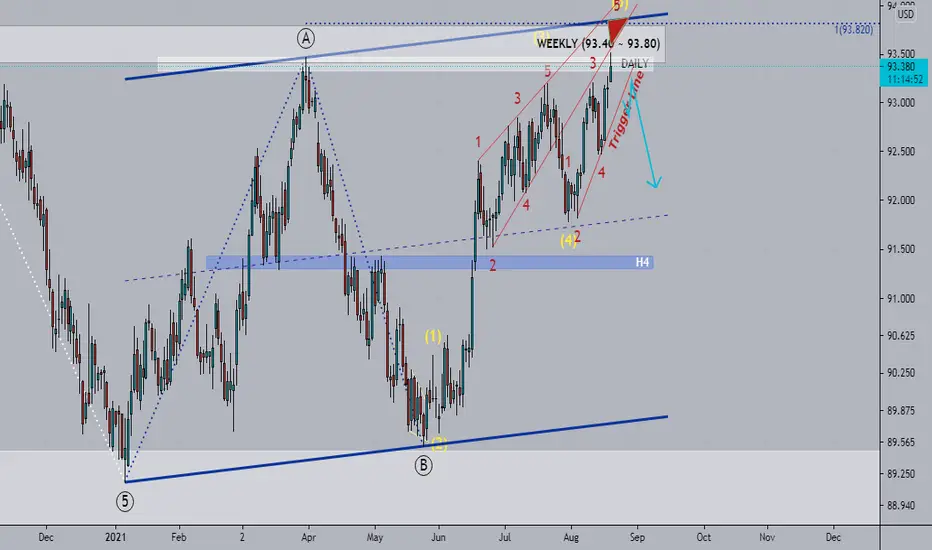
Elliott Wave View: Further Strength in US Dollar Index (DXY)Short Term view in US Dollar Index (DXY) suggests the rally from Sept 3, 2021 low is unfolding as a 5 waves impulse Elliott Wave structure. Up from Sept 3, wave ((i)) ended at 92.8, dips in wave ((ii)) ended at 92.32. Index resumes higher in wave ((iii)) to 93.45, pullback in wave ((iv)) ended at 93. The Dollar Index then completed wave ((v)) at 93.52 which should also end wave 1 in higher degree. Pullback in wave 2 ended at 92.98 with internal subdivision as a zigzag. Down from wave 1, wave ((a)) ended at 93.14, wave ((b)) ended at 93.25, and wave ((c)) ended at 92.98.
Index has resumed higher in wave 3. Up from wave 2, wave (1) ended at 93.12 and pullback in wave (2) ended at 93. Index resumes higher in wave (iii) towards 93.42, and pullback in wave (iv) ended at 93.2. Final leg higher wave (v) of ((i)) ended at 93.49. Pullback in wave ((ii)) has also ended at 93.3 and Index has resumed higher again. Up from wave ((ii)), wave (i) ended at 93.8 and pullback in wave (ii) ended at 93.6. Near term, as far as September 23 pivot low at 93 remains intact, expect pullback to find support in 3, 7, or 11 swing for further upside. Potential target higher is 100% – 161.8% fibonacci extension from September 3 low towards 94.56 – 95.55.

Dollar looking strongin the short term, the dollar has broken resistance but let us wait for more confirmation from the market and see what the US's next move is. The dollar can have a negative effect on stocks and crypto if it continues uptrend.

DXY index. Are we waiting for the breakout of the zone 94.28-95?Why is this zone important? In 2018, after breaking through this zone, a crisis began in the financial markets. SNP500 went into 20% correction within 3 months. Will history repeat itself this week? No, it took 18 weeks for the DXY index to break through this zone and gain a foothold above it in 2018. It turns out there is a possibility of getting a correction at the beginning of next 2021.


DX - @ Bottom of RangeA predicted 3% fall in the US Dollar during 2021, was incorrect and met with a Global
default denomination of +3.5%.
The 7.5% swing and miss in Sum.
In the world of currency values and major financial institution predictions - Missing
the Mark by the largest Margin in predictive assumptions is no small feat.
This never happens and yet it did happen.
Fears of the recovery in China, Japan, Australia, and the UK in terms of manufacturing
and durable goods corporate performance - failed to meet expectations.
China began to restructure Trade.
Japan turned inward continuing the largest build in Defense before World War 2.
Australia went full mental with Covid restrictions, closing off its Economy.
The UK further removed ties to the European Union with Bre-Exit advancing from
February to June.
Coffin Nails were abundant, their hammering continues.

DXY Dollar Index Losing Momentum $90.45This is your tarot chart reading per event.
DXY is the most important highlight to watch for all marketeers and traders. DXY is normally to calculate the relative between other currencies and some commodities.
1st rebound is on 7th January 2021
2nd rebound is on 1st June 2021
DXY is good performer when it comes out with stimulus projection or stimulus release.
This year 2021 pattern took some major constructive pattern.
January to March = strengthen
March to June = weaken
June to Sep = strengthen
Thus, we can expected Q4 the US dollar index will be weaken. As clearly shown that the pattern development on the current constructive pattern is losing.
The steam of strengthening losing it's momentum as the stimulus of injection dollar to the market gained less traction control.
Based on my calculation, there will be no more upscale towards the dollar projection.
Q4 is coming and the all indices will be going into depression.
Thus, I am predicting the dollar will hit the value of $90.45 starting next week course developing trend.
Zezu Zaza
2048


DX - Dollars Expanding Range 8950 - 9750Inflation Trades, Transitory Trades, Cleanest Dirty Blouse Trades
FX is setting up for a Primal Accident.
It remains the largest Intra-Day Market as Liquidity begins to abate
within the DX Complex.
The 6 pairs remain in FLUX, heavily so waiting on the DX to make it's
larger move.
With so many Macro and Geopolitical influences hip sway within
Foreign Exchange... it remains one enormous mess.
The 6e is likely the most damaged, although it's held up well, the
ECB continues to Provide Blunder after Policy Blunder. Negative Rates
were the final call, we are simply waiting for the disaster there to
unfold in the coming months. The ECB has provided more utterances
as to the direction and goals of their Basket Case.
Coppertone Goddess LeGarde's persistence in installing a Digital
"Currency" (Not a Currency in any manner, form, way) within the
Block has repeatedly been stymied... The intent is clear, the implementation
has been difficult as The Great Experiment was doomed to fail day
one. Monetary Unions which fail to aggregate Debts, Fail. Period,
the end.
We are simply waiting on the tempest to blow the teapots lid clean
off.
The GBP, London's Financial Center trembles at the thought of
how this transition will impact the imbalances. The Soft Exit
isn't quite working as planned.
The UK left the European Union's sordid mess and left 27 countries -
bringing to an end 47 years of British membership of the EU and
prior institutions. It was a slow and arduous divorce, one that
created immense volatility on the path of separation.
The actual effects did not begin to manifest themselves until
January 1, 2021 when the actual split began to take shape.
Northern Ireland, per usual, received the short end of the stick.
Nascent ties to the EU remained and with it, further anger,
dismay and despair.
Another version of the Potato Famine, brought to you by
the Technocrats with a number of regulations on Food.
Further restrictions on Travel, Residency and Third Party
Trade... did not fare well. Riots resulted.
These arsonists are always a day late, it adds to anger.
The UK, in sum, fundamentally withdrew from the collection
of Dunces to reposition it's Financial arrangements with
China, albeit slowly, but they are large supporters of
China's Bond Market.
It's complicated, but obvious as to why the UK began to
absolve themselves of these tenuous arrangements.
Northern Ireland was "Backstopped", or double bond
as we prefer with a 4 year screwing aligned with the
idiocy of Plutocracy that is the EU.
The AUZ, NZD and CANDO are simply along for the ride.
Degenerate outposts of the UK's progressive Policies
towards future arrangements.
A colossal experiment gone wrong shining ever so brightly
in the light of day. No shame, simply far more draconian
with each passing day.
JBG's are wholly owned in the Land of the setting Sun.
The vast majority of NIK225 Equities are wholly owned
by the same degenerate failures of JCB Policies for 3+
decades.
Idiocy which has never functionally changed anything
but served to worsen a sink hole.
This leaves the Dollar, the abused stepchild of Bretton
Woods. a Currency which has suffered one default when
French Warships entered New York Harbor to retrieve
the People's Gold. De Gaulle had enough and on collecting
France's Tier one assets... Monetary decentralization led
to France's attempt at decentralization and further
attempts at Nationalism.
Unfortunately, the winds of change were blowing in the
opposite direction and... you know the rest.
Uncle Buck's extraordinary privileges' were eroded over time.
Money from nothing became the Rule of Monetary Law. It began
with small footsteps, on the Journey of one thousand miles
to today.
How this all shakes out will be telling as the new monetary
order is arriving... Currency Wars lead to Trade Wars which
lead to Shooting Wars.
This is the History of it, it is always the same.
Digital Script requires a rearranging of the Deck Chairs, this
will unfold in the most violent of fashion.
Best to prepare for it, The liability side of the Balance Sheet
cannot be serviced.
It's best to eliminate them...


Elliott Wave View: Dollar Index Ending 5 WavesShort-term Elliott wave view in Dollar Index (DXY) suggests the decline from August 20 high is in progress as a 5 waves impulse Elliott Wave structure. Down from August 20 high, wave ((i)) ended at 92.80 and rally in wave ((ii)) ended at 93.18. Internal subdivision of wave ((ii)) unfolded as a zigzag. Wave (a) ended at 93.13, wave (b) ended at 92.93, and wave (c) ended at 93.18. The Index resumes lower in wave ((iii)) towards 92.4 in 5 waves of lesser degree. Down from wave ((ii)), wave (i) ended at 92.6 and rally in wave (ii) ended at 92.78. Index then resumes lower in wave (iii) towards 92.46, rally in wave (iv) ended at 92.55, and final leg lower wave (v) ended at 92.4.
Rally in wave ((iv)) ended at 92.78 and the Index has resumed lower. Down from wave ((iv)), wave (i) ended at 92.37 and rally in wave (ii) ended at 92.53. Expect wave (iii) to end soon, and the Index should rally in wave (iv) before turning lower again. Near term, as far as pivot at 92.78 high remains intact, expect rally to fail in 3, 7, or 11 swing for further downside.

more downside for the dollarThe dollar is falling from its rising wedge. with delta variant fears and NFP tomorrow this is a critical time for the dxy... bad news tomorrow maybe the catalyst for the dollar to go to its technical target.
time will tell

DX - Whom DO You TRUSTGlobally, our nation has appeared as a Fruit Basket for some time to G7/G20
Members.
Afghanistan is simply a reminder.
A war which has waged on since forever...
Initially, we covertly funded Rebels against the Soviet incursions.
I've been the Soviet War Museum in Volgograd. It's as depressing as it gets
for Russians who fought their version of Nam.
Stingers to Hinds... death littered the landscape.
After Trillions of Dollars spent in this region, and hundreds of Billions in
Weapons left behind... our Tax Dollars spent are clearly coming into
question and it is a welcome discussion.
Wasted.
It's as though, Benghazi has re-appeared once again to re-arm the enemy
or so it would appear.
The Pullout, by most metrics was handled, poorly.
Our former partners around the Globe are reluctant to respond any longer.
They have watched for years... the United States devolve into a parasitic
Kleptocracy and "they" want no part of it.
The Deck Chairs began the collective re-arrangement some time ago.
And now, here we are... on the cliff's edge.
We are no longer "Trusted" to do the proper, correct and moral effort(s).
This continues to unfold as the DX accident approaches.
The Chart illustrates where the DX is heading shorter term, it's what follows
that should be of concern,

$USD FORECAST USDx works on the 30 degrees cycle quite well. Note the dates marked on the chart.
As on Aug 31, it bounced off the support level at 92.40 which happened to be the resistance on June 18. Incidentally92.40 is also the 0.33 retracement level.
I am expecting to see USD heading higher from here. Where will see gold if USD heads higher? my view is still bearish for gold.
Let's see where we go from here.