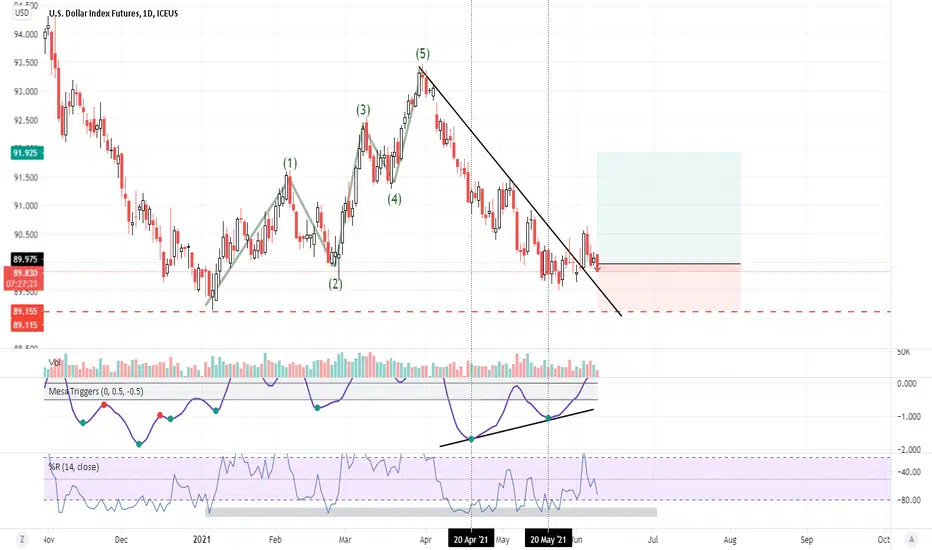
Risk reward ok on dollar.Being long the dollar might be a bad idea, but it's a pretty good opportunity to take a low risk trade using the previous pivot low as the bottom. It looks a little scary, but many of the more profitable trades are, so that shouldn't disqualify it totally.
Mostly I just wanted to see if I could find a trade to use the mesa trigger to find something on the daily.
SDX1! trade ideas

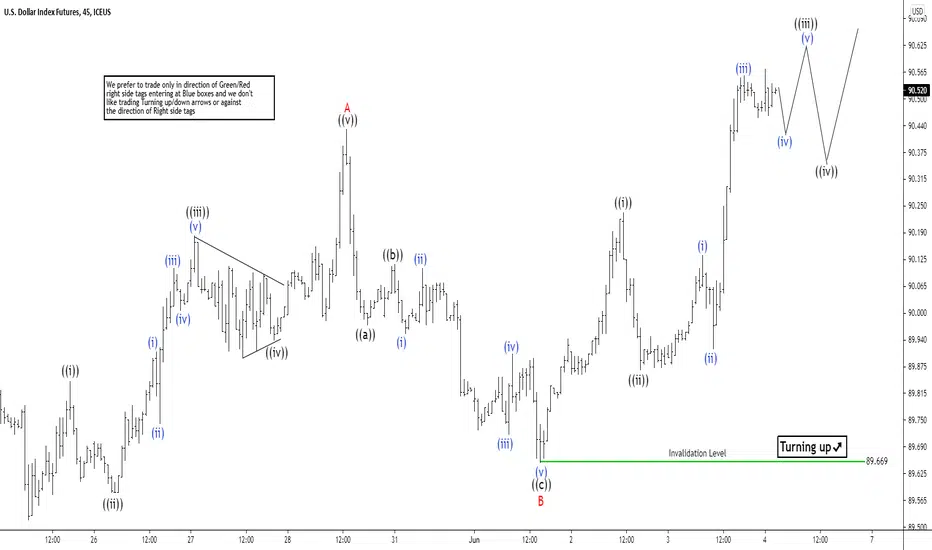
Elliott Wave View: Dollar Index (DXY) Correction In ProgressShort term Elliott Wave view in Dollar Index (DXY) suggests cycle from March 31, 2021 peak has ended. Index is now correcting that cycle and the correction should unfold in 3, 7, or 11 swing. The rally from May 25, 2021 low is currently unfolding as a zigzag Elliott Wave structure. Up from May 25 low, wave A ended at 90.44. Internal subdivision of wave A unfolded as a 5 waves impulse structure. Wave ((i)) of A ended at 89.84 and pullback in wave ((ii)) ended at 89.58. Index resumes higher in wave ((iii)) towards 90.18. Wave ((iv)) ended at 90, and final leg wave ((v)) of A ended at 90.44.
Wave B pullback has ended at 89.66 with internal unfolding as a zigzag in lesser degree. Down from wave A, wave ((a)) ended at 89.98 and wave ((b)) ended at 90.12. Final leg wave ((c)) of B ended at 89.66. Wave C is currently in progress and should see a few more highs before ending the cycle from May 25 low. Near term, while dips stay above 89.66, expect the Index to extend higher a few more highs before ending the cycle. The 100% extension from May 25 low comes at 90.57 – 91.1 where cycle from March 25 low can end and a 3 waves reaction lower can happen.
US Dollar's "swim or sink" analysis.US Dollar Future's 6-month candles
Sea level at 91.82.
Currently below and still sinking...
#usdollar #gotgold #gotsilver #debt #inflation

Elliot Wave on DXYWe can see clearly a elliot wave forming on Dolar index, ending this retracement leg, and moving to the next expansion which will lead to 90.400 area.. let's see.
This is not a trade, just a movement that will reflex on every dollar pair..
________
Da para ver claramente uma formação de onda de elliot no indice dólar, terminando essa retração atual e se movendo para a próxima expansão até a área de 90.4000... vamos ver.
Não é uma idéia de trade, é somente um movimento do índice, que reflete o movimento do dólar contra/favor dos outros ativos.


Talking To My Crypto Buddies Like 🤑🚀📈Saving Time With Little Talk. (Down) The CoinSLayer 👨💻😈 only knows (Down)
Looking for Directions??? Let me help you ⬆⬇⬅➡↪↩ Get it lol Good Bye!
My DM's: Digguss#101 "BITCOIN is programed to pump Have Fun Staying Poor Bro!!!"
Me: "okie-dokie" 🙃
What are your thoughts? Is it bad that people like to realize gains and say "Cool! More Dollars now!" Most will answer with an emphatic "YES!!!" LOL Or am I really the only person that's down to pull profit and even short a little??? LOL
No Advice to give just thoughts that I can't shake after the last 6 years in the world of "CRYPTO"
🤷♂️ #Fixed IDK Protect Your Neck!
🙏FOR JUST A HEALTHLY PULLBACK!
""KEEP CALM AND MANAGE THY RISK!""
I am The CoinSLayer 👨💻😈


DXY next target is 89.165We are forming 1st wave after correction. And next stop after few corrections is 89.165. But this one will be broken down for sure. Next really strong support is 88.500. Idea is alive. Sell USD, buy whatever you want.


Dollar officially Bye ByeFederal Reserve apparently won't interfere to get the dollar back again and we saw an important spike in the volume and a strong breakout with a big candle of an important support. MACD also gave a bearish signal so I think that's the end of the US dollar.


DXY - DOLLAR INDEX OUTLOOKBreak the support and broadening pattern seen. Down projection to 87-88
Disclaimer on


DXY on its way to 90Last C wave from 89 to 93 was C wave in ABC correction on bearish trend. Now we are forming wave 1 in new 12345 bearish move. This one might be both a 1 of 5 and 1 of 1. Anyway we will see correction ABC waves from 89-90 as 2 of 5 or 2 of 1. I marked those ABC waves as a default, but corrections never play it simple. I am waiting for wave A and will SELL EUR/USD holding it till 1.197. You must be a brave person to trade correction, but this one is simple.
