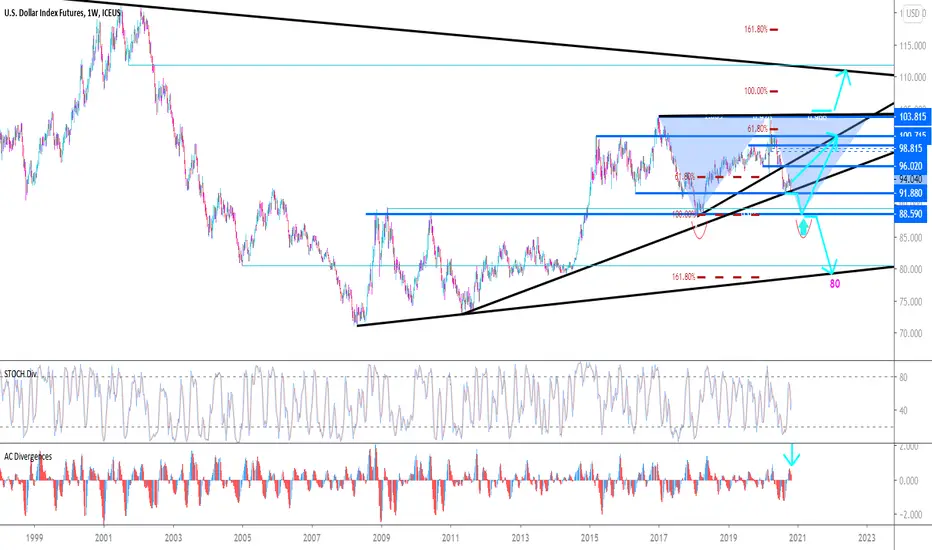
Multi symbol analysis (weekly) : DXY seems to be moving lower!Now that the US elections are behind us, all the intentions of the weekly chart of US DOLLAR / DXY seem as if it's going to move lower!
It is forming bearish order blocks (on Weekly), trapping longs all along the way since March 2020 & also there are a bunch of shorts trapped from April 2018 timeframe that would love an exit. Till price action reaches those zones, DXY is heading lower!
What this means?
USDXXX pairs to move lower
XXXUSD pairs to move higher
Equity to head higher
Another reason DXY could head lower is if more stimulus gets announced for the US economy.
I'll add more evidence from other forex pairs about why I think this move could be verified.
PS : Another way DXY could move is in a consolidation - as below the current price, we have unidirectional price movement from Apr 2018 timeframe - which could counteract lower movement.
SDX1! trade ideas

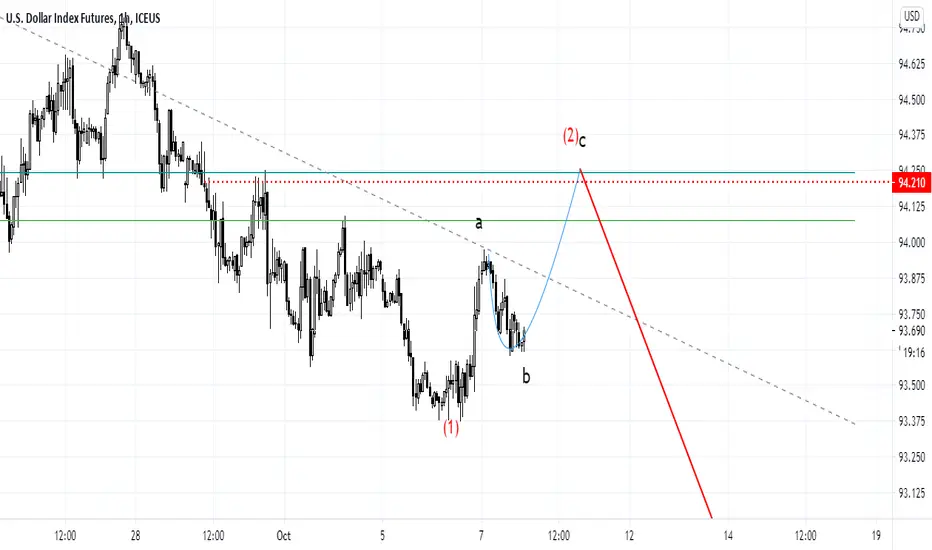
DXY (Dollar Index) 4H : Trapped buyers waiting to exit : SHORTTrade setup
DXY (Dollar index) has trapped buyers at the top. When price comes back to this zone, they'd love an exit - giving us a short trade in the process.
Risk management
1) Reduce 50% at 1R => Trade becomes risk free
2) Reduce further 25% at 2R AND move SL to break-even
3) Close trade at 3R
4) Winner = 1.75R
Strategy
Pickup a pair which is highly correlated to DXY (if trading DXY, ignore the correlation part)
AND
Wait for market structure to break, then trade the retest of that zone. Zone is drawn using the first candle which crossed the pivot high/low to begin trapping the traders
AND
Liquidity in form of equal highs/lows should not be present behind the stop loss
AND
Since the pair is highly correlated to DXY , the formation of HH/LL in DXY should support the trade's direction at the time of zone's formation


Dollar Inverted Head and Shoulders into Possible Cup & HandleHere we have several bull patterns on the dollar futures.
First we established and broke out of a bull pennant, Then we moved onto another bullish pattern, inverted head and shoulders, and now we've developed a cup. Is this a handle that formed on the cup?
Whichever way you look at it, this is very bullish price action on the dollar.
What I'm looking for is the price to break through resistance and into the blue channel while flipping the resistance into support and ultimately capturing the top of the blue channel.
ICEUS:DXY

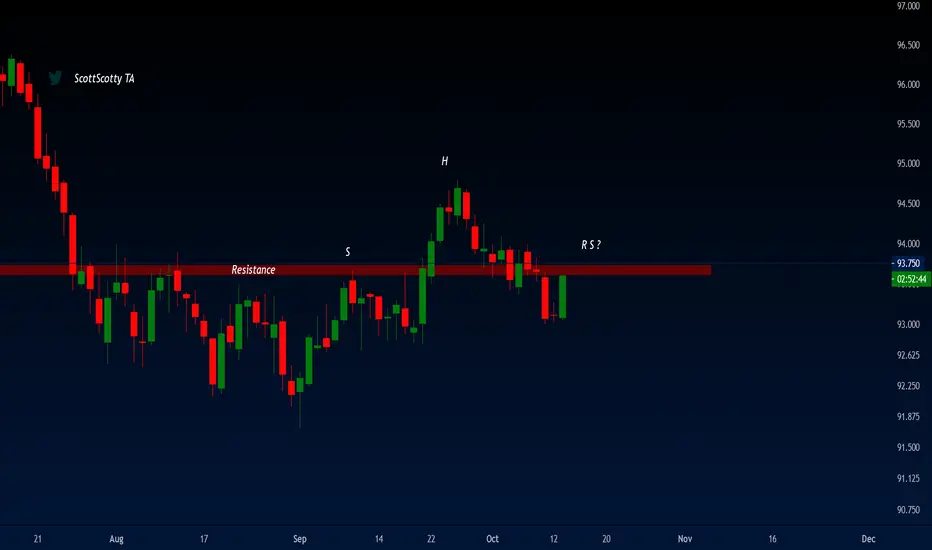
Inverted Head and Shoulders Playing Out On Dollar FuturesHere's a pretty clear head and shoulders that's currently breaking out.
With a lot of pressure on the equity markets this week, we may be looking at a lot of bullish momentum on the dollar for the next few weeks.


weekly in dollar index , 100 is very very important level (best place for sell)
AC(or stoch 5-3-3) show pressure on dollar is down (AC 240min show + pressure)
but for 2nd wave of corona , dollar 80% will go to up to 100 (put buystop on 4hour last high)
(20%) if it can break low(91.5) can go down , so put sellstop in low ,buylimit near 88
effect on
gold = gold can touch 1800 (heavy buylimit on it)and go to 2000then 2200 then 2400
forex= i feel (80%)dollar in forex (until end of 2021)will go down and euro,gbp will grow up
Time for the USD to rise...Previous talk about USD destruction, etc. have come a long way, and the USD indeed has devalued due to fundamentals. However, it broke out of a falling triangle/wedge, tested and is on the break out. For whatever reasons, the skew in the markets have pushed the USD too far down, and it is time for a USD rise. Clearly, sparked off by fear and such... so much so that bonds, precious metals and crude will be affected.
In retrospect, in mid-September, the signal was given as a preemptive warning.
Now, it is in a true breakout and should have its effect on dropping Gold and precious metals such as Silver. Crude would suffer. Bonds should be in good demand, etc.
Technically, the MACD (middle panel) is already showing support. The BMT (lowest panel) showing the relative strength and momentum is also breaking up with gusto, in good support for a size-able run up.
The USD Index is about to have a massive run up towards the end of the year, targeting 102 possibly, based on chart pattern break out.


DXY (Dollar Index) 4H : Trapped sellers waiting to exitThere are a whole bunch of sellers trapped in a fake move below old monthly low's - who would love to exit when price comes back to them - giving us a beautiful long entry.

DXY SELL AFTER 93.00 BREAKOUTkey level of 93 confirmed by many bounces on different time frames
we can see the price is falling sharply after the breakout signaling seller strenght
possibly the price already hit stop losses of many traders
this will lead to positive change in instruments with USD .
i saw nice build up on gold, and gbpusd with this break the price on those instruments is ready to shoot high

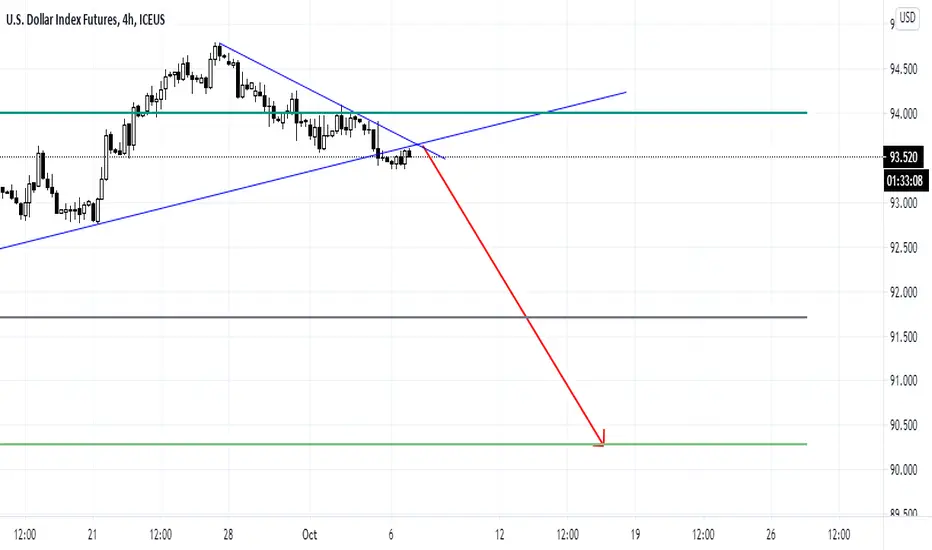
USD FuturesUS Dollar futures
On Friday DX found a triple support around 93.5 (EMA100/EMA200 and a trend support).
On a 4H chart, the DXY broke both, EMA 100/200 with increasing volume showing a bullish participation followed by a low volume correction and a successful test with a high volume test candle.
On a weekly basis, last week finished with a bullish move with high volume.
Bullish short-term sentiment
Resistance 94.7-95.5

DXY (Daily) LONG; "King Dollar" is back in the office!(Until now it was just checking it's emails - remotely :-) Buy it up!

USDOLLAR / DXY (monthly) : Faking below yearly low?30 yr yield is already making lower lows since March 2019 (signaling risk). Shouldn't DXY be negatively correlated to it?
DXY has recently dipped below a yearly low to collect liquidity. It's also an exit for trapped sellers from Jan 2018 low (blue box).
Watch out for a rally on monthly charts for DXY!
DXY up => risk OFF => Crash in stock market.
Let's see how this plays out.


USD SellThe Futures of USD Indexfinished the week on a red as the accompanying volume increased.
The growth of US dollar 3 weeks ago was with wide spread and low volume, showing no demand in place. Additionally, the price rejected to break the resistance level from March.
This is a sign of weakness as a new sell-off is comming in next weeks.
The most recent and strong support level is at 90 points. There is a trend line, which first point is in 2011, the second in 2014 and the third is going to be in 2020.


USD still bullishThe USD index turned bullish last month, retraced and appears to be ripe to rip.
Over the early part of this week, the USD index formed a piercing pattern just after it broke down the 55EMA (orange line). A gap up followed today’s opening, and if this follows through, then bullishness of the USD is firm.
Consequence to the USD upside includes a weaker S&P500, crude and precious metals.

U.S. DOLLAR INDEX FUTUREShello traders you can sell now and your eyes are closed
do not miss it guys and good luck for everyone...
USD Long term attitudeUSA in long term move toward weaker currency.
Probably because of export position in world and fight back China.
In mid term probably trump empower export position in next presidential for 4 year.

