DX1! trade ideas
Signs of fallI think this is a fake break
The Chondels announce
the start of a powerful fallout.
By failing and retesting again
The pattern forms the head and shoulders
Divergence in weekly TIME
This is just a personal analysis please do not make any final decision on this analysis


DXY short post CPIdxy is topping with a double top formation. the cpi is more of the same (higher). however, Dr JPOW has only one mandate and that is keep his job and be re-appointed. therefore, he wont do anything but be a dove.

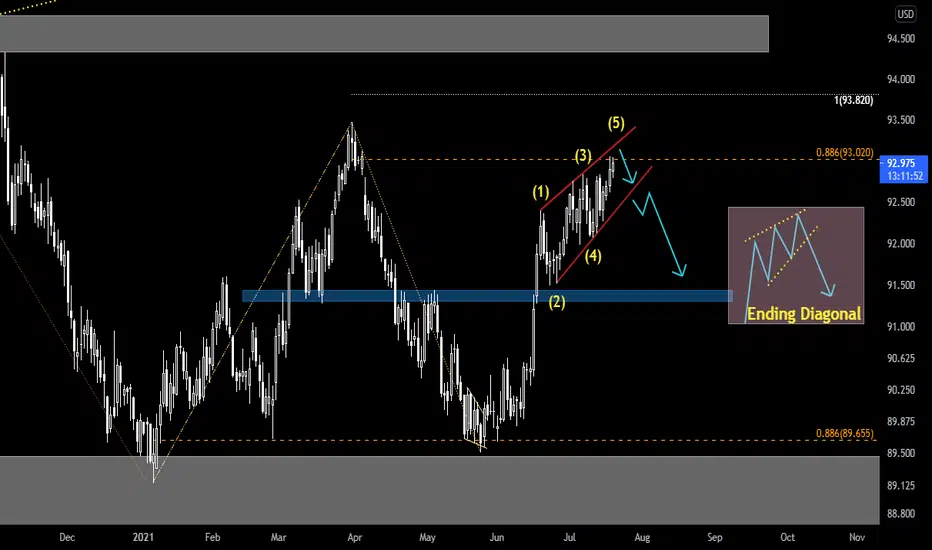
Elliott Wave View: Dollar Index (DXY) Further Strength ExpectedShort Term Elliott Wave view in Dollar Index (DXY) suggests that the rally from May 26, 2021 low is unfolding as a zigzag Elliott Wave structure. Up from May 26, wave (A) ended at 93.19 and pullback in wave (B) ended at 91.78. Wave (C) is currently in progress as a 5 waves impulse but the Index still needs to break above wave (A) at 93.19 to confirm.
Up from wave (B), wave ((i)) ended at 92.2 and pullback in wave ((ii)) ended at 91.81. Index then resumes higher again in wave ((iii)). Up from wave ((ii)) low, wave (i) ended at 92.35 and pullback in wave (ii) ended at 92.1. Wave (iii) ended at 92.92, wave (iv) ended at 92.71, and wave (v) of ((iii)) is expected to end soon. Index should then pullback in wave ((iv)) before turning higher 1 more time in wave ((v)). This should complete wave 1 in higher degree. Afterwards, expect the Index to pullback in wave 2 to correct cycle from July 30 low before it resumes higher. Near term, as far as pivot at 91.78 low remains intact, expect dips to find support in 3, 7, or 11 swing for further upside.

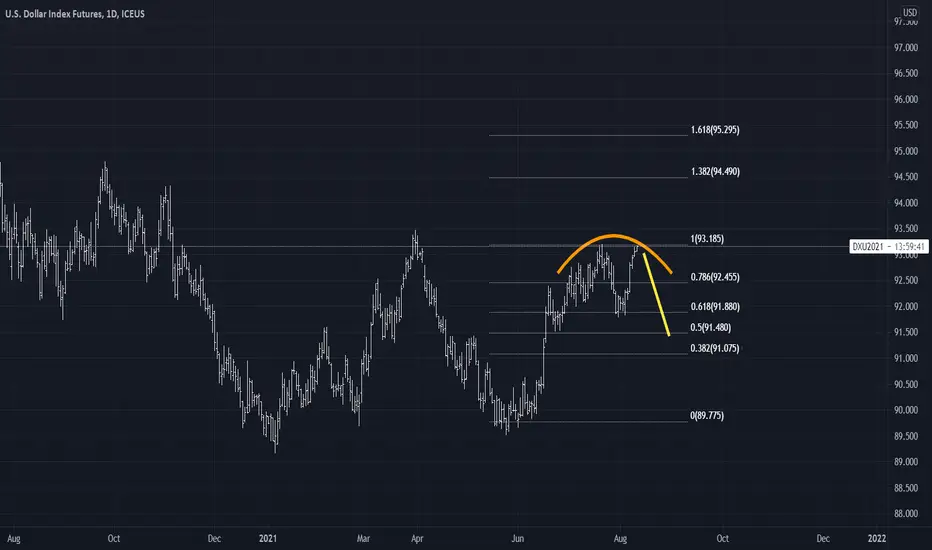
Dollar Index - Cup & Handle ProjectionA bullish cup & handle / double bottom projection will be completed upon price breakup of the 93.2 region.
Cup & handle projected target in the 97 region, coinciding with VPVR resistance zone (shaded red).
Happy trading!

Dollar looking for excuses to fallWe are at a point where most likely the dollar will fall with a ready token
look at the chart and follow the signs

start fallaccording to the forecast of the fall . This has begun. Previous channel failure and trend entry into the downtrend channel


~INSIDE A WEEKLY/MONTHLY WEDGE~ALERT SET AT 94 CENT FOR POSSIBLE REVERSAL FOR A RETEST OFF THE LAST GREEN DEMAND ZONE(LOOK LEFT)!
CURRENTLY BULLISH CANDLE IN CONSOLIDATION!

DXY gains strength, but will it blendThe immediate downtrend is broken, but on the longer term chart there are some significant headwinds are also appearant in the short/medium term at the 93 area

another look to dollar Sometimes simply a few indicators and a few oscillators can be easily detected for the process
The market always surprises you. Be careful no analytical is 100%

Dollars in the sensitive areaI see the dollar trend bearish in the long run . But now it's in a very sensitive area where breaking the resistance or the back will cause a sharp movement Be ready for a great profit after stabilizing the trend direction

sell dollars buy gold.The Candles show the dollar's high willingness to fall after the failure of our support we see a rapid fall at 90.65, of course the market will always surprise you this is just a simple analysis please do not take any action without your checkouts

The dollar do expected to make a big correction.The marks specified in the chart show the sign of a fallout. After the support area is broken, of course. Keep an under watch out for signs. it smells like a big profit

The Dollar Index Breaks Higher - A MirageAfter trading at the highest level since 2002 during the risk-off period when COVID-19 spread worldwide like a wildfire, the US dollar index fell, making lower highs and lower lows from March 2020 through January 2021. The index fell from 103.96 to a low of 89.165, a 14.2% decline in the index that measures the dollar against other world reserve currencies.
The Fed tightens without tightening credit
The dollar index breaks above a technical level
The greenback remains in a medium-term bearish trend
The long-term trend is higher
Fiat currency moves are a mirage for one critical reason
After consolidating around the 90 level from mid-May through mid-June, the dollar index took off on the upside in the aftermath of the latest Fed meeting. While the dollar has moved higher and eclipsed a short-term technical resistance level, the medium-term trend remains bearish. To confuse matters, the long-term trend dating back to 2008 is bullish for the US dollar index.
Governments and monetary authorities manage currency markets to provide stability for global financial markets. Meanwhile, the overall foreign exchange market is more than a mirage because it is not readily apparent if the asset class gains or loses value in a larger sense. The bottom line is that the dollar and other fiat currencies rely on the full faith and credit of the governments that issue the legal tender. The dollar may be rallying against other currencies, but it can also be losing purchasing power making the entire currency market a farce.
The Fed tightens without tightening credit
At the June Federal Market Committee meeting, the US central bank left the short-term Fed Funds intact at zero to twenty-five basis points. The committee said it would leave its quantitative easing program unchanged and continue to purchase $120 billion in debt securities each month. The only change was a slight increase of five basis points in the reverse repo rate. The bottom line is the Fed continued on its accommodative monetary policy path.
Meanwhile, the central bank increased its GDP growth forecast from 6.5% to 7% and its inflation expectations from 2.5% to 3.4%. While very little changed, the rhetoric shifted towards tighter credit policies as the Fed acknowledged rising inflationary pressures. Seven committee members project a rate hike in 2022, with two expecting two increases in the Fed Funds rate. The markets viewed the statements and rhetoric as a sign that tighter policy is on the horizon and tapering QE will occur sooner rather than later.
Commodity prices fell in the wake of the Fed meeting as rising interest rates increase the cost of carrying raw material inventories and financing production. The dollar moved higher as interest rate differentials are a critical factor for the value of one currency versus another.
The dollar index breaks above a technical level
The dollar index took off on the upside in the wake of the June FOMC meeting, surpassing a short-term technical resistance level.
The daily chart of the September dollar index futures contract illustrates the move above the May 5 91.41 high on June 16, the day after the June Fed meeting. The index rose to a high of 92.395 on June 18 before correcting. At the end of last week, the September dollar index settled at the 91.844 level, above the breakout level at 91.41, which is now technical support. The prospects for higher US interest rates were bullish winds in the dollar’s sails.
The greenback remains in a medium-term bearish trend
While the dollar index rose above a technical resistance level, the greenback remains in a bearish medium-term trend despite the recent rally.
The weekly chart shows that the index has made lower highs and lower lows since March 2020. To negate that bearish trading pattern, it needs to rise above the critical resistance level at the 93.47 level from the week of March 29, 2021. If the dollar index stalls and fails to rise above that high, it will put in another lower peak to continue the bearish trend over the past fourteen months.
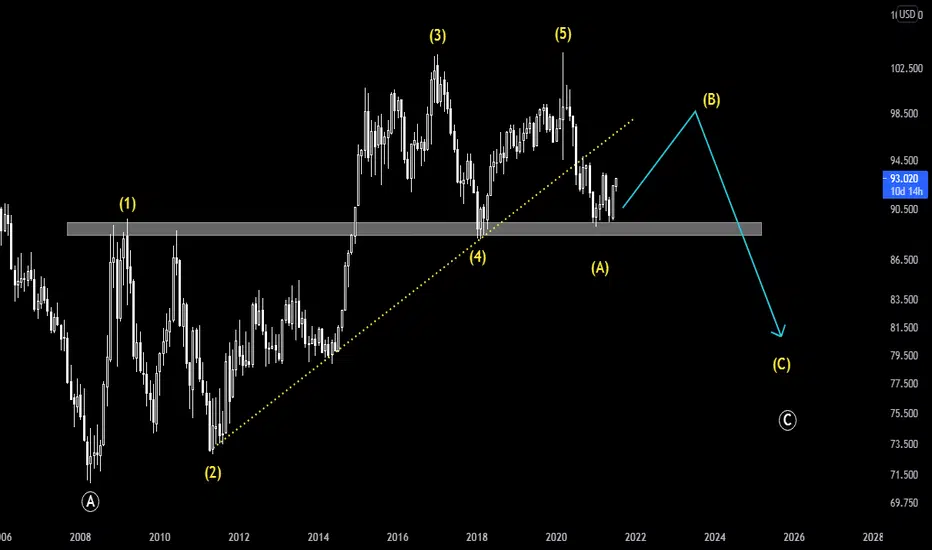
The long-term trend is higher
To confuse matters, the dollar index’s long-term technical picture remains bullish over the past thirteen years.
The quarterly chart highlights a pattern of higher lows and higher highs for the dollar index since reaching a bottom at 70.805 in early 2008.
With a bullish short-term trend, a bearish medium-term pattern, and a bullish long-term trend, the path of least resistance of the US currency against other world reserve currency remains in doubt. However, it may not matter if the dollar index moves higher or lower against the euro, yen, pound, and other leading fiat currencies. The index could be a mirage masking the overall weakness in the foreign exchange arena.
Fiat currency moves are a mirage for one critical reason
The foreign exchange market only measures the value of one currency versus another. The price differentials tell us nothing about purchasing power other than if one foreign exchange instrument is trending higher or lower against another.
The recent rise in the dollar index that followed on the heels of a more hawkish tone from the Fed could be a mirage. The bottom line is the dollar’s purchasing power has been declining. The May CPI data shows a 5% increase and a 3.8% rise, excluding food and energy. While many commodity prices corrected lower in June, crude oil and natural gas made new multi-year highs. The energy commodities power the US and the world. Rising prices are inflationary.
Inflation erodes the value of money, making it more expensive for consumers to purchase essentials. While the dollar index recovered from the 90 to around the 92 level, the move is a mirage that masks the long-term trend in all fiat currencies. In 2019 and 2020, gold reached a record high in all fiat currency terms. Gold in euros, pounds, yen, dollars and most other foreign exchange instruments rose to record levels. Central banks hold gold as an integral part of their foreign exchange reserves, making the yellow metal a reserve currency alongside the dollar and the euro.
The bottom line is that inflationary pressures continue to rise. The dollar index could continue to power higher over the coming days, weeks, and months, but the US currency could be weakening at the same time. A pivot towards a more hawkish approach to US monetary policy may lift the US currency, but that may only make the dollar the healthiest horse in the glue factory.
Click the link below to register for the Free Monday Night Strategy Call
Trading advice given in this communication, if any, is based on information taken from trades and statistical services and other sources that we believe are reliable. The author does not guarantee that such information is accurate or complete and it should not be relied upon as such. Trading advice reflects the author’s good faith judgment at a specific time and is subject to change without notice. There is no guarantee that the advice the author provides will result in profitable trades. There is risk of loss in all futures and options trading. Any investment involves substantial risks, including, but not limited to, pricing volatility, inadequate liquidity, and the potential complete loss of principal. This article does not in any way constitute an offer or solicitation of an offer to buy or sell any investment, security, or commodity discussed herein, or any security in any jurisdiction in which such an offer would be unlawful under the securities laws of such jurisdiction.

Strong & Weekness End Of 26 Jun 2021Time Frame D1 (Find your right pairing coming soon)
USD - Stroger
GOLD - Stoger
GBP - Medium
AUD - Medium
CAN - Medium
EUR - Weekness
CHF - Weekness


US Dollar's Point and Figure ChartWhat was the sentiment when it had dropped hard and resting on support line? Didn't stop it from dropping alot more!
Bad things happen when below 12 & 36 period moving averages.

dollar index mega trendAccording to my previous analysis of bitcoin, I can say that when the bitcoin reaches the ceiling, the strength of the dollar should be the lowest. The date of this event can be December 2021. Up to 88
Do you think this will happen?
