DXY on its way to 90Last C wave from 89 to 93 was C wave in ABC correction on bearish trend. Now we are forming wave 1 in new 12345 bearish move. This one might be both a 1 of 5 and 1 of 1. Anyway we will see correction ABC waves from 89-90 as 2 of 5 or 2 of 1. I marked those ABC waves as a default, but corrections never play it simple. I am waiting for wave A and will SELL EUR/USD holding it till 1.197. You must be a brave person to trade correction, but this one is simple.
DX1! trade ideas


US DOLLAR BULL RUNDXY BROKE THE RECENT STRUCTURES PROVES TO BE BULLISH.. IT LL BE BULLISH FOR THE WEEK


End of the downtrend
The dollar has reached its lowest level in a recent month, which is why we have seen the growth of all currencies against the dollar, and as you can see, it has formed a downward channel and has accompanied it to the trend line, but in your opinion this The decline will continue and the trend line will be lost ?? Such a thing is unlikely to see a return of the dollar to 93, and this time we will see a decline in currencies against the dollar, and after fully touching the trend line, we will see an upward trend.

Elliott Wave View: Dollar Slides After FOMC MeetingShort term Elliott wave view in Dollar Index (DXY) suggests the decline from March 31, 2021 high is unfolding as a 5 waves impulse Elliott Wave structure. Down from March 31 high, wave 1 ended at 92 and bounce in wave 2 ended at 92.41. The Index then resumed lower and ended wave 3 at 90.85 as the 45 minutes chart below shows. Bounce in wave 4 ended at 91.42 as a zigzag where wave ((a)) ended at 91.4, wave ((b)) ended at 91, and wave ((c)) ended at 91.42.
Wave 5 lower is currently in progress with internal subdivision as a 5 waves impulse in lesser degree. Down from wave 4, wave ((i)) ended at 90.68 and bounce in wave ((ii)) ended at 91.12. Index has resumed lower in wave ((iii)) and should see a few more lows before ending wave ((iii)). Afterwards, it should bounce in wave ((iv)) before turning lower again in wave ((v)). Near term, as far as pivot at 91.128 high stays intact, expect rally to fail in the sequence of 3, 7, or 11 swing for further downside. Short term target for wave ((iii)) is 100% – 161.8% Fibonacci extension of wave ((i)) at 89.9 – 90.4.


US dollar Index future - Kevin C. BestTraders & Investors, I hope you will enjoy from my analysis. This is not a financial advise, but feel free to get inspired.
Please see below image, with my potential Entry and stop based on fibonacci levels.
- I expect prices to again create price action as the previous low-low (marked in a orange circle) and create a perfect copy.
- Therefore prices will need to receive demand, this will fundamentally be based on fundamental forecasts.
- If prices can't break or simply fake the breakout, prices might continue to the next support levels. Somewhere around the 90.000 levels.
- Based on my indicator prices become longly oversold, which might create uptrend momentum
* Let me know in comment your thoughts and give it a like if you agree.
Happy to discuss if you have any feedback/questions.
Regards,
Kevin C. Best

Dollar's next move is up and stocks downCup and handle on the 4 hour chart = potential move to 97.5 and stocks down big.

Dollar's next move is up and stocks downThe dollar has hit and now testing the support level, the next move is up and the stock market down.


DXY US Dollar Index forecast, Sell Bounce, Target 77.07ICE:DX DXY US Dollar Index
Trade : Sell Bounce
Entry : 92.5
Target : 77.07 (15.43, +16.68%)
Stop : 95.24 (-2.74, -2.96%)
Posted on Tuesday, December 22, 2020
Note : The dollar index (DXY, ICE : DX) is expected to continue to fall and fall. There seems to be no strong support lines to stop its falling. We may guess, as supports, 85.10, 83.38, 77.07 and 70.48. Resistance could be 95.24.
Is the US dollar still alive?
Or, is it already dead?
US dollar is still alive but barely breathing. Probably, there will be a dollar crash next year. It would be very severe, so it would make people dumbfounded. Even now, the value of US dollar itself is constantly falling and falling. We should see this.


US DOLLAR INDEX 96 IN 35 DAYSThe dollar index seems determined to return to pre-pandemic levels.
US minting does not seem to work.
DXY has now exceeded the EMA 200 level and has its approval. (1D CHART)
Too risky to stay in stock markets

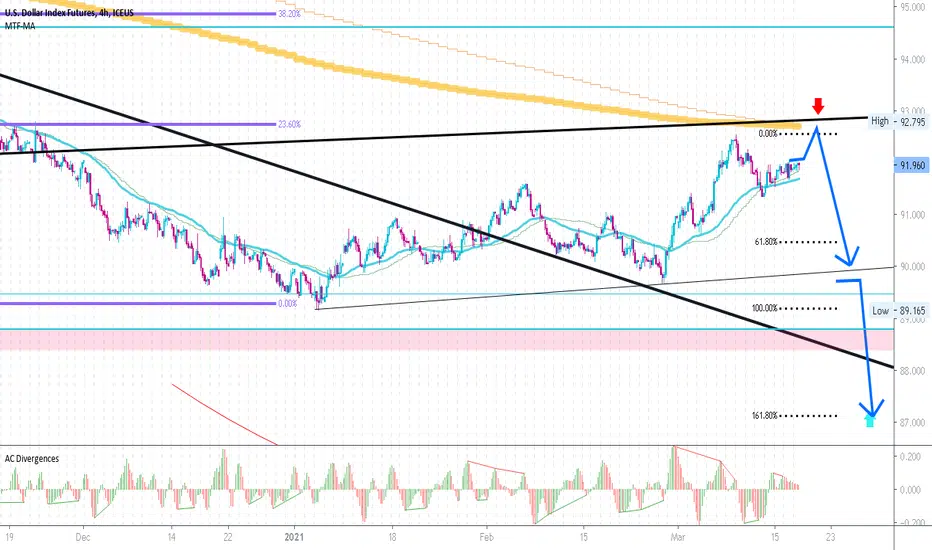
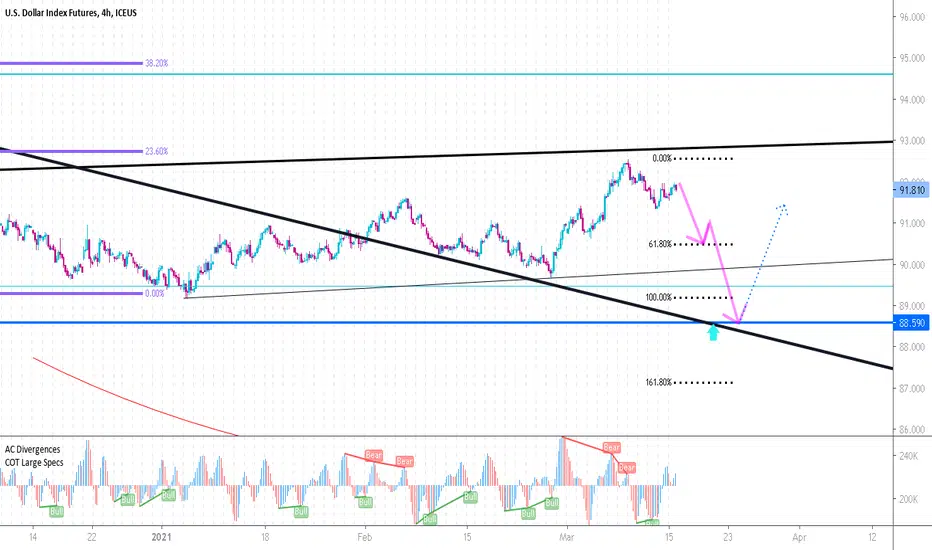
open sell near daily Ema200our target1 is fibo 61% target=fibo 161% = 88
we belive eurusd,gold will fly up
if trend break ,becouse main trend is down,dxy cant go up easily ,,,we advice looking for sell dollar ,buy gold,silver and hold them 3 week


How the value of the Dollar and Gold impact marketsThis is a little different than what I usually do. Very straight forward line charts of the IXIC, DJI, and SPY. Showing how the changes in the value of the Dollar over Gold, impact the market. I know this isn’t the only influencing factor, as each market has its own levers, but this simple deviation of the two can weigh heavily on the markets.

be sure time to sell dollarwe seen dollar target 1= fibo 61% and can drop to fibo 161%
so dont fear sell dollar in next 3 week
next days is exclent time for buy gold , sell dax index

US Dollar to reach $93US Dollar has broken out of a down trend. It's not out of it yet but there's a higher low at end of Feb.
20MA is above 50MA and this means a short term up trend is in place. Today's candle should close above yesterday's, signalling a reversal.
I'm forecasting a stronger Dollar but for now, target profit 1 is $93 area.
Target profit 2 is $95 but that will be awhile still, and depends on the price action if and when it hits $93.
Disclaimer: I'm not giving any trading and investing advice. I'm just sharing my chart observations.
If you have any symbols that you'd like me to analyze, feel free to drop me a comment.
Thanks!

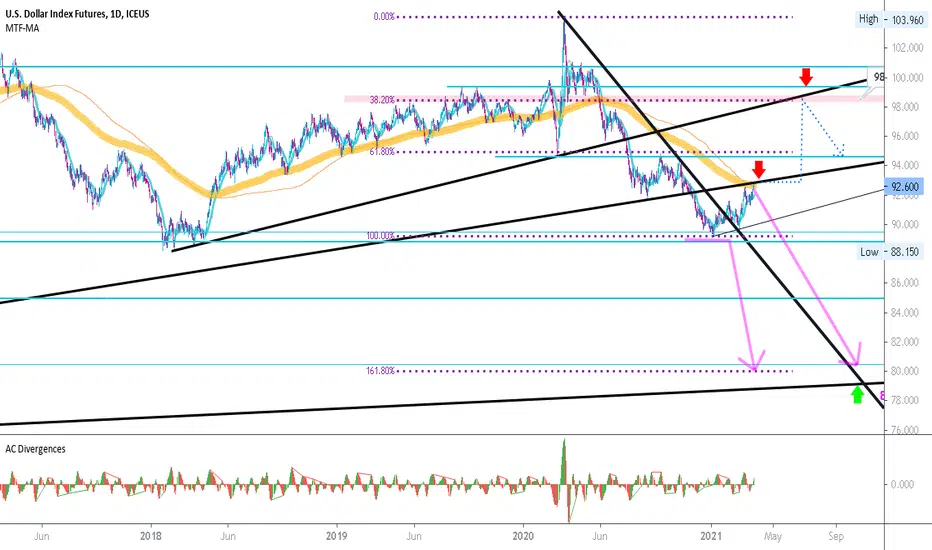
dont fear sellimit on daily Ema200we predict dxy will touch daily ema200(orange line) then will start new down trend