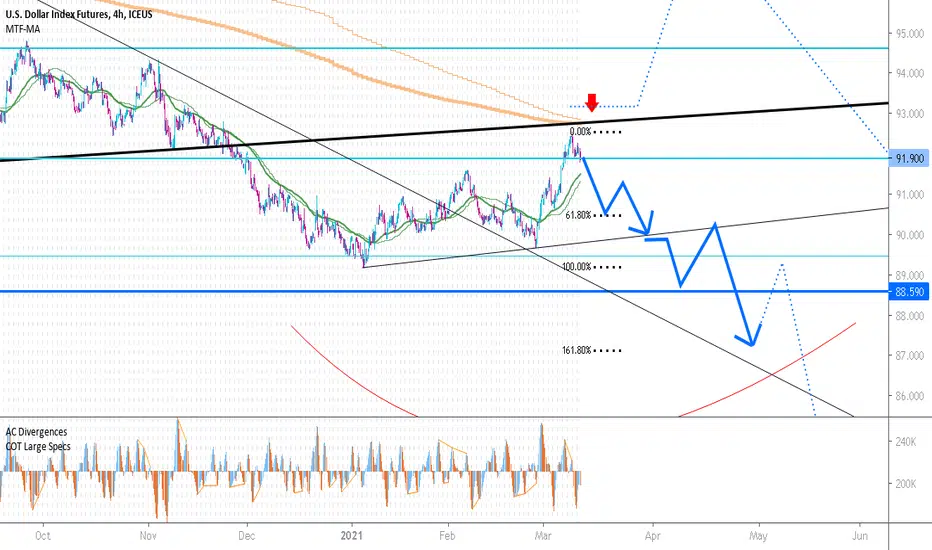
Dollar strength all the way?Price could still reverse and break the 91. level for a retracement.
However I'm Short AUDUSD and Long USD MXN.
DX1! trade ideas

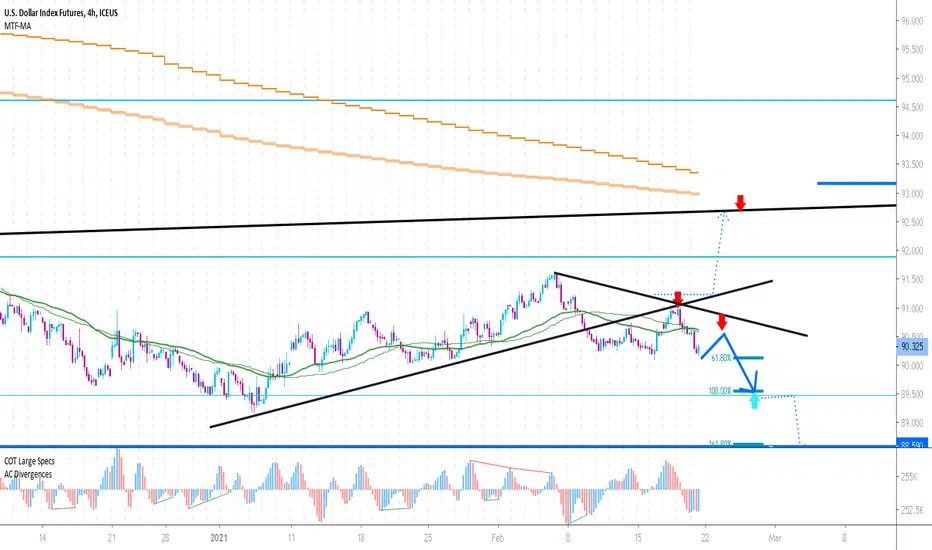
USD DOLLAR bearish 90.40 & 90.00key reversal and insurance bar signs for weakness. 90.40-00 initial support

fibo 61% is target we calculate many thing and find dollarindeex will see 80
we advice stand in sell side,looking for sell ,dont pick buy signals

DXY 88-87If you want to bubble in the stock and crypto market, first weaken USD. Than you will get what you want.


DXOne!Not legal and financial advice;
Any information provided here is only the personal opinion of the author.

new down wave starteddollar index if break low,can see 85$
best time for buy gold and hold until 1920
DX: buy stop 90.38 SL 90.15 TP 90.75A short-run corrective bullish bounce till early TH is expected, while the major positions are still bearish from TH-FR this week.

Gann Fan Analysis and Short Term ProjectionDXY appears to have an opportunity for upside recovery early in the next trading week if price holds above the current fan angle until today's market close.


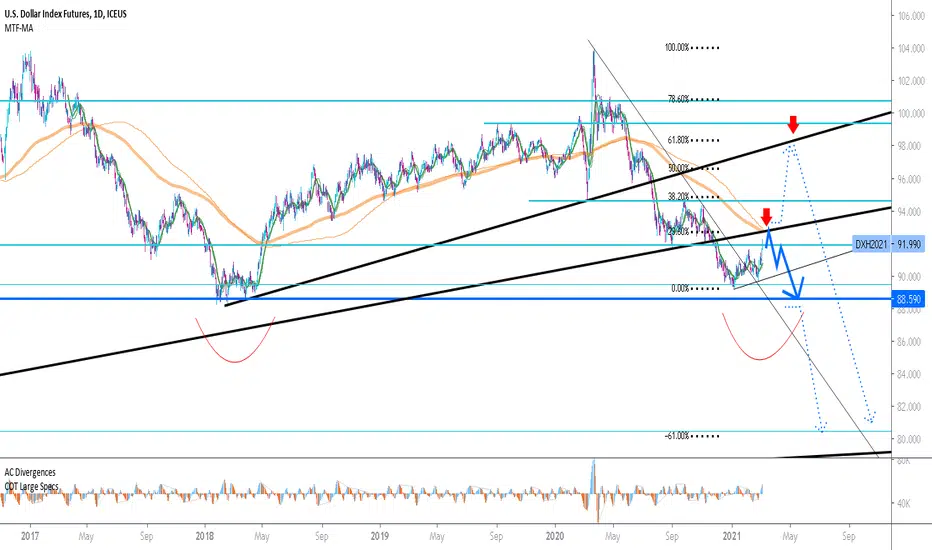
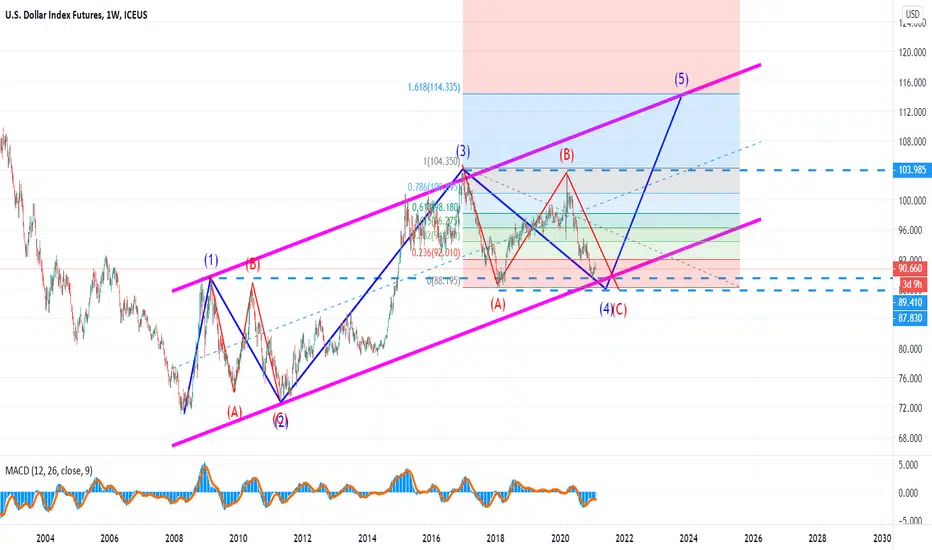
U.S. DOLLAR CURRENCY INDEX (Long Term) UpdatedWe should wait for a big change in the Dollar Index trend..., Then start buying big...
US Dollar's Monthly ChartApproaching tipping point area 88 for US Dollar.
80 area is target if that threshold is convincingly breached on a monthly close basis.
#dxy #usdollar #gold #silver

we can all wipe our asse(t)s with dollar billsprinting too much fiat... lost half of Americans trust with disenfranchisement = bad recipe


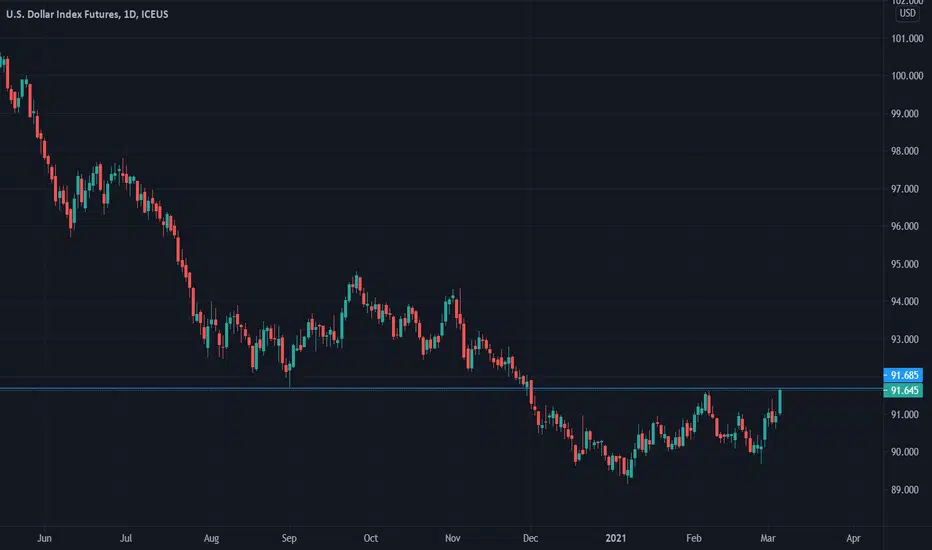
US Dollar breaks trend line dating back a yearI am looking at US Dollar today. It has broken a major trend line going back a year or more. In April of 2018, it broke a major trend line and started a strong push-up. WIll that happen this time? Well, first let's start with a 3 monthly Linear Regression tool. I use 3 months for a trend. Pearson's R value is 0.6955 closer to .50 than it is to .9. This is important because it is telling me that price is separating further than the mean and that could be a sign of a slowdown in direction. Next, Money Flow Index has clearly shown a push to the upside from the 89s which is where we bounced in April 2018. This confirms the Pearson's R-value and the overall slow down. And lastly, Volatility. the Normalized ATR is showing increasing volatility in a trending upward slope. How do I know that the US Dollar will start its push up? I don't but I will be looking for increased volatility and VOLUME. Volume will be key the rest of this week and next.

DXY DOWN! LOOK AT THE BIG PICTURE“History Doesn't Repeat Itself, but It Often Rhymes” - Mark Twain.
*Not financial advice.

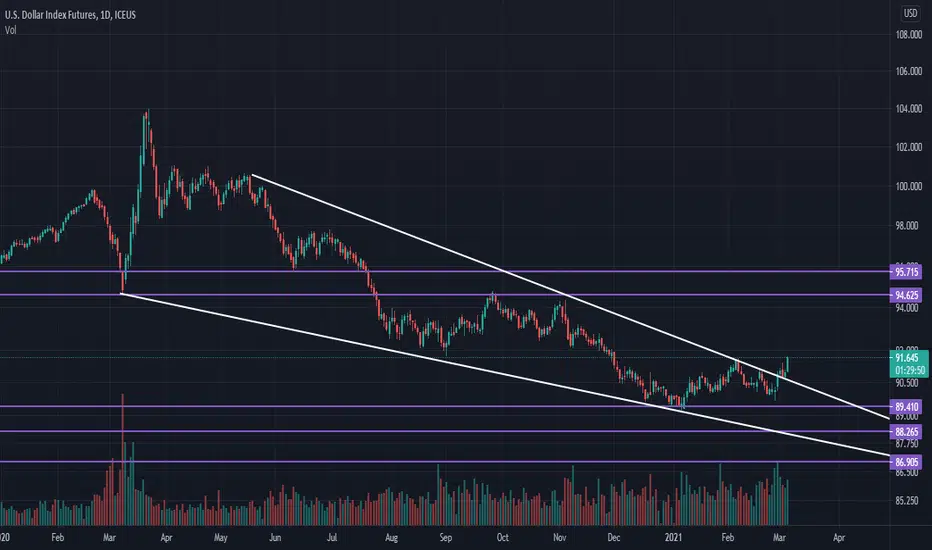
United States Dollar Looking BullishThe United States Dollar is looking bullish. Shorter timeframe chart has formed an Inverse Head and Shoulders Pattern, the longer timeframe chart has formed a Falling Wedge. A breakout of these patterns will signify more upside and potentially some trouble in the US Stock Market.
