DXY (US DOLLAR INDEX): DT ContinuationBULLISH:
Despite the recent encouraging economic data, such as the Empire State Manufacturing Index and optimistic retail sales forecasts, the dollar has gained momentum and broken out of its downtrend.
BEARS:
On the 5D timeframe, the analysis of the curve indicates that the US Dollar Index is currently experiencing a downtrend. It appears that the recent rise in the DXY may just be a temporary pullback, with a high probability of returning to the downtrend.
The DXY is approaching two levels of resistance, with the first one at 105.87 and the second one at 106.66. These levels could potentially lead to a rejection, causing the downtrend to continue.
DX1! trade ideas

US Dollar Index (DXY) Update- Small pump then Dump.
- Keep it simple.
- Everything in graph.
- Older analysis. 👇👇
Happy Tr4Ding !

USD/CHF to lead DXY higher, AUD/USD, EUR/USD lower?Our bias is for the US dollar index to rise to 105 over the near-term. The daily chart respected trend support from the December low, and the 4-hour chart shows a small ascending triangle which implies a break above resistance.
Out of the FX majors, USD/CHF looks ready to break above resistance and lead the dollar broadly higher. Bears could also consider a short on AUD/USD on the assumption the high of RS (right shoulder) has been established, and seek a move down towards the neckline at a minimum. A break of which could see it head for the projected H&S target around 0.6580.
If the US dollar index goes higher, surely EUR/USD should move lower. Bears could enter short with a view to target the swing low around 1.0835 or the bullish trendline.

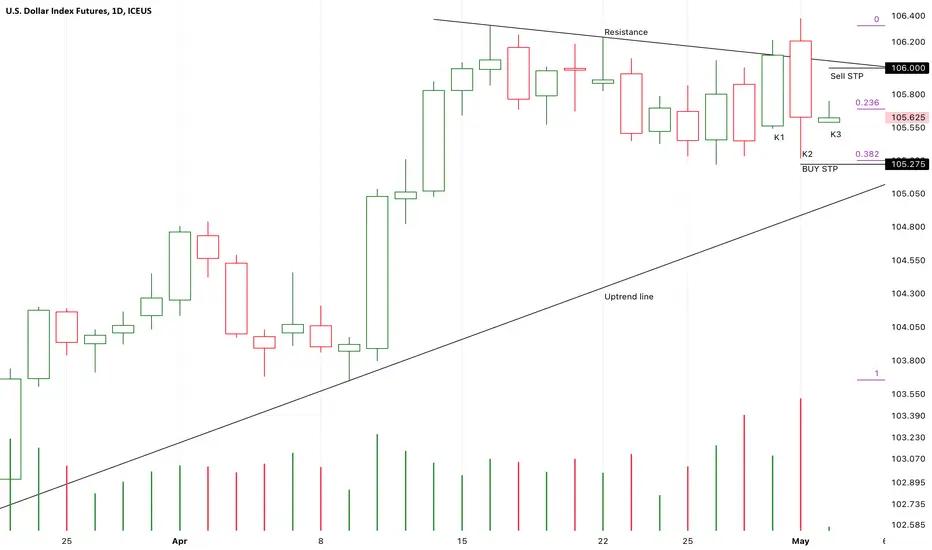
Chart Pattern Analysis Of DX1!
K1 and K2 is a strong bearish dark cloud cover pattern,
If the following candles couldn’t close below K2 to verify the strong momentum.
It will be a good place to buy here.
If the following candles close upon the resistance,
It is a second good place to buy in.
K2 is also a potential right top of a large scale bearish double top pattern.
If K3 rebound under low volume,
It will be a good place to sell it there.
Buy-105.5/Stop-105.3/-Target-110
Bearish Elliott Wave Sequence in Dollar Index (DXY) Favors DownsShort Term Elliott Wave in Dollar Index (DXY) shows incomplete bearish sequence from 4.17.2024 high. Down from there, wave 1 ended at 104.08 like the 1 hour chart below shows. Rally in wave 2 unfolded in a double three Elliott Wave structure. Up from wave 1, wave (w) ended at 104.79 and dips in wave (x) ended at 104.39. Wave (y) higher ended at 105.12 which completed wave ((w)) in higher degree. Pullback in wave ((x)) ended at 104.33 and rally in wave ((y)) ended at 105.18 which completed wave 2 in higher degree.
The Index has turned lower in wave 3. Down from wave 2, wave (i) ended at 104.63 and wave (ii) rally ended at 104.89. The Index then nested lower with wave i of (iii) ended at 104.36. Wave ii of (iii) ended at 104.76. The Index extended lower in wave iii towards 104.14 and wave iv ended at 104.25. Wave v lower ended at 103.99 which completed wave (iii). Near term, as far as pivot at 105.18 high stays intact, expect short term rally to fail in 3, 7, or 11 swing for further downside.

USD DOLLAR possible long for short term4h time frame price tapped demand zone. suspect bullish for 105.60. if price retest 104.00 then ideal long setup on usd dollar. stop loss below 103.70, target: 105.60

Will the Dollar continue its Downtrend or change its Direction?The dollar index #DX1! respected its previous downtrend and the News about CPI (Consumer Prices) today helped with this movement to the downside.
Will the Dollar continue its Downtrend or will change its Direction to the Upside?
CPI m/m
Actual: 0.3%
Forecast: 0.4%
Previous: 0.4%
Empire State Manufacturing Index
Actual: -15.6
Forecast: -9.9
Previous: -14.3
"The dollar index, which measures the greenback against a basket of major currencies including the yen and the euro, fell to a one-month low at 104.41, but later pared losses to trade 0.25% lower at 104.77".
References:
-https://www.forexfactory.com/index.php
-https://www.reuters.com/markets/currencies/dollar-droops-ahead-crucial-cpi-test-yen-under-pressure-2024-05-15/

DXYWell that's the idea.. All up to papa Powell. All the supply and demand area is confirmed with Fib levels. Im just not showing where those fib levels are..

US dollar short long termas for this week Jerome Powell & his team have maintained the interest rates at 5.50% signaling a bit of hawkishness, but i do belive there is room for a push further up to 109ish the a major plunge is gonna develop after that.....cheers

DX updateDX - Dollar!
1 hour Chart. DX is at Resistance. So, once it break, we going to next level (by arrow).

A DXY is showing a big Opportunity to buyWe have a big consolidation wich have a power to impulse the price up 112 points.

BULLISH DOLLARS MEANS TROUBLE FOR OPPOSING CURRENCIESLong term/Semi-marco:All major time frames are indicating that the dollar is very strong and trading against it will definitely be unwise especially when there's fundamental backings.
any currency trading against the dollar is in trouble.
PAIR TREND
12MONTHS=====> BULLISH
6MONTHS =====>BULLISH
3MONTHS=====>BULLISH
1MONTH======>BULLISH
WEEKLY=======>BULLISH
DAILY=========>BULLISH.
#REDFOXXX

Swing trade shorts for USD index (DXY)A potential swing trade short has presented itself on the daily chart.
DXY failed to closed above 103 and formed an inverted hammer on the daily chart, and its upper wick met resistance at the 38.2% Fibonacci level. Daily trading volumes also declined whilst prices rose gradually, against the prior (and more aggressive) leg lower. This suggest the -day rise is corrective, hence the call for another leg lower.
Bears could fade into rallies within Tuesday's candle with a stop above and target the 102 area, near the 61.8% Fib level and high-volume node.

$DXY Weekly OverviewDirectional Bias: Bearish
Narrative
- The initial forecast i did for DXY played out well last week() with volatility coming into the market to push prices lower. I am still bearish on the dollar
- We traded below previous months low, and this is where i would like to pause to get new context to go lower from the weekly timeframe, after the creating an expansion candle, would like to see weekly create a new FVG low to indicate further decent for the DXY
- The Daily Has a bearish FVG overlapping with the Fair Value area. this is where i would like to see price continue lower from for this week. However with volatility coming into the market from Tuesday CPI, we may see price consolidate today.
Targets:
- Previous Weeks Low - 102.300
Medium Term Targets:
- Monthly Low 101.030
- Monthly Swing Low- 100.320
- Quarterly- 99.220

US DollarImo this is a very big level for the dollar going back decades. But more recently it marked the high in 2017 and again in 2020. I think we get a large move off this level in the coming weeks due to the 9 ema crossing the 21 ema last week. Price is also consolidating between VWAPs from 2020 lows & 2022 highs which should provide for an even larger move once it breaks out of the range (this chart is futures which includes volume). Price is currently sitting above the 2017 high level and weekly 50 sma which is still technically still sloping down. This could all change in a second though so will be looking for confirmation on lower timeframes over the next few weeks. The direction of the dollar is important imo because I don't think stocks can go higher if the dollar is as well.

Dollar Index Could Be Topping HereThe DX price is right in a resistance zone as noted with the rectangle and also with the two price tops circled in black. We also have a spiking weekly candle.
To increase the odds, it would be good for DX to close down below 103.80 tomorrow, Friday, February 9, 2024. The current price is 104.01.
Another confirmation of lower DX prices would be a close below the trend line.
Lower DX prices would imply gold stocks,, gold, silver and other commodities going up; also, stocks often benefit from a lower dollar.

Accumulation before the level, free zone after the levelAccumulation before the level, free zone after the level

Sharp corrective pattern? DXY becoming strongerDear Friends,
I hope this message finds you well and that you're having a great start to the week. I wish you success in your business endeavors.
As someone interested in the Elliott Wave principle, I find it a valuable tool for analyzing the market. I have developed my approach by combining this principle with my personal experience and by considering various scenarios that are likely to occur in the market.
I am sharing my analysis with you, but please note that I am not providing any buy or sell signals. I aim to share my unbiased analysis with you so that you can use it as a guide to make informed decisions.
In the attachment, you will find my previous analysis of the same market, so you can compare and see the differences. All the details of my analysis are clearly labeled, making it easy for you to understand (although having a basic familiarity with the Elliott Wave Principle theory will help you understand the analytical idea more easily).
I have been studying the Elliott Wave principle for almost three years now. With time, my understanding of this knowledge and experience has increased. What I have achieved so far is a legacy of a genius named Ralph Nelson Elliott, and I am truly satisfied with my progress. May his soul rest in peace and his memory be cherished.
Thank you for your support so far. I am grateful and will always remember your kindness. Please feel free to share your thoughts and feedback with me.
I hope my analysis will be useful to you in your business journey, and I wish you all the best.
Sincerely,

U.S. Dollar Index confirms inverted H&S bottomWe may be entering a strong period for the U.S. Dollar. Price charts favor the USD with the Eurocurrency, Canadian Dollars, British Pounds, Aussie $, SIngapore $ and others.

NFP SPECULATIONI'm overall bullish on dollar index. A small manipulation to the downside and then sudden pump up. Educational purposes only. trading consists of huge losses so trade with stop loss.

Weekly Rising Wedge On DXYThis looks to be bearish structure. Wanted to check against the community to ask for other opinions. Trend lines are valid.
Little more pump before the DXY drops off into the Low 80s?
Rsi indicated another pump to the top of the wedge, but I could see it falling through after that.
Comment!
Not financial Advice. I am a hobbyist.

DXY BULLISH FOR THE NEXT 2 MONTHS DXY looks bullish taking in consideration the commitment of traders and also the seasonal tendencies
For mor in deppth analysis i am expecting two major equal higs to be taken out and then we can discuss for dxy moving down. The cut rates at the end of the month January doenst at all influence my analysis since the cut rates are already priced in and at the last Fed Speech they said that there is no need to rush for the 2024 cut rates.

ECB Interest Rate Decision and Its Impact on the DXYThe dollar index was weak in the run-up to the European Central Bank's interest rate decision. A massive fair value gap is blocking any further upward movement. In view of the bearish chart situation ahead of the interest rate decision, we expect the DXY to lose further value and reach the 102.00 area.
