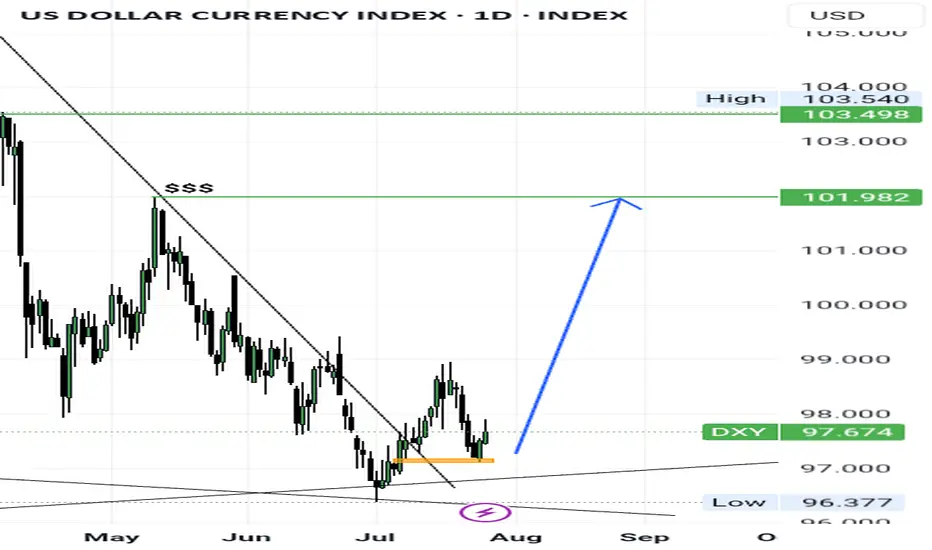
I HATETO BETTING. LET SEE WHY DXY Goes to there in my scenarioon August scenario
* Trumph's 10% import Tariff (Decision imminient)
* Powell speaking at Jackson Hole (August 22-24)
* Safe Haven printing Money
DXY trade ideas

Dollar indexDollar index in deep discount
Looking for higher prices this month
This my idea not a signal
#ICT
DOLLAR DXY dollar index on monthly support and we are watching the price action.lets watch the price action.
#dollar

DXY Outlook – From Bias to Execution Previous day closed bearish from a known supply leading to a sell bias, On the 45M, I am currently looking out for possible entry or exit.

US Dollar Index - 4h Chart (CAPITALCOM)4-hour chart of the US Dollar Index (DXY) from CAPITALCOM shows the index's recent price movements. The current value is 96.955, with a slight increase of 0.054 (+0.06%). Key levels include a support at 96.413 and resistance at 97.554. The chart highlights buy signals at 97.012 and sell signals at 96.958 and 96.955, with a notable downward trend breaking below a support zone around 97.150.

DXY DAILYI see the dollar index trend still bearish
Of course, this is on a daily time frame!
In this event, the value of stock indices (Dow Jones, etc.) will increase
It will also have a direct impact on major pairs
I hope you are successful in your trading😊

US dollar index (DXY) still looks weakAfter finding resistance near my 50-day EMA on the daily chart, TVC:DXY is now showing signs of continued weakness. Let's dig in.
MARKETSCOM:DOLLARINDEX
Let us know what you think in the comments below.
Thank you.
75.2% of retail investor accounts lose money when trading CFDs with this provider. You should consider whether you understand how CFDs work and whether you can afford to take the high risk of losing your money. Past performance is not necessarily indicative of future results. The value of investments may fall as well as rise and the investor may not get back the amount initially invested. This content is not intended for nor applicable to residents of the UK. Cryptocurrency CFDs and spread bets are restricted in the UK for all retail clients.

Dollar Index (DXY): Strong Bearish Price Action
Dollar Index broke and closed below a support line
of a bullish flag pattern on a daily.
Because the market is trading in a bearish trend,
this violation provides a strong bearish signal.
I expect a bearish movement to 96.75
❤️Please, support my work with like, thank you!❤️

Dollar. When King of cash said : I'm still the king. 23/July/25DXY. when Dollar = the king of cash said : "Cash is King!" AND as a King of cash I'm RECLAIMING MY CROWN.. What will happen to "all equities market? e.g Stocks, Gold or even Bitcoin?
US Dollar Breakdown – Don’t Fight the FloodSince the start of the year, after forming a small double top around the 110 zone, the US Dollar Index (DXY) has followed only one direction: down.
So far, we’re seeing a decline that’s approaching 15%, with the index breaking multiple major support levels along the way. And judging by the current structure, there’s little reason to believe this trend will reverse any time soon.
________________________________________
🔍 Short-Term View – Flag Break, More Losses Ahead
Zooming in, we can observe that the last rally was purely corrective — a typical bear flag formation. That flag is now broken to the downside, which confirms renewed bearish pressure and suggests that further losses are likely even in the short term.
________________________________________
🎯 What’s Next?
The next major support zone sits around 95, a level that should act as a magnet if the current trend continues.
As long as price stays under 100 ZONE, the outlook remains bearish and the strategy should align with that bias.
________________________________________
✅ Strategy Going Forward
The safe and logical approach now is to buy dips on major USD pairs:
EURUSD, GBPUSD, AUDUSD, and NZDUSD
________________________________________
📌 Final Thought
The structure is clear, momentum favors the downside, and the market is offering clean setups across multiple USD pairs.
Don’t fight the trend — follow the flow. 🟢

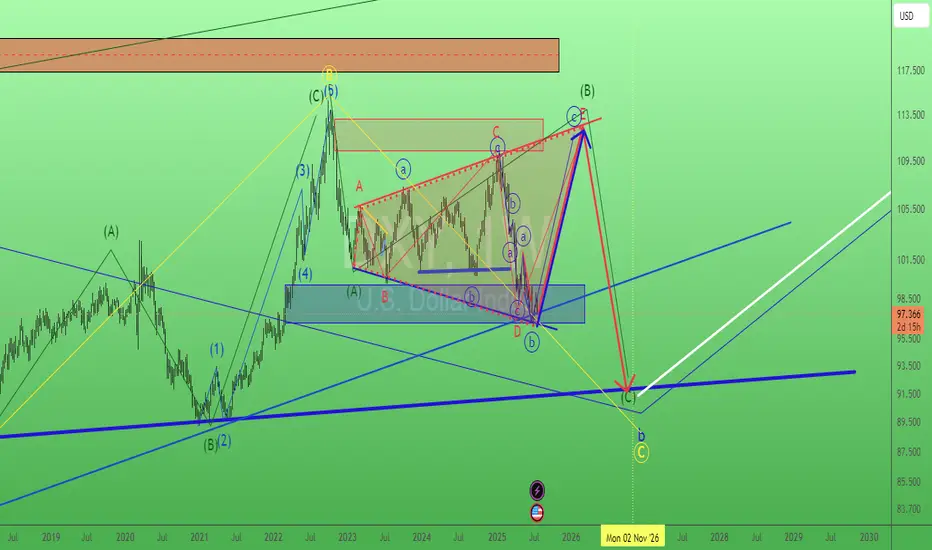
DXY – The Trap Is Set. The Drop Is Coming.Wave structure complete.
Retail thinks we’re going up. I know where it’s really going.
This is GreenFire Execution, not prediction.
🧠 Final liquidity hunt possibly toward 98.76 or even 101.40, then lights out.
Targeting the big liquidity pocket at 95.215
That’s where legends buy while the crowd panics.
📐 Elliott Wave | Wedge Mastery | Market Psychology
If you understand this chart — you don’t need signals. You need silence and execution.
#DXYSetup | #Wave5Ready | #SmartMoney | #ForexMillionaire | #TradingViewElite


Bullish bounce?US Dollar Index (DXY) is falling towards the pivot which aligns with the 78.6% Fibonacci retracement and could bounce to the 1st resistance.
Pivot: 97.00
1st Support: 96.48
1st Resistance: 97.77
Risk Warning:
Trading Forex and CFDs carries a high level of risk to your capital and you should only trade with money you can afford to lose. Trading Forex and CFDs may not be suitable for all investors, so please ensure that you fully understand the risks involved and seek independent advice if necessary.
Disclaimer:
The above opinions given constitute general market commentary, and do not constitute the opinion or advice of IC Markets or any form of personal or investment advice.
Any opinions, news, research, analyses, prices, other information, or links to third-party sites contained on this website are provided on an "as-is" basis, are intended only to be informative, is not an advice nor a recommendation, nor research, or a record of our trading prices, or an offer of, or solicitation for a transaction in any financial instrument and thus should not be treated as such. The information provided does not involve any specific investment objectives, financial situation and needs of any specific person who may receive it. Please be aware, that past performance is not a reliable indicator of future performance and/or results. Past Performance or Forward-looking scenarios based upon the reasonable beliefs of the third-party provider are not a guarantee of future performance. Actual results may differ materially from those anticipated in forward-looking or past performance statements. IC Markets makes no representation or warranty and assumes no liability as to the accuracy or completeness of the information provided, nor any loss arising from any investment based on a recommendation, forecast or any information supplied by any third-party.

DXY BULLISHWe sitting on a trendline third touch and also in confluence with a 61.8% level once we hold we should see a takeoff or highest we dump into $94 then we takeoff

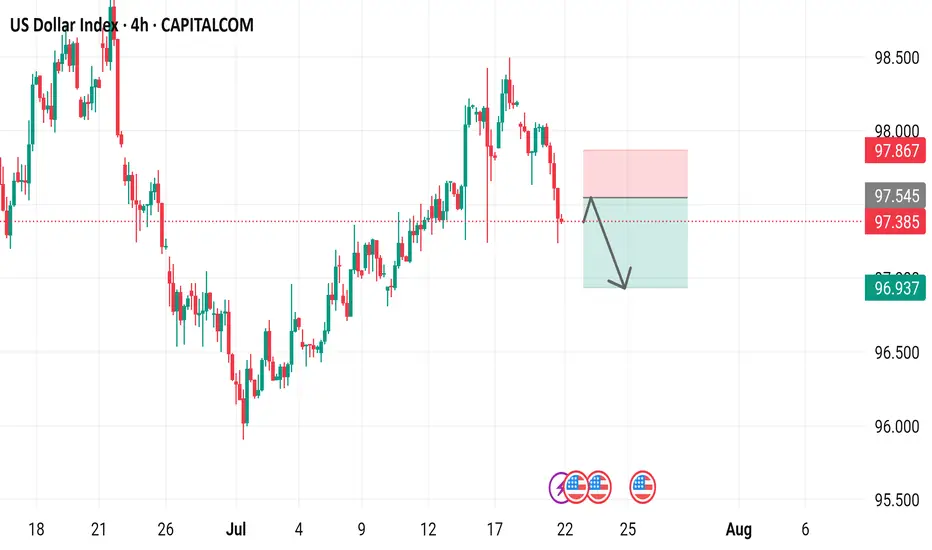
US Dollar Index 4-hour time frame, showcasing the US Dollar Index's performance over this period.
- The index is currently at 97.385, with a decrease of 0.636 (-0.65%) from its previous value.
- A red box indicates a "SELL" signal at 97.385, while a blue box suggests a "BUY" signal at 97.439.
- The chart includes various technical indicators, such as moving averages and relative strength index (RSI), to help traders analyze market trends.
DXY SHORT?
## 📉 **DXY Bearish Setup for 2025 – Fed Cuts, Fiscal Strain, Technical Breakdown**
### 🧠 Thesis
The U.S. Dollar Index (DXY) is poised to remain under pressure through the rest of 2025 due to macro, policy, and technical headwinds. With the Fed preparing for multiple rate cuts, rising fiscal imbalances, and a strong global diversification away from USD, the broader trend points **downward**.
---
### 🔍 Fundamentals Driving USD Weakness
* **Federal Reserve Pivot**: 2–3 rate cuts expected in 2025 → erodes USD yield advantage.
* **Surging U.S. Deficits**: Debt-to-GDP nearing 130%, undermining investor confidence.
* **De-dollarization Trend**: Central banks diversifying reserves (yuan, gold, euro).
* **Political Noise**: Tariff risk + weak-dollar narrative from Trump camp adds pressure.
---
### 📊 Technical Outlook (1D/1W Charts)
* DXY is trading below **9/20/50 EMA**.
* RSI \~43 with hidden bearish divergence.
* Clear **descending channel** since mid-2024.
* Key **support zone: 97.90 – 96.40**.
* Below 97.90 opens path toward 96.00–95.00.
---
### 🛠️ Trade Setup
| Type | Short (swing/position) |
| -------- | ---------------------- |
| Entry | Break below 98.00 |
| Target 1 | 96.40 |
| Target 2 | 95.00 |
| SL | Above 99.50 |
| R\:R | \~2.5:1 |
---
### ⚠️ Risks
* Surprise inflation → Fed pauses cuts
* Safe haven bid from geopolitical shocks
* Strong upside breakout >101.00 = trend invalidation
---
### 💬 Final Note
As long as DXY remains below 99.50, rallies are selling opportunities. Watch the 97.90–98.00 level — a confirmed breakdown could mark a fresh leg lower toward 95.00 by year-end.
---
### 🏷️ Tags
`#DXY` `#USD` `#DollarIndex` `#Forex` `#Macro` `#Bearish` `#TradingSetup` `#ShortUSD`
---

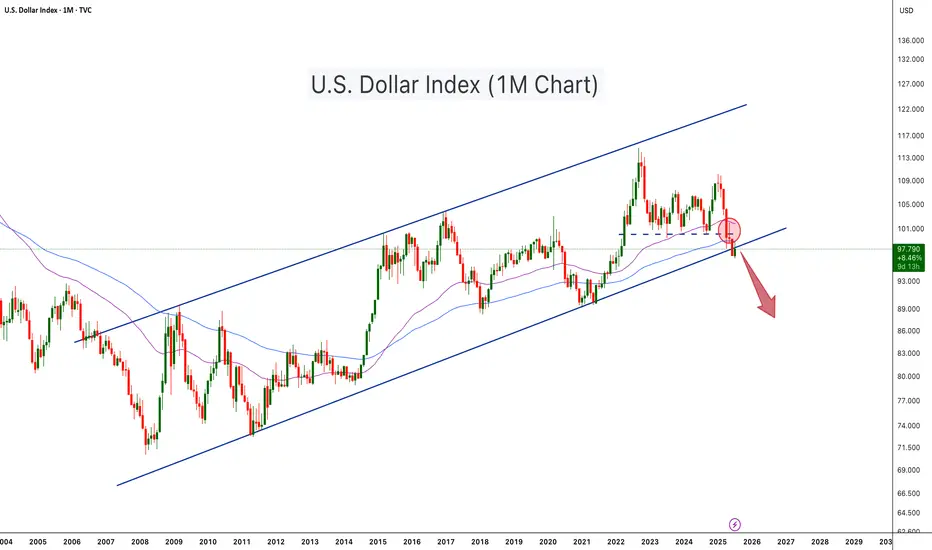
U.S. Dollar Index Loses Key Support – Crypto Bull Run Loading?The U.S. Dollar Index (DXY) has just broken below a long-term ascending channel, which has held since 2008. After losing the key horizontal support (~100 level), DXY retested and rejected from it (red circle), confirming a potential trend reversal. The move is technically significant and hints at further downside, possibly toward the 88–90 zone or lower.
This breakdown aligns with classic macro cycles, where a weaker dollar often fuels bullish momentum in risk assets, especially crypto. Historically:
-DXY downtrends in 2017 and 2020–2021 coincided with major Bitcoin and altcoin bull runs.
-DXY strength during 2018 and 2022 contributed to crypto bear markets.
With DXY now below both horizontal and diagonal support, Bitcoin and the broader crypto market may be entering the next expansion phase, especially if the dollar continues its downward trajectory
-DXY has broken below a 17 year rising channel – a macro bearish signal.
-Rejection from former support turned resistance confirms breakdown.
-A falling DXY historically corresponds with Bitcoin rallies and altseason expansions.
-Declining dollar strength could be the fuel that propels Bitcoin past $140K and Ethereum above $6K.
-A dollar bear trend may fuel total crypto market cap breakout beyond $4T+.
As DXY weakens, liquidity tends to rotate into risk-on assets like crypto. This setup mirrors pre-bull run environments seen in 2017 and 2020. A structural breakdown in the dollar could act as a catalyst for Bitcoin’s next major leg up.
Cheers
Hexa
DXYThe latest COT data shows net short positions increasing on the U.S. Dollar, indicating a bearish sentiment from institutional traders. A rising short bias suggests weakening confidence in the dollar’s strength across major currencies.

Dollar Index (DXY): Time to Recover
It looks like Dollar Index is going to recover after a yesterday's
rapid fall.
The market reached a key support and formed a cup & handle pattern on that.
We can expect a pullback at least to 98.09 level.
❤️Please, support my work with like, thank you!❤️

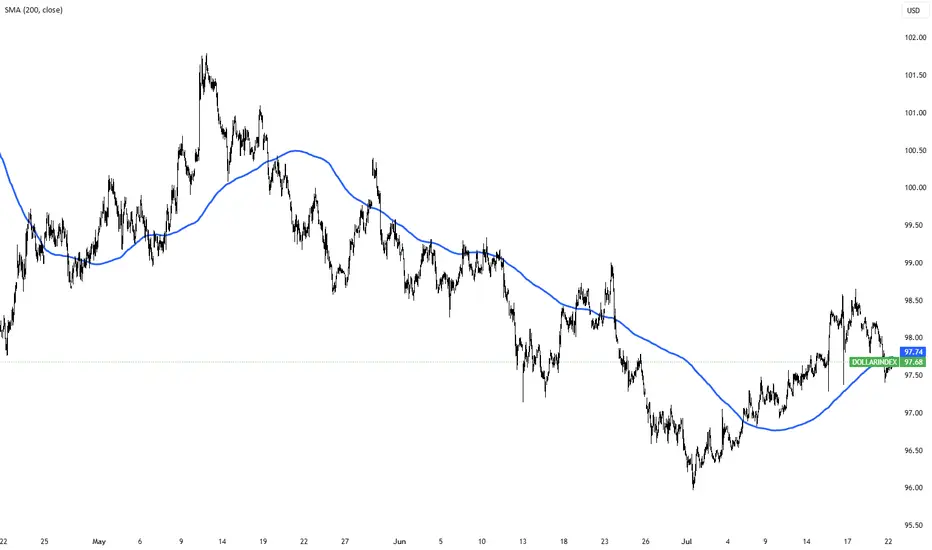
Dollar Index Holds Below 98 as Markets Await Trade Deal ProgressThe dollar index remained below 98 today, extending its two-day decline as investors watched trade negotiations ahead of the August 1 deadline. Treasury Secretary Scott Bessent said deal quality is the priority, suggesting Trump could grant extensions to countries showing real progress.
Markets are also focused on Fed Chair Powell’s speech for signals on interest rates. Despite Trump’s push for a cut, traders are not expecting action this month.
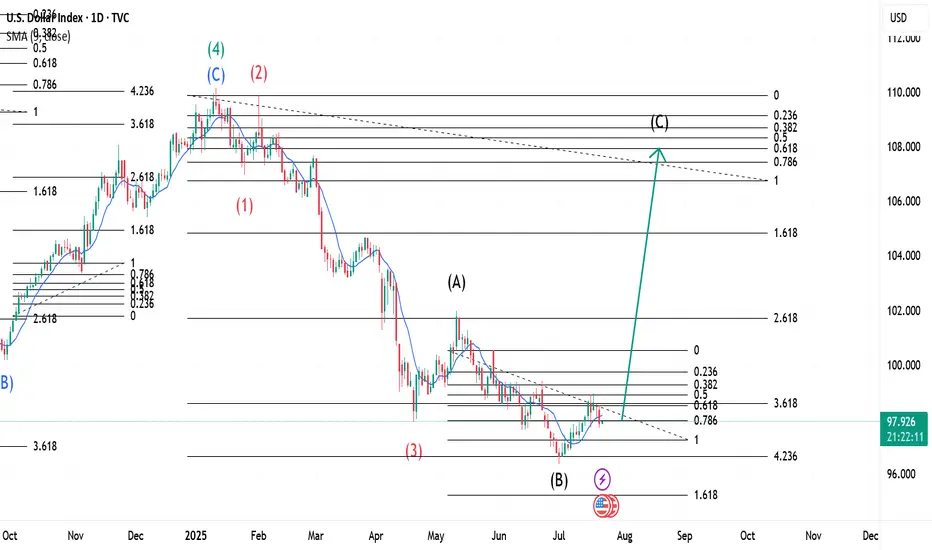
The $ Index ~ Elliott Wave Theory in real time.This is an update of a previously uploaded Dollar index Chart. Analysis remains the same and a confirmation at its current location would trigger continuation of the upward move as analysed on the first chart I had posted. Theoretically, the pullback on Monday, 21st July 2025 could be our Wave 2 with Wave 1 being on Thursday, 17th July 2025.
DXYTHE DOLLAR INDEX .
key data report ,22nd the fed chairman Powell speaks and on 24th we are expecting Unemployment Claims.
watch this data as they will shape the trade directional bias.
Key Factors Behind Today's Drop
1. Rising Global Risk Appetite and Strong Foreign Currencies
Investors are showing increased appetite for non-dollar assets today. The euro, yen, and pound have all strengthened—most notably, the dollar fell nearly 1% against the yen after political developments in Japan and a positive outlook in Europe.
European optimism was boosted by encouraging business survey results, while political clarity in Japan lifted the yen and added further selling pressure on the dollar.
2. Lower U.S. Treasury Yields
Softening U.S. yields contributed to the dollar’s weakness. Lower yields typically make the dollar less attractive relative to other currencies, further encouraging outflows.
Investors are reassessing Federal Reserve rate cut odds and show caution ahead of the July 31 Fed meeting.
3.Uncertainty Over Tariffs and U.S. Policy
Heightened anxiety around upcoming U.S. tariffs (with an August 1 deadline) and erratic policy signals are dampening confidence in the dollar as a safe haven.
Speculation over Fed independence, including market chatter about potential challenges to Chair Powell’s role, has hurt trust in U.S. monetary policy stability, fueling additional dollar selling.
Conclusion
The dollar index’s drop from its ascending trend line today is the result of a perfect storm of increased foreign currency strength, risk-seeking investor sentiment, declining U.S. yields, persistent policy and tariff uncertainty, All of these factors have combined to drive sellers selling momentum ,they will continue to push the index to its lowest levels and my structure is giving me 94-94.5 level.
trading is 100% probailty,trade with caution.

USD Snapback - Long-Term Trendline Back in-PlayThe trendline that originated in 2001 and connected to the 2020 high came in to hold the lows in July of 2023, and then again on Easter Monday. That level also held as support in June albeit temporarily, as bears grinded a sell-off into the Q2 close.
In early-Q3 trade, that trendline was resistance on a few different occasions, until buyers could eventually take it out. And then last week, on the heels of Trump's threat to fire Jerome Powell, price hurriedly pulled back until, eventually, support arrived via that same trendline projection, which is shown in black on the chart.
Now that trendline is back in-play as a test of today's lows. Given the persistent failure from USD bulls to fire anything more than a pullback, combined with the very clear push for USD-weakness from the current administration, it can be difficult to muster a bullish fundamental bias. But - this move had become very one-sided with that sell-off in the first-half of the year so the way that buyers respond to these support tests will be key for whether or not the currency can finally show a reversal theme for more than a couple of weeks. - js
