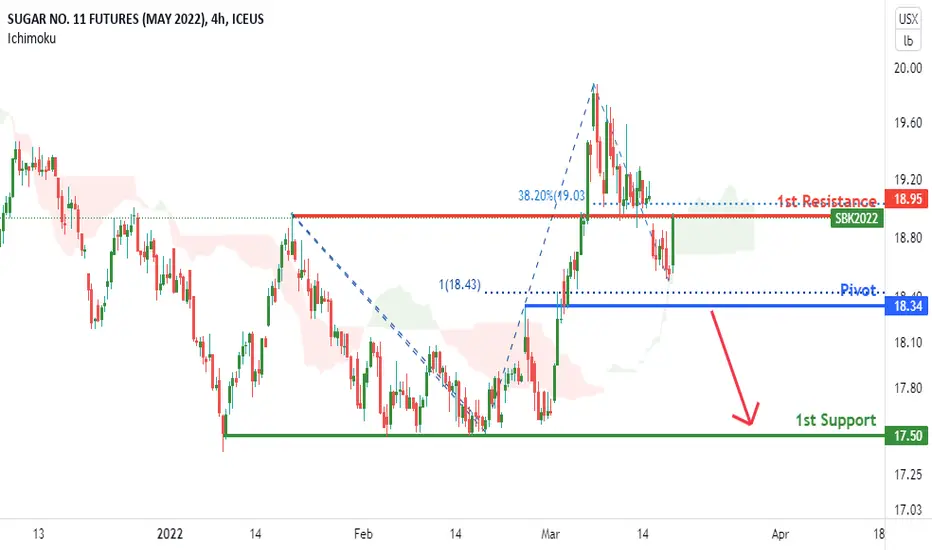
Sugar Futures (SBK2022), H4 Bearish ContinuationType : Bearish Continuation
Resistance : 18.95
Pivot: 18.34
Support : 17.50
Preferred case: Price is near the pivot level of 18.34 in line with a 100% Fibonacci projection. We expect price to move towards 1st support level of 17.50 in line with a graphical swing low support. Our bearish bias is supported by price trading under Ichimoku cloud indicator.
Alternative scenario: Price may break our pivot structure and head for 1st resistance level at 17.50 in line with 38.2%.
Fundamentals: No major news.
SB1! trade ideas
Sugar Futures (SBK2022), H4 Bearish Reversal!Title: Sugar Futures ( SBK2022 ), H4 Bearish Reversal!
Type : Bearish Reversal
Resistance : 19. 40
Pivot: 18.99
Support : 18.34
Preferred case: Prices are on bearish momentum. Prices might potentially move from pivot level of 18.99 in line with 100% Fibonacci projection and 50% Fibonacci retracement towards the 1st support level at 18.34 in line with 50% Fibonacci retracement and 78.6% Fibonacci projection . Our bearish bias is further supported by stochastic indicator as it is trading near resistance level .
Alternative scenario: Price can potentially goes up to the 1st resistance level of 19. 40 in line with 127.2% Fibonacci retracement and 127.2% Fibonacci extension .
Fundamentals: No major news

Sugar Futures (SBK2022), H4 Bearish Reversal!Title: Sugar Futures (SBK2022), H4 Bearish Reversal!
Type : Bearish Reversal
Resistance : 19.40
Pivot: 18.99
Support : 18.34
Preferred case: Prices are on bearish momentum. Prices might potentially move from pivot level of 18.99 in line with 100% Fibonacci projection and 50% Fibonacci retracement towards the 1st support level at 18.34 in line with 50% Fibonacci retracement and 78.6% Fibonacci projection. Our bearish bias is further supported by stochastic indicator as it is trading near resistance level.
Alternative scenario: Price can potentially goes up to the 1st resistance level of 19.40 in line with 127.2% Fibonacci retracement and 127.2% Fibonacci extension.
Fundamentals: No major news

SB (Sugar #11) - SHORTChart pattern LT trend reversal, top end of calculated daily range using price volume and volatility, and setup forming. SL for me TBD depending on action here the next day or two.

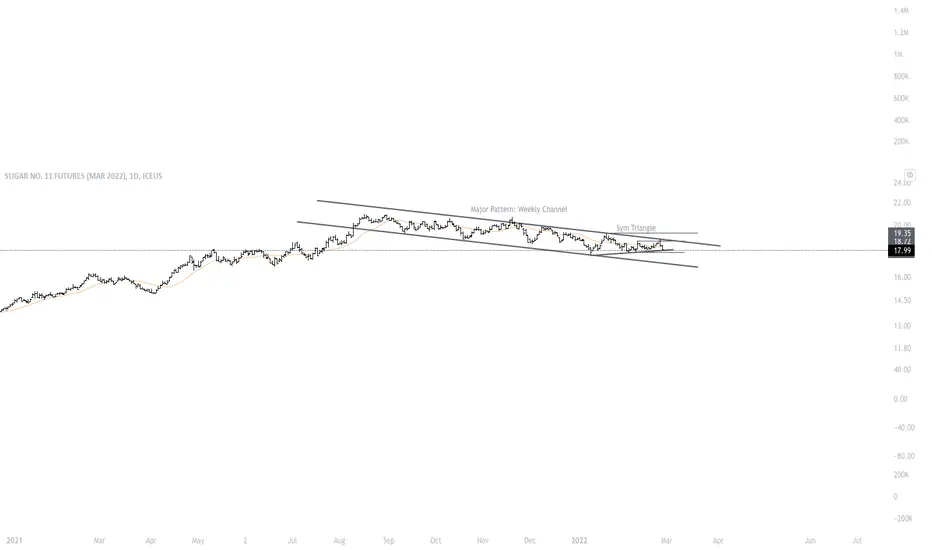
Sugar: Symmetrical TriangleMajor Pattern: Weekly Descending Channel
A symmetrical Triangle on Daily Chart could confirm an up or down continuation
Trigger Points: 18.68 or 18.14

False BreakoutFailure H&S confirms false breakout
entry long on 9 Feb, stop intraday on 4H bar at 18.26, target 19.50


SB1! (SUGAR) BULLISHSB1! (SUGAR) is bullish. We are going for the Intermediate 5th of Primary C of the cycle be. For now, the target area is roughly $23.43 to $$24.80 which is 50% and 61.8% of fibo. This is the commodity market and in a commodity market, the 5th wave can be extended. For now invalidation level is $17.60 which is the 4th wave for now.
DISCLOSURE - Please be informed that the information I provide is not a trading recommendation or investment advice. All of my work is for educational purposes only. All labeling and wave count have been done by me manually and I will keep changing according to the LIVE MARKET PRICE ACTION. So don't bias, hope on my trade plans. Try to learn Elliott Wave or other strategies and make your own strategy. Following is not that much easy. I am not responsible for any losses if u took the trade according to my trade plans.
#SB1! #SUGAR

Sugardirect entry with 0.33% on January 6th, which went to sleep on January 19th
now we await a possible bearish breakout confirmation figure
could it be a pennant?

SUGAR MARKET ANALYSEIts a small postion on the sugar market its clear vision of buyers volume entrance

Sugar : BullishSugar futures reacted off to a bullish rejection block on Weekly, creating a breaker+ on Daily. It'll be interesting to see how this plays out in next few weeks. Target is the liquidity up top of the range.

BEARISH ON THE US SUGARBearish clues:
- Triangle , breakdown with a strong bearish candlestick.
- Below the neutrality zone on the Relative Strength Index (RSI < 50).
- Breakdown of the 100 Exponential Moving Average , which was a good support.
- Breakdown of the Modified Pitchfork.
Fundamental news: (from Reuters)
- The supply minister of Egypt released on November 29, 2021 that " sugar reserves were sufficient for 3.5 months ".
- Looking further ahead, Rabobank expects raw sugar to average 20.80 cents in the third quarter of next year as the sugar market records a deficit of 2.3 million tonnes by the end of the 2021/22 season , following a deficit of 1.2 million tonnes in the 2020/21 season.
- Rabobank said ethanol prices will remain elevated on the back of strong global energy prices, tempting cane mills in top producer Brazil to produce more of the biofuel at the expense of sugar.
Objective:
My objective is the Fibonacci retracement level of 50%, at $17.69. Next objective is $16.98: support zone + Fibonacci retracement level of 38.2% + range of the Modified Pitchfork
ALWAYS WAIT FOR THE CLOSE OF THE CURRENT CANDLESTICK
Feel free to share, comment and give your opinion if it is constructive ;)
DISCLAIMER: This is not investment advice

Sugar Is silver was edible, it would be sugar! Check out the breakout for the 7 year rate of change.

Sugar (Sugar No. 11 - May 2022) set to continue the trendI firmly believe raw sugar futures are set to continue their upward trend seen for months now. While they have consolidated for a time and recently dipped below temporary support, which could be mistaken for a trend breakout, I believe we are simply seeing a sell-off as a reaction to the futures having floated highly above the trendline for a long time. As pointed out on the chart, the recent sell-off is of a magnitude similar to earlier sell-offs, and furthermore, we are resting firmly on the trendline. However, the risk of a trend breakout is significant and I recommend a tight SL at 18.45. On the other hand, should my hypothesis prove right, enjoy the ride and take profits at your own discretion.

Buy sugar higher 20.37$Good opportunity to buy sugar.On the picture I wrote why we should buy instrument above level 20.37$ .If you have some questions about this or another instruments you are always welcome to ask me.


sugar going up by!!hy my dears sugar is going up with an important volume of buyers and a spring box that means that they are no more sellers and the turn now for buyers
dont pay attention to the stop loss an take profit the position will be closed manually.

Sugar's OBV momentum breakout lineSugar has ALREADY BROKEN OUT ON WEEKLY CHART! Expecting a huge spike soon


Sugar Futures and related news.Lets take a look at Sugar Futures and related news. Read for educational content that can benefits us with profitable trades and in time reaction to any market trend direction changes.

