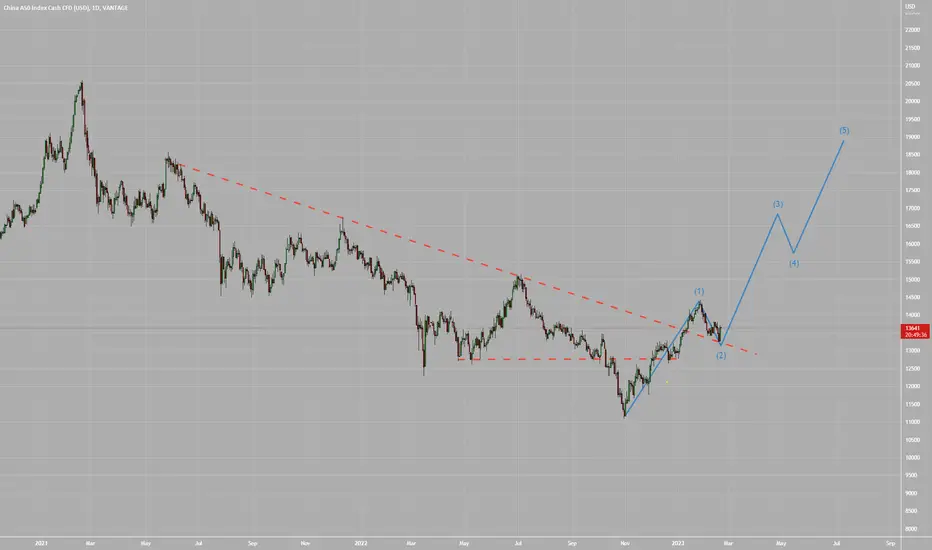
China Ready For Another Bull Run?If the pattern repeats then the next two years could provide consecutive 20-25% returns
CHINA50 trade ideas

'Can China’s Long-Term Growth Rate Exceed 2–3 Percent?' SummaryThis is a summary of Michael Pettis' 'Can China’s Long-Term Growth Rate Exceed 2–3 Percent?' carnegieendowment.org
As the text was quite long, this summarizes some critical points.
China's high investment share of GDP and growing debt burden are interrelated, stemming from an investment-driven growth model that began in the 1980s when the country needed significant investment in infrastructure, urban property development, and manufacturing facilities. High domestic investment required high domestic savings, leading to a rapid savings increase by constraining household consumption and income growth. Policymakers now recognize the need to rebalance China's economy towards domestic consumption.
High investment levels initially benefited the Chinese economy, as productive investment grew at the fastest pace in history. However, a successful development model should make itself obsolete, and China has closed the gap between its actual investment level and the level its businesses and workers can productively absorb. As productivity benefits of additional investment decline, more investment begins to generate less economic value than the value of employed resources. This can be observed in China's increasing debt numbers.
Countries that followed this growth model experienced a period of rapid, sustainable growth with stable debt levels, followed by a period of rapid, unsustainable growth driven by a surging debt burden. China entered this phase around fifteen years ago. Therefore, the investment share of China's GDP must decline sharply in the next few years, as the conditions that made high investment levels sustainable no longer exist. Historical precedents suggest that reducing the investment share of GDP to a sustainable level is better for the economy's long-term health, growth, and stability.
In this context, rebalancing the Chinese economy will require significant adjustments in its economic structure. Beijing must focus on boosting domestic consumption, though this would likely result in a decline in China's annual GDP growth to around 2-3 percent for many years. The current investment share of GDP is extraordinarily high, making it difficult to reduce it without significantly affecting overall economic activity.
Policymakers in Beijing have increasingly called for an expansion in the role of consumption, but there are significant political constraints in implementing such policies. Rebalancing would require consumption to grow faster than GDP and GDP to grow faster than investment. This implies transferring income from governments and businesses to households, a process that has not yet seen concrete proposals.
The decline in growth will be unevenly distributed, with local governments bearing the brunt of the adjustment while ordinary Chinese people experience less impact. This also means that sectors of the global economy that depend on Chinese investment growth will be more affected, while those reliant on Chinese consumption will be less impacted.
China's investment share of GDP currently stands at around 42-44 percent, which is unsustainable in the long run. For the purposes of this analysis, it is assumed that China should reduce its investment share to 30 percent over ten years, a level typical of rapidly developing economies. As investment declines, the consumption share of GDP must rise.
Michael presents five scenarios under which China can rebalance its economy:
A. Rebalance with a surge in consumption: China's consumption would need to grow by 6-7% annually, while investment grows by 0-1% annually, resulting in a GDP growth rate of 4% over ten years. However, this requires politically difficult income transfers from local governments and wealthy individuals to households.
B. Rebalance while maintaining current consumption growth rates: Consumption growth would remain at 3-4%, with investment contracting by 1-2% annually. This would lead to an average annual GDP growth rate of 1.5% over ten years.
C. Rebalance with a sharp decline in consumption growth: If consumption growth drops to 1-2% annually, the investment must decline by nearly 3% annually, leading to flat GDP growth.
D. Rebalance with a sharp contraction in GDP: This scenario involves a short-term, severe GDP contraction but is considered politically disruptive and unlikely.
E. Rebalance over a much extended period: If China takes 15-20 years to rebalance, with consumption growth at 3-4% annually, GDP growth will drop to 2% and 2.5%, respectively.
Key points include the limited ways China can rebalance, the difficulty in maintaining a high investment share indefinitely, and the necessity of a surge in consumption growth for a more balanced economy. Rebalancing will involve slower GDP growth without faster consumption growth, driven by significant and politically challenging income transfers.
In conclusion, China's rebalancing process will require significant adjustments in its economic structure. The country must reduce its reliance on investment and increase the role of consumption in driving growth. However, the political constraints and the impact on various sectors of the economy make this a challenging task for policymakers. The five scenarios presented illustrate the complexities of the rebalancing process and emphasize the need for a well-thought-out and carefully executed strategy.
China's future economic health depends on its ability to navigate these challenges and transition to a more sustainable growth model. Beijing must strike a delicate balance between addressing political constraints and implementing policies that promote consumption growth while minimizing the negative impacts on various sectors and local governments.
Moreover, the global economy is intricately connected to China's growth trajectory. As China undertakes the rebalancing process, the repercussions will be felt in sectors reliant on Chinese investment and consumption. Businesses and governments worldwide must closely monitor the situation and adapt to these changes.
This analysis highlights the importance of understanding the complexities of China's rebalancing process and its implications for the Chinese and global economies. As China grapples with these challenges, the world must brace itself for the changes arising from this monumental shift in the world's second-largest economy. Only time will tell if China's rebalancing efforts will successfully pave the way for a more stable and sustainable economic future.

Lower correction expected from CN50.CHN50 - 24h expiry - We look to Buy at 13045 (stop at 12975)
There is no sign that this bullish momentum is faltering but the pair has stalled close to a previous swing high of 13369.
Price action looks to be forming a top.
A lower correction is expected.
Short term bias is mildly bullish.
We therefore, prefer to fade into the dip with a tight stop in anticipation of a move back higher.
Our profit targets will be 13245 and 13660
Resistance: 13660 / 14440 / 15080
Support: 13180 / 12790 / 12400
Please be advised that the information presented on TradingView is provided to Vantage (‘Vantage Global Limited’, ‘we’) by a third-party provider (‘Signal Centre’). Please be reminded that you are solely responsible for the trading decisions on your account. There is a very high degree of risk involved in trading. Any information and/or content is intended entirely for research, educational and informational purposes only and does not constitute investment or consultation advice or investment strategy. The information is not tailored to the investment needs of any specific person and therefore does not involve a consideration of any of the investment objectives, financial situation or needs of any viewer that may receive it. Kindly also note that past performance is not a reliable indicator of future results. Actual results may differ materially from those anticipated in forward-looking or past performance statements. We assume no liability as to the accuracy or completeness of any of the information and/or content provided herein and the Company cannot be held responsible for any omission, mistake nor for any loss or damage including without limitation to any loss of profit which may arise from reliance on any information supplied by Signal Centre.

Looking for CN50 to stall at resistance.CHN50 - 24h expiry - We look to Sell at 13105 (stop at 13205)
Although the bears are in control, the stalling negative momentum indicates a turnaround is possible.
A higher correction is expected.
The bias is still for lower levels and we look for any gains to be limited.
We therefore, prefer to fade into the rally with a tight stop in anticipation of a move back lower.
Further downside is expected although we prefer to sell into rallies close to the 13115 level.
Our profit targets will be 12815 and 12715
Resistance: 13110 / 13570 / 14235
Support: 12640 / 12070 / 11140
Risk Disclaimer
The trade ideas beyond this page are for informational purposes only and do not constitute investment advice or a solicitation to trade. This information is provided by Signal Centre, a third-party unaffiliated with OANDA, and is intended for general circulation only. OANDA does not guarantee the accuracy of this information and assumes no responsibilities for the information provided by the third party. The information does not take into account the specific investment objectives, financial situation, or particular needs of any particular person. You should take into account your specific investment objectives, financial situation, and particular needs before making a commitment to trade, including seeking advice from an independent financial adviser regarding the suitability of the investment, under a separate engagement, as you deem fit.
You accept that you assume all risks in independently viewing the contents and selecting a chosen strategy.
Where the research is distributed in Singapore to a person who is not an Accredited Investor, Expert Investor or an Institutional Investor, Oanda Asia Pacific Pte Ltd (“OAP“) accepts legal responsibility for the contents of the report to such persons only to the extent required by law. Singapore customers should contact OAP at 6579 8289 for matters arising from, or in connection with, the information/research distributed.

CN50 to break lower?CHN50 - 24h expiry - We look to Sell a break of 12812 (stop at 12875)
Selling pressure from 13020 resulted in all the initial daily gains being overturned.
The current move lower is expected to continue.
Previous support located at 12812.
The medium term bias remains bearish.
Further downside is expected, however, due to the strong support below we prefer to sell a break of 12812, which will confirm the bearish sentiment.
Our profit targets will be 12630 and 12400
Resistance: 13180 / 13660 / 14440
Support: 12790 / 12400 / 11845
Please be advised that the information presented on TradingView is provided to Vantage (‘Vantage Global Limited’, ‘we’) by a third-party provider (‘Signal Centre’). Please be reminded that you are solely responsible for the trading decisions on your account. There is a very high degree of risk involved in trading. Any information and/or content is intended entirely for research, educational and informational purposes only and does not constitute investment or consultation advice or investment strategy. The information is not tailored to the investment needs of any specific person and therefore does not involve a consideration of any of the investment objectives, financial situation or needs of any viewer that may receive it. Kindly also note that past performance is not a reliable indicator of future results. Actual results may differ materially from those anticipated in forward-looking or past performance statements. We assume no liability as to the accuracy or completeness of any of the information and/or content provided herein and the Company cannot be held responsible for any omission, mistake nor for any loss or damage including without limitation to any loss of profit which may arise from reliance on any information supplied by Signal Centre.

Furthside downside is expected from CN50.CHN50 - 24h expiry - We look to Sell at 13180 (stop at 13260)
Buying pressure from 13031 resulted in prices rejecting the dip.
The current move higher is expected to continue.
The bias is still for lower levels and we look for any gains to be limited.
We therefore, prefer to fade into the rally with a tight stop in anticipation of a move back lower.
Further downside is expected although we prefer to sell into rallies close to the 13180 level.
Our profit targets will be 12950 and 12790
Resistance: 13180 / 13660 / 14440
Support: 12790 / 12400 / 11845
Please be advised that the information presented on TradingView is provided to Vantage (‘Vantage Global Limited’, ‘we’) by a third-party provider (‘Signal Centre’). Please be reminded that you are solely responsible for the trading decisions on your account. There is a very high degree of risk involved in trading. Any information and/or content is intended entirely for research, educational and informational purposes only and does not constitute investment or consultation advice or investment strategy. The information is not tailored to the investment needs of any specific person and therefore does not involve a consideration of any of the investment objectives, financial situation or needs of any viewer that may receive it. Kindly also note that past performance is not a reliable indicator of future results. Actual results may differ materially from those anticipated in forward-looking or past performance statements. We assume no liability as to the accuracy or completeness of any of the information and/or content provided herein and the Company cannot be held responsible for any omission, mistake nor for any loss or damage including without limitation to any loss of profit which may arise from reliance on any information supplied by Signal Centre.

CN50 to find support at previous resistance?CHN50 - 24h expiry - We look to Buy at 13350 (stop at 13245)
Although the bulls are in control, the stalling positive momentum indicates a turnaround is possible.
A lower correction is expected.
The 50% Fibonacci retracement is located at 13357 from 13116 to 13599.
Further upside is expected although we prefer to buy into dips close to the 13350 level.
Although the anticipated move higher is corrective, it does offer ample risk/reward today.
Our profit targets will be 13660 and 14440
Resistance: 13660 / 14440 / 15080
Support: 13180 / 12790 / 12400
Please be advised that the information presented on TradingView is provided to Vantage (‘Vantage Global Limited’, ‘we’) by a third-party provider (‘Signal Centre’). Please be reminded that you are solely responsible for the trading decisions on your account. There is a very high degree of risk involved in trading. Any information and/or content is intended entirely for research, educational and informational purposes only and does not constitute investment or consultation advice or investment strategy. The information is not tailored to the investment needs of any specific person and therefore does not involve a consideration of any of the investment objectives, financial situation or needs of any viewer that may receive it. Kindly also note that past performance is not a reliable indicator of future results. Actual results may differ materially from those anticipated in forward-looking or past performance statements. We assume no liability as to the accuracy or completeness of any of the information and/or content provided herein and the Company cannot be held responsible for any omission, mistake nor for any loss or damage including without limitation to any loss of profit which may arise from reliance on any information supplied by Signal Centre.

Buying CN50 at current swing low.CHN50 - 24h expiry - We look to Buy at 13261 (stop at 13101)
Although the bears are in control, the stalling negative momentum indicates a turnaround is possible.
This is positive for short term sentiment and we look to set longs at good risk/reward levels for a further correction higher.
Trading within a Bearish Channel formation.
Our expectation now is for this swing lower to continue towards the bottom of the trend channel, to complete a correction before buyers return.
Although the anticipated move higher is corrective, it does offer ample risk/reward today.
Our profit targets will be 13661 and 13741
Resistance: 13570 / 14235 / 15080
Support: 13110 / 12645 / 12070
Please be advised that the information presented on TradingView is provided to Vantage (‘Vantage Global Limited’, ‘we’) by a third-party provider (‘Signal Centre’). Please be reminded that you are solely responsible for the trading decisions on your account. There is a very high degree of risk involved in trading. Any information and/or content is intended entirely for research, educational and informational purposes only and does not constitute investment or consultation advice or investment strategy. The information is not tailored to the investment needs of any specific person and therefore does not involve a consideration of any of the investment objectives, financial situation or needs of any viewer that may receive it. Kindly also note that past performance is not a reliable indicator of future results. Actual results may differ materially from those anticipated in forward-looking or past performance statements. We assume no liability as to the accuracy or completeness of any of the information and/or content provided herein and the Company cannot be held responsible for any omission, mistake nor for any loss or damage including without limitation to any loss of profit which may arise from reliance on any information supplied by Signal Centre.

China holds lending benchmarks for 6th month, but more easingChina kept its benchmark lending rates unchanged for a sixth straight month in February, as expected, with the world’s second-largest economy showing more signs of recovery from a pandemic-induced slump.
Buying CN50 at trend of higher lows.CHN50 - 24h expiry - We look to Buy at 13540 (stop at 13470)
Although the bears are in control, the stalling negative momentum indicates a turnaround is possible.
The trend of higher lows is located at 13455.
This is positive for short term sentiment and we look to set longs at good risk/reward levels for a further correction higher.
The hourly chart technicals suggests further downside before the uptrend returns.
We look to buy dips.
Our profit targets will be 13740 and 14235
Resistance: 14235 / 15080 / 16150
Support: 13110 / 12645 / 12070
Please be advised that the information presented on TradingView is provided to Vantage (‘Vantage Global Limited’, ‘we’) by a third-party provider (‘Signal Centre’). Please be reminded that you are solely responsible for the trading decisions on your account. There is a very high degree of risk involved in trading. Any information and/or content is intended entirely for research, educational and informational purposes only and does not constitute investment or consultation advice or investment strategy. The information is not tailored to the investment needs of any specific person and therefore does not involve a consideration of any of the investment objectives, financial situation or needs of any viewer that may receive it. Kindly also note that past performance is not a reliable indicator of future results. Actual results may differ materially from those anticipated in forward-looking or past performance statements. We assume no liability as to the accuracy or completeness of any of the information and/or content provided herein and the Company cannot be held responsible for any omission, mistake nor for any loss or damage including without limitation to any loss of profit which may arise from reliance on any information supplied by Signal Centre.

CNH50 Trading The 7 Swing SequenceIn this update we review the recent price action in the China A50 and identify the next high probability trading opportunity and price objectives to target

Broke out, waited for the pull-back As China50 broke out from a long trend line I just opened a LONG


CHINA50 :) CHINA50 :) not that people pay attention to it lol
this guy not in synch with the nasdaq like other asian indices finally i found one
imma add it back to my portfolio
THOSE OUTWARD ARROWS ARE SYMBOLIC TO TPS
SENNA SEASON

Selling CHINA50 into trend of higher highs.CHN50 - 22h expiry - We look to Sell at 13310 (stop at 13445)
Buying pressure from 12917 resulted in prices rejecting the dip.
The current move higher is expected to continue.
Previous resistance located at 13304.
This is negative for short term sentiment and we look to set shorts at good risk/reward levels for a further correction lower.
Preferred trade is to sell into rallies.
Although the anticipated move lower is corrective, it does offer ample risk/reward today.
Our profit targets will be 12920 and 12660
Resistance: 13140 / 13615 / 14200
Support: 12660 / 12075 / 11120
Please be advised that the information presented on TradingView is provided to Vantage (‘Vantage Global Limited’, ‘we’) by a third-party provider (‘Signal Centre’). Please be reminded that you are solely responsible for the trading decisions on your account. There is a very high degree of risk involved in trading. Any information and/or content is intended entirely for research, educational and informational purposes only and does not constitute investment or consultation advice or investment strategy. The information is not tailored to the investment needs of any specific person and therefore does not involve a consideration of any of the investment objectives, financial situation or needs of any viewer that may receive it. Kindly also note that past performance is not a reliable indicator of future results. Actual results may differ materially from those anticipated in forward-looking or past performance statements. We assume no liability as to the accuracy or completeness of any of the information and/or content provided herein and the Company cannot be held responsible for any omission, mistake nor for any loss or damage including without limitation to any loss of profit which may arise from reliance on any information supplied by Signal Centre.

Buying CN50 at market.CHN50 - Intraday - We look to Buy at 13100 (stop at 13023)
Buying pressure from 13009 resulted in prices rejecting the dip.
This is positive for sentiment and the uptrend has potential to return.
Weekly pivot is at 13101.
Further upside is expected although we prefer to buy into dips close to the 13100 level.
Our profit targets will be 13320 and 13390
Resistance: 13615 / 14200 / 15155
Support: 12660 / 12075 / 11120
Risk Disclaimer
The trade ideas beyond this page are for informational purposes only and do not constitute investment advice or a solicitation to trade. This information is provided by Signal Centre, a third-party unaffiliated with OANDA, and is intended for general circulation only. OANDA does not guarantee the accuracy of this information and assumes no responsibilities for the information provided by the third party. The information does not take into account the specific investment objectives, financial situation, or particular needs of any particular person. You should take into account your specific investment objectives, financial situation, and particular needs before making a commitment to trade, including seeking advice from an independent financial adviser regarding the suitability of the investment, under a separate engagement, as you deem fit.
You accept that you assume all risks in independently viewing the contents and selecting a chosen strategy.
Where the research is distributed in Singapore to a person who is not an Accredited Investor, Expert Investor or an Institutional Investor, Oanda Asia Pacific Pte Ltd (“OAP“) accepts legal responsibility for the contents of the report to such persons only to the extent required by law. Singapore customers should contact OAP at 6579 8289 for matters arising from, or in connection with, the information/research distributed.

ChinaA50 - Bias for higher levels.CHN50 - Intraday - We look to Buy at 12540 (stop at 12380)
Selling pressure from 13067 resulted in all the initial daily gains being overturned. The current move lower is expected to continue. The bias is still for higher levels and we look for any dips to be limited. We, therefore, prefer to fade into the dip with a tight stop in anticipation of a move back higher.
Our profit targets will be 13005 and 13140
Resistance: 13140 / 13615 / 14200
Support: 12660 / 12075 / 11120
Please be advised that the information presented on TradingView is provided to Vantage (‘Vantage Global Limited’, ‘we’) by a third-party provider (‘Signal Centre’). Please be reminded that you are solely responsible for the trading decisions on your account. There is a very high degree of risk involved in trading. Any information and/or content is intended entirely for research, educational and informational purposes only and does not constitute investment or consultation advice or investment strategy. The information is not tailored to the investment needs of any specific person and therefore does not involve a consideration of any of the investment objectives, financial situation or needs of any viewer that may receive it. Kindly also note that past performance is not a reliable indicator of future results. Actual results may differ materially from those anticipated in forward-looking or past performance statements. We assume no liability as to the accuracy or completeness of any of the information and/or content provided herein and the Company cannot be held responsible for any omission, mistake nor for any loss or damage including without limitation to any loss of profit which may arise from reliance on any information supplied by Signal Centre.

ChoiynaStill in a downtrend
This is likely to be the bottom
Target is 16k in H1
GRI2022
NOT TARDING ADVICE

China A50 set for a corrective bounce?The China A50 has rallied over 13% since the October low and has since retraced to the 61.8% Fibonacci level. An elongated bullish Pinbar formed yesterday which shows strong demand around the bullish engulfing candle and marking a potential swing low within a bullish retracement channel. We are now looking for a break above 12,350 to assume bullish continuation and a move back towards the 13,000 resistance zone.
This could be the final move of a 3-wave correction, before it reverts to its bearish trend.

CN50 to fell further technically & fundamentallyA50 has breakout of its previous trendline support of which confluence with its nearest resistant zone and D1 trendline resistant.
Look for short term sell opportunity at around 12200 stop loss around 12350, take profit around 11800.

Selling CN50 into rallies.CHN50 - 21h expiry - We look to Sell at 12765 (stop at 13010)
Buying pressure from 12189 resulted in prices rejecting the dip.
The current move higher is expected to continue. Trading within a Bullish Channel formation.
Our expectation now is for this swing higher to continue towards the top of the trend channel, to complete a correction before sellers return.
We therefore, prefer to fade into the rally with a tight stop in anticipation of a move back lower.
Although the anticipated move lower is corrective, it does offer ample risk/reward today.
Our profit targets will be 12065 and 11120
Resistance: 12660 / 13140 / 13610
Support: 12075 / 11120 / 10490
Risk Disclaimer
The trade ideas beyond this page are for informational purposes only and do not constitute investment advice or a solicitation to trade. This information is provided by Signal Centre, a third-party unaffiliated with OANDA, and is intended for general circulation only. OANDA does not guarantee the accuracy of this information and assumes no responsibilities for the information provided by the third party. The information does not take into account the specific investment objectives, financial situation, or particular needs of any particular person. You should take into account your specific investment objectives, financial situation, and particular needs before making a commitment to trade, including seeking advice from an independent financial adviser regarding the suitability of the investment, under a separate engagement, as you deem fit.
You accept that you assume all risks in independently viewing the contents and selecting a chosen strategy.
Where the research is distributed in Singapore to a person who is not an Accredited Investor, Expert Investor or an Institutional Investor, Oanda Asia Pacific Pte Ltd (“OAP“) accepts legal responsibility for the contents of the report to such persons only to the extent required by law. Singapore customers should contact OAP at 6579 8289 for matters arising from, or in connection with, the information/research distributed.

China waiting for Zero Covid Policy to be remove30th Oct 2022
China still remind its Zero-Covid Policy.
Lockdown still remain.
Therefore price should drop below Covid low during 2020.
Next support 10k

Selling CN50 previous support.CHN50 - 21h expiry - We look to Sell at 12340 (stop at 12570)
Although the bears are in control, the stalling negative momentum indicates a turnaround is possible.
A higher correction is expected.
The bias is still for lower levels and we look for any gains to be limited.
We therefore, prefer to fade into the rally with a tight stop in anticipation of a move back lower.
Our profit targets will be 11685 and 11485
Resistance: 12270 / 12950 / 13370
Support: 11485 / 11000 / 10490
Risk Disclaimer
The trade ideas beyond this page are for informational purposes only and do not constitute investment advice or a solicitation to trade. This information is provided by Signal Centre, a third-party unaffiliated with OANDA, and is intended for general circulation only. OANDA does not guarantee the accuracy of this information and assumes no responsibilities for the information provided by the third party. The information does not take into account the specific investment objectives, financial situation, or particular needs of any particular person. You should take into account your specific investment objectives, financial situation, and particular needs before making a commitment to trade, including seeking advice from an independent financial adviser regarding the suitability of the investment, under a separate engagement, as you deem fit.
You accept that you assume all risks in independently viewing the contents and selecting a chosen strategy.
Where the research is distributed in Singapore to a person who is not an Accredited Investor, Expert Investor or an Institutional Investor, Oanda Asia Pacific Pte Ltd (“OAP“) accepts legal responsibility for the contents of the report to such persons only to the extent required by law. Singapore customers should contact OAP at 6579 8289 for matters arising from, or in connection with, the information/research distributed.
