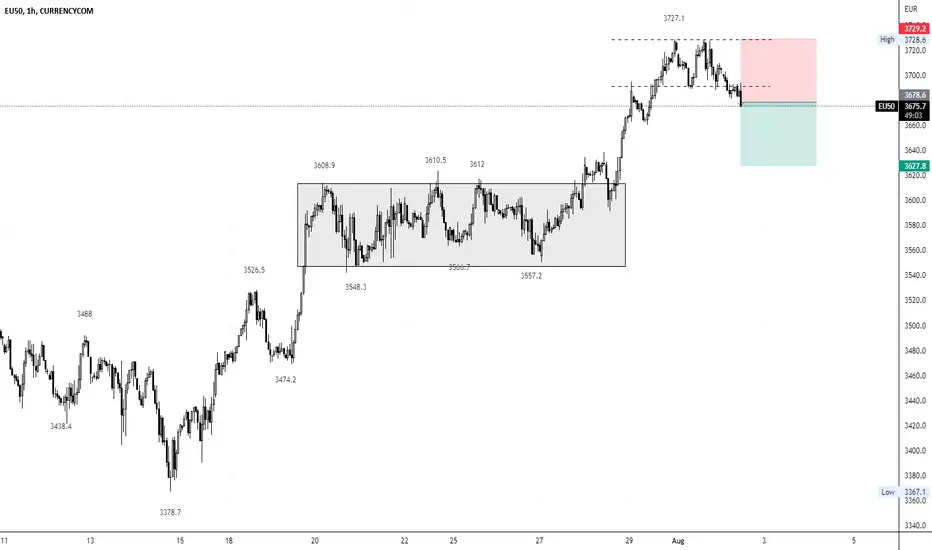
Possible Sell OffAs it has been weakening for months already, we should expect a proper sell entry on pullback.
STOXX50 trade ideas

Dead Cat Bounce on Euro Stoxx 50 Dead Cat Bounce
Ranging Downtrends
Stronger than breakout patterns
BEARISH

SX5E - Euro Stoxx 50 - Perspective, Perspective, PerspectiveI heard Ray Dalio shorted. I heard Putin has Europe by the b****. I heard there's a recession coming.
But do you know what? I don't care about any of these, nor do I care about any rumors, tips, subscription services or whatsoever in order to make my trading decisions.
The charts are my one and only telescope.
Further, I do not use this telescope to make any sort of forecast by any means. I have no clue what the market is about to do. I just know, pursuant to the charts, what would prompt me to identify a favorable scenario probabilistically speaking as well as a favorable risk to reward scenario.
And even then, the odds are I wouldn't trade it, because there might be other set ups out there which offer me more favorable conditions and full compliance with my trading system, which I have trained myself to execute flawlessly after a long and hard journey of staking mistakes and golden teeth.
Oh, and that's a breakout from an ascending triangle ... with a breakout back in 2019. Full analysis in my web.
Cheers

Jamie Gun2Head Idea - Selling EU50Trade Idea: Selling EU50
Reasoning: Looking for secondary aggressive selloff
Entry Level: 3602.0
Take Profit Level: 3476.0
Stop Loss: 3634.0
Risk/Reward: 3.94:1
Disclaimer – Signal Centre. Please be reminded – you alone are responsible for your trading – both gains and losses. There is a very high degree of risk involved in trading. The technical analysis , like all indicators, strategies, columns, articles and other features accessible on/though this site is for informational purposes only and should not be construed as investment advice by you. Your use of the technical analysis , as would also your use of all mentioned indicators, strategies, columns, articles and all other features, is entirely at your own risk and it is your sole responsibility to evaluate the accuracy, completeness and usefulness (including suitability) of the information. You should assess the risk of any trade with your financial adviser and make your own independent decision(s) regarding any tradable products which may be the subject matter of the technical analysis or any of the said indicators, strategies, columns, articles and all other features.

$EUR Stocks Buy Setup.This count is based on my assumptions so anything can happen not a trading or financial advice just for educational purposes only kindly do your own ta thanks trade with care good luck.

Joe Gun2Head Trade - Gap fill on EU50Trade Idea: Selling EU50
Reasoning: Head and shoulders top with a gap fill
Entry Level: 3765
Take Profit Level: 3700
Stop Loss: 3785
Risk/Reward: 3.58:1
Disclaimer – Signal Centre. Please be reminded – you alone are responsible for your trading – both gains and losses. There is a very high degree of risk involved in trading. The technical analysis , like all indicators, strategies, columns, articles and other features accessible on/though this site is for informational purposes only and should not be construed as investment advice by you. Your use of the technical analysis , as would also your use of all mentioned indicators, strategies, columns, articles and all other features, is entirely at your own risk and it is your sole responsibility to evaluate the accuracy, completeness and usefulness (including suitability) of the information. You should assess the risk of any trade with your financial adviser and make your own independent decision(s) regarding any tradable products which may be the subject matter of the technical analysis or any of the said indicators, strategies, columns, articles and all other features.

EU50 - Daily - Possible Short Opportunity
Hello Traders,
This graph shows the EU50 index on a daily timeframe.
The graph shows the convergence between actual downtrend channel and EMA100. It also shows a level of resistance on the RSI indicator.
Impact points on resistances and EMA100 are shown by red dots.
The EU50 might go a bit higher but shall reverse downtrend
Do not hesitate to comment
Regards,

Joe Gun2Head Trade - False breakout on EU50?Trade Idea: Selling EU50
Reasoning: False breakout on EU50? Bears to return ahead of ECB meeting?
Entry Level: 3955
Take Profit Level: 3533
Stop Loss: 3621
Risk/Reward: 2.31:1
Disclaimer – Signal Centre. Please be reminded – you alone are responsible for your trading – both gains and losses. There is a very high degree of risk involved in trading. The technical analysis , like all indicators, strategies, columns, articles and other features accessible on/though this site is for informational purposes only and should not be construed as investment advice by you. Your use of the technical analysis , as would also your use of all mentioned indicators, strategies, columns, articles and all other features, is entirely at your own risk and it is your sole responsibility to evaluate the accuracy, completeness and usefulness (including suitability) of the information. You should assess the risk of any trade with your financial adviser and make your own independent decision(s) regarding any tradable products which may be the subject matter of the technical analysis or any of the said indicators, strategies, columns, articles and all other features.

EuropeEuropean index should bounce like everything else
This was a jigsaw of local and distant forks
And we have some bull div also
GRI 2022

EUR Index ( Are we going to enter wave 4 Elliot ? )According to the checks I made in the previous trend, I found that the previous wave is a corrective (ABC); As a result, I was looking for signs of the beginning of a broad 5-wave pattern.
According to the type of behavior and movements of this index, the beginning of a 5-wave was confirmed.
Currently, this index is in the 3rd wave of its trend, hence the sharp decrease and lack of expectations of increase and correction seems normal.
From this point of view, it cannot be said definitively whether wave 3 has been completely completed or not; But in my opinion, it is very important not to lose the number 3400, because it can be called the end of wave 3.
If this number is lost, there will be no significant support until the number 2900 and there will only be small corrections in the direction of bigger falls.
Note: In order to ensure the end of wave 3, it is necessary that the blue trend line must be broken and this failure must be done with a powerful candlestick .
With the breaking of this line, the low time frame trend of this analysis will be completed, and the end of wave 5 can be considered at 2900; Otherwise, this analysis will no longer be applicable.
Be successful and profitable

Eurostoxx Ultimate Pivot PointsReading charts is just one part of trading a bear market, another highly significant part is a solid understanding of market psychology, heuristics and biases. Having spent 14 years in a QE fuelled bull market where there were few inexplicable events and certainly no major forced liquidation events, it is easy to understand why so many participants get so excited about two days of asset flows out of commodities and into tech names. Yes, the market can go higher from here, yes it can go lower, but calling a major bottom and repeatedly getting attached to these short squeezes is all part of the psychological conditioning that has been happening to many over the last 14 years. Therefore we would suggest waiting for extremes where there is nobody else left to buy or sell, this is where the odds are stacked firmly in one's favour. Patience. Discipline. And more patience.

STOXX50 : SUPPLY AND DEMAND ZONE | LONG SETUP ⚡️Welcome back Traders,
Detailed analysis from INDEX_INSIDERS Team.
Please support our Idea by hitting the LIKE 👍 button
Traders, if you like this idea or have your own opinion about it, please write your own in the comment box . We will be glad for this.
Feel free to request any pair/instrument analysis or ask any questions in the comment section below.
Have a Good Day Trading !

🎢Euro Stoxx 50: Eurozone economy will continue to grow●● Preferred count
● SX5E ( TVC ) , 🕐TF: 1W
Fig.1
The Euro Stoxx 50 Index is the main index in the Eurozone. The components of the index are companies that are leaders in their industries - 50 companies from 12 eurozone countries: Austria, Belgium, Germany, Greece, Ireland, Spain, Italy, Luxembourg, the Netherlands, Portugal, Finland and France.
The main scenario is the continuation of long-term growth within the framework of the cycle wave V .
_______________________________________
● EU50EUR (OANDA) , 🕐TF: 1D
Fig.2
The ascending impulse (1) and the beginning of the subsequent correction (2) of ③ were successfully predicted. At the moment, the threewave corrective phase can be interpreted as a completed A-B-C single zigzag . Growth is expected to resume as part of the third wave.
_______________________________________
● EU50EUR (OANDA) , 🕐TF: 8h
Fig.3
As a local alternative scenario, black marking is proposed, in the context of which wave (2) will become more complicated to a double zigzag W-X-Y . This counting option will become more relevant if the sideways correction stretches in time and takes the shape of a triangle X .
_______________________________________
_______________________________________
●● Alternative count
● FESX1!(EUREX) , 🕐TF: 1W
Fig.4
The probability of realization of the given scenario will multiply increase in case of display by a wave B of (Y) of the form of a triangle.
🎯 Interesting points for making trading decisions:
— Breakdown of the orthodox bottom of the wave B of (Y) of Ⓑ ;
— Completion of the zigzag (E) of Ⓑ within black marking;
— Completion of the zigzag Ⓔ of IV within the color marking.
_______________________________________
Disclaimer:
— The owner of the TradeWaves-EWA © community is not responsible and has no direct or indirect obligations to the User/Customer in connection with any possible losses or financial damages related to any content of this community.

Eurostoxx UpdateJust a quick note on the Eurostoxx specifically to highlight:
1. We are now most definitely trading below the 2 year uptrend that was causing the ongoing corner formations, good to get that out of the way
2. The index has found support temporarily off the March lows and various highs from 2020
3. If this breaks, which we expect it will sooner or later, the target is the lower end of the red trend channel at 3000 as we mentioned yesterday. Should things develop into something more akin to 08/09 then we’re looking at the blue line down at 2400.
In the meantime, we just wanted to bring more clarity to the picture today by indicating the ideal entry point for further shorts (highlighted in the orange circle), that crash protection is a must if net long in our opinion, crash protection is probably a good idea in 6 months puts, and that if we trade higher towards the back of the uptrend we could be looking at a repeat of something like the 3830 to 3500 move that we saw in the first two weeks of June.
If we get there, we do not think we stay there for too long so we are starting to compile a list of single stocks in both Europe and US that look like they would be attractive if the market were down a further 10%. Those that are on our value list and print any form of accumulation indicator on the platform will be our best foot forward for clients. Stay tuned.

Euro Markets with pivotsDue to upcoming Rate Hikes and Macro Uncertainty Eurozone is looking at a steep downside

EU50 bullishEurostoxx 50 Bullish, hidden divergence on stochastic, meaning trend keep going, target 0.71 at fibonacci ratracement. profit 110 euros a contract

Euro Stoxx 50 Entry Point For Equality ObjectiveIn this update we review the recent price action in the Euro Stoxx 50 nd identify the next high probability trading strategy and price objectives to target
0

Jamie Trade Idea - Short EU50
Trade Idea: Selling EU50
Reasoning: Looking for selloff to be extended here, breaking through support.
Entry Level: 3652
Take Profit Level: 3439
Stop Loss: 3689
Risk/Reward: 5.76R
Disclaimer – Signal Centre. Please be reminded – you alone are responsible for your trading – both gains and losses. There is a very high degree of risk involved in trading. The technical analysis , like all indicators, strategies, columns, articles and other features accessible on/though this site is for informational purposes only and should not be construed as investment advice by you. Your use of the technical analysis , as would also your use of all mentioned indicators, strategies, columns, articles and all other features, is entirely at your own risk and it is your sole responsibility to evaluate the accuracy, completeness and usefulness (including suitability) of the information. You should assess the risk of any trade with your financial adviser and make your own independent decision(s) regarding any tradable products which may be the subject matter of the technical analysis or any of the said indicators, strategies, columns, articles and all other features.

Eurostoxx 2022 Outlook - SX5EAs our first post it is essential to publish our longer term trend channel work as it provides the larger backdrop to our more detailed and shorter term work that we will be publishing in due course.
Starting with the Eurostoxx 50 Index (SX5E) we saw a 19% rally in as many trading days off the March lows only to run into resistance and the 3 month downtrend simultaneously around the 4020 level. That led to some decent chop back down and sideways with 3825 acting like a magnet for over a week. A brief pop higher from there back up to the 3925 downtrend we suggested was a great place to book long profits and errr on the side of caution and since then we are down ~4%.
So what next? We have a point of interest for bids coming in around current levels at 3750 which could take us into yet another corner between here and 3925 where we would switch back to a heavily hedged stance. Failure to do so will likely result in a revisit of the Covid uptrend which currently sits around 3500.

From 10k to 100k, Mar 20,22 EUR 50 SellWith the Ukraines Presidents words on the weekend talking about WW3, I believe the European markets will drop this week so I put a Sell Order in at 3893 with my SL at 4050.
I'll keep an eye on it but I think there will be a lot of volatility this week on all markets.
Stay safe.
Heiko

Euro Stoxx 50 Futures Europe Sun Storm Investment Trading Desk & NexGen Wealth Management Service Present's: SSITD & NexGen Portfolio of the Week Series
Focus: Worldwide
By Sun Storm Investment Research & NexGen Wealth Management Service
A Profit & Solutions Strategy & Research
Trading | Investment | Stocks | ETF | Mutual Funds | Crypto | Bonds | Options | Dividend | Futures |
USA | Canada | UK | Germany | France | Italy | Rest of Europe | Mexico | India
Disclaimer: Sun Storm Investment and NexGen are not registered financial advisors, so please do your own research before trading & investing anything. This is information is for only research purposes not for actual trading & investing decision.
#debadipb #profitsolutions

EUR STOXX 50 Analysis BeWare!EUR STOXX 50 Analysis
We May Expect a Pull Back and it could reach its previous High and big the BIG FALL.
