FTSE INTRADAY bullish uptrend consolidation supported at 8600Trend: Overall trend remains bullish, supported by rising price action.
Recent Movement: Price is in a sideways consolidation phase after a strong uptrend.
Key Levels
Support:
8600 – Key level from prior consolidation.
8480, then 8430 – Next supports if 8600 breaks.
Resistance:
8850 – First upside target.
8910, then 9020 – Further resistance levels on continued strength.
Trading Scenarios
Bullish Scenario:
A pullback to 8600 followed by a bounce could lead to a move towards 8850, then higher to 8910 and 9020.
Bearish Scenario:
A confirmed break and daily close below 8600 would weaken the bullish case. In that case, expect a potential drop to 8480, then 8430.
Conclusion
The FTSE remains bullish, but a short-term pullback is possible. A bounce from 8600 would confirm trend strength. Watch 8600 closely — holding above favors bulls; a break below shifts sentiment to bearish.
This communication is for informational purposes only and should not be viewed as any form of recommendation as to a particular course of action or as investment advice. It is not intended as an offer or solicitation for the purchase or sale of any financial instrument or as an official confirmation of any transaction. Opinions, estimates and assumptions expressed herein are made as of the date of this communication and are subject to change without notice. This communication has been prepared based upon information, including market prices, data and other information, believed to be reliable; however, Trade Nation does not warrant its completeness or accuracy. All market prices and market data contained in or attached to this communication are indicative and subject to change without notice.
UK100 trade ideas

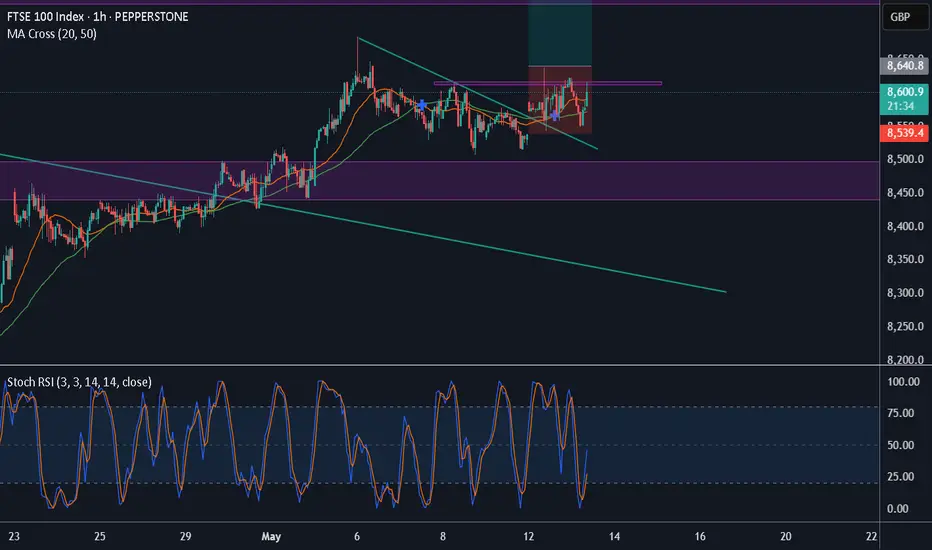
So far so good, UKXLet's wait for it to break above the resistance line and then go long/accumulate.
Be patient and DYODD

"UK100 Grand Heist: Bullish Loot Plan with Thief Trading Style!🌍 Hello, Global Wealth Warriors! Ciao, Salut, Guten Tag, Ola! 🌟
Fellow Profit Pirates & Market Mavericks, 💸⚡
Unveiling our cunning blueprint to plunder the "UK100/FTSE100" Index Market, crafted with 🔥Thief Trading’s razor-sharp technical and fundamental insights🔥. Stick to the chart’s game plan, zoned in on a long entry. Our mission? Slip out near the high-stakes ATR Zone Level—a perilous spot with overbought vibes, consolidation, trend flips, and traps where bearish bandits lurk. 🏴☠️💰 Celebrate your wins, traders—you’ve earned it! 🎉
📈 **Entry Point**: The vault’s unlocked! Grab the bullish bounty at current prices—the heist is live!
💡 Pro Tip: Set buy limit orders on a 15 or 30-minute timeframe, targeting recent or swing lows/highs. Don’t forget to set chart alerts for precision! 🚨
🛑 **Stop Loss**:
📍 Thief SL parked at the recent/swing low on the 4H timeframe (8500.0) for day/swing trades.
📍 Tailor your SL to your risk appetite, lot size, and number of orders. Stay sharp!
🎯 **Target**: Aim for 8850.0 or make a swift exit just before.
👀 **Scalpers, Listen Up**: Stick to long-side scalping. Got deep pockets? Dive in now! Otherwise, join swing traders for the grand heist. Use trailing SL to shield your loot. 💰
💹 **Market Pulse**: The UK100/FTSE100 is in a neutral zone but leaning bullish, fueled by key drivers. ☝
🌐 Dive into fundamentals—macro economics, COT reports, geopolitical updates, sentiment, intermarket analysis, and index-specific trends. Check the linkss for the full scoop! 🔗🌍
⚠️ **Trading Alert**: News can shake the market! 📰
🔐 Protect your positions:
- Pause new trades during news releases.
- Use trailing stop-loss to lock in gains.
💪 **Join the Heist**: Smash the Boost Button to supercharge our robbery squad! 💥 With Thief Trading Style, we rake in profits daily with ease. 🚀 Your support fuels our market conquests. 🤝❤️
Stay tuned for the next daring heist, money makers! 🤑🐱👤🎯

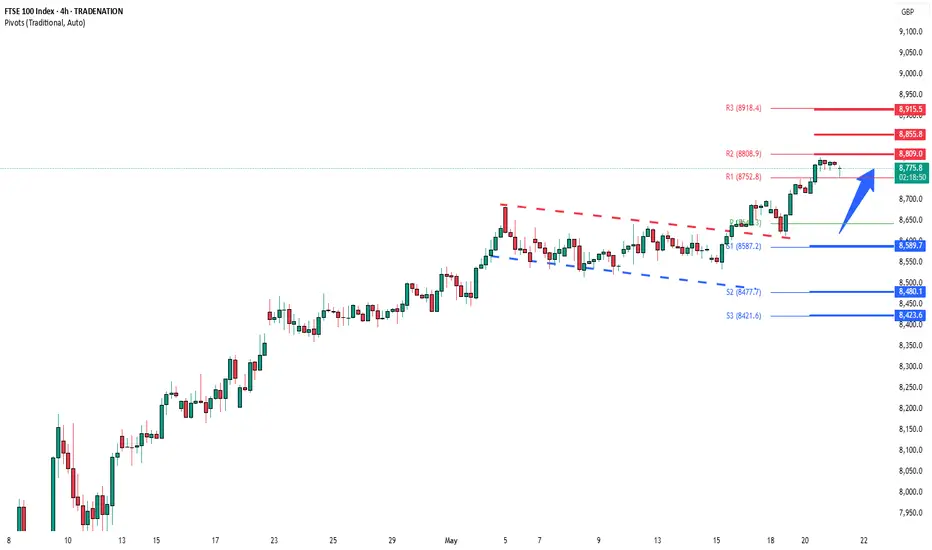
FTSE INTRADAY bullish continuaation breakoutThe FTSE 100 is showing bullish momentum, supported by an ongoing uptrend. Recent price action suggests a breakout above a period of sideways consolidation, indicating strong buying interest.
Key Support: 8590 – This was the previous consolidation zone and now acts as a critical level.
If the index pulls back to 8590 and holds, it may resume the uptrend with potential upside targets at:
8810 (near-term resistance)
8850, then 8920 (longer-term targets)
Bearish Scenario: A daily close below 8590 would weaken the bullish case and could lead to a decline toward:
8480 (next support)
Then 8420 if selling pressure increases
Conclusion:
The FTSE 100 remains bullish above 8590. Watch for a bounce from this level to confirm further upside. A break below would shift the outlook to bearish in the short term.
This communication is for informational purposes only and should not be viewed as any form of recommendation as to a particular course of action or as investment advice. It is not intended as an offer or solicitation for the purchase or sale of any financial instrument or as an official confirmation of any transaction. Opinions, estimates and assumptions expressed herein are made as of the date of this communication and are subject to change without notice. This communication has been prepared based upon information, including market prices, data and other information, believed to be reliable; however, Trade Nation does not warrant its completeness or accuracy. All market prices and market data contained in or attached to this communication are indicative and subject to change without notice.

FTSE INTRADAY bullish breakout continuation above 8590The FTSE 100 is showing bullish momentum, supported by an ongoing uptrend. Recent price action suggests a breakout above a period of sideways consolidation, indicating strong buying interest.
Key Support: 8590 – This was the previous consolidation zone and now acts as a critical level.
If the index pulls back to 8590 and holds, it may resume the uptrend with potential upside targets at:
8810 (near-term resistance)
8850, then 8920 (longer-term targets)
Bearish Scenario: A daily close below 8590 would weaken the bullish case and could lead to a decline toward:
8480 (next support)
Then 8420 if selling pressure increases
Conclusion:
The FTSE 100 remains bullish above 8590. Watch for a bounce from this level to confirm further upside. A break below would shift the outlook to bearish in the short term.
This communication is for informational purposes only and should not be viewed as any form of recommendation as to a particular course of action or as investment advice. It is not intended as an offer or solicitation for the purchase or sale of any financial instrument or as an official confirmation of any transaction. Opinions, estimates and assumptions expressed herein are made as of the date of this communication and are subject to change without notice. This communication has been prepared based upon information, including market prices, data and other information, believed to be reliable; however, Trade Nation does not warrant its completeness or accuracy. All market prices and market data contained in or attached to this communication are indicative and subject to change without notice.
UK100 Short IdeaHTF liquidity swept + Tokyo High swept along with monday high. Looking for a retrace in the 1h liq area . The target is conservative, this can go even lower towards monday low or prev week low .

London Stock Market Rally: From 7500 to 8700 The London Stock Index rally has commenced at the 7500 mark, with expectations that the upward movement will reach a peak around the 8700-pound level.
Following this anticipated high point, a price correction is likely to begin, moving towards the possible first and second target levels.
keeping an eye on potential opportunities during the correction phase.

Trendline Break Continuation The price has been on a bullish trend and broke a larger trendline, now we see a smaller trendline as a continuation, followed by a pullback and now the price looks to make a bullish impulse at a higher high
WE ONLY TRADE PULLBACKS
UK100 - STRATEGY TO MAKE MILLIONSTeam, you have been killing the UK100 last week,
YESTERDAY, we will the AUS200
every day is a winning for us. I am about to make a video of education on how to kill the market daily!
Today we are preparing to short UK at 8742-8756
DOUBLE UP the short at 8785-96
Target range 1 at 8705-15
Target range 2 at 8672-8658
Remember: be humble, be focused and always care about risk management. Now, let's kill the UK100 market together.

FTSE 100: Bearish Order flowBearish Crab Pattern via the 1H timeframe. Let's see how this plays out.
There's also an order block at the bottom on the H4 timeframe. Maybe price could go bearish to mitigate it. As they say, false move beginning of the week.

Potential Buy Zone on FTSEI have several swing trade zones marked up on the FTSE, here's one of them.
Potential Buy Zone for the FTSEI have several swing trade zones marked up on the FTSE, here's one of them.

FTSE 100 Wave Analysis – 16 May 2025
- FTSE 100 broke the resistance level 8650.00
- Likely to rise to resistance level 8800.00
The FTSE 100 index recently broke the resistance level 8650.00, which stopped the previous medium-term impulse wave (1) at the start of this month.
The breakout of the resistance level 8650.00 should accelerate the active medium-term impulse wave (3) from the start of May.
Given the improved sentiment across the global equity markets, the FTSE 100 index can be expected to rise to the next resistance level 8800.00, which has been reversing the price from the start of February.

Can FTSE100 keep the momentum all the way to the all-time high?The FTSE:UKX bulls continue to show resilience and push the index higher. But the big question is, can we see a move all the way to the current all-time high?
Let's dig in...
MARKETSCOM:UK100
Let us know what you think in the comments below.
Thank you.
77.3% of retail investor accounts lose money when trading CFDs with this provider. You should consider whether you understand how CFDs work and whether you can afford to take the high risk of losing your money. Past performance is not necessarily indicative of future results. The value of investments may fall as well as rise and the investor may not get back the amount initially invested. This content is not intended for nor applicable to residents of the UK. Cryptocurrency CFDs and spread bets are restricted in the UK for all retail clients.

UK100 - FTSE100 - TIME TO MAKE MILLION ON SHORTHi Everyone,
I hope yesterday you enjoy 450-500 points on DOW/US30 when we have two long and two target hit
last 2-3 days we avoid the US30 because we wait for the good set up.
Same as UK we short last two day but we didn’t short yesterday.
Now you are going to kill the UK100 together
Please watch the CHART carefully as we want to EXTRA Short price at 8668-8682 ranges
DO not be afraid. I am PRO trader if you go to my profile and check out and click the video.
I show you how to make $5000 simple every week.
Also follow the 1st target at 6622-15. TAKE partial 30%-50% and BRING stop loss to BE
NOTE: once you took and it move back hit stop loss - SHORT AGAIN,
Second target at 8596-8582
Hope you enjoy the TRADE yesterday on US30, you can check trading view chart post yesterday!

UK100 | Sideways | ShortUK100 is moving sideways and printing peaks between the support and resistance areas.

FTSE100 INTRADAY sideways consolidation supported at 8454The FTSE 100 is showing bullish momentum, supported by an ongoing uptrend. Recent price action suggests a breakout above a period of sideways consolidation, indicating strong buying interest.
Key Support: 8454 – This was the previous consolidation zone and now acts as a critical level.
If the index pulls back to 8454 and holds, it may resume the uptrend with potential upside targets at:
8650 (near-term resistance)
8730, then 8825 (longer-term targets)
Bearish Scenario: A daily close below 8454 would weaken the bullish case and could lead to a decline toward:
8373 (next support)
Then 8272 and possibly 8100 if selling pressure increases
Conclusion:
The FTSE 100 remains bullish above 8454. Watch for a bounce from this level to confirm further upside. A break below would shift the outlook to bearish in the short term.
This communication is for informational purposes only and should not be viewed as any form of recommendation as to a particular course of action or as investment advice. It is not intended as an offer or solicitation for the purchase or sale of any financial instrument or as an official confirmation of any transaction. Opinions, estimates and assumptions expressed herein are made as of the date of this communication and are subject to change without notice. This communication has been prepared based upon information, including market prices, data and other information, believed to be reliable; however, Trade Nation does not warrant its completeness or accuracy. All market prices and market data contained in or attached to this communication are indicative and subject to change without notice.

UK100 - time to SHORT and send UK into recession.SHORT UK100 at 8610, add more at 8622, (8638-42) and 8667-71)
Target 1 at 8592-8285
Target 2 at 8571-8564
Target 3 at 8549-8339
Once it hit first target, take 30% partial and bring stop loss to BE
It time to kill the UK100 and send them into recession.

FTSE Intra-day 15min 09-May-25Disclaimer: easyMarkets Account on TradingView allows you to combine easyMarkets industry leading conditions, regulated trading and tight fixed spreads with TradingView's powerful social network for traders, advanced charting and analytics. Access no slippage on limit orders, tight fixed spreads, negative balance protection, no hidden fees or commission, and seamless integration.
Any opinions, news, research, analyses, prices, other information, or links to third-party sites contained on this website are provided on an "as-is" basis, are intended only to be informative, is not an advice nor a recommendation, nor research, or a record of our trading prices, or an offer of, or solicitation for a transaction in any financial instrument and thus should not be treated as such. The information provided does not involve any specific investment objectives, financial situation and needs of any specific person who may receive it. Please be aware, that past performance is not a reliable indicator of future performance and/or results. Past Performance or Forward-looking scenarios based upon the reasonable beliefs of the third-party provider are not a guarantee of future performance. Actual results may differ materially from those anticipated in forward-looking or past performance statements. easyMarkets makes no representation or warranty and assumes no liability as to the accuracy or completeness of the information provided, nor any loss arising from any investment based on a recommendation, forecast or any information supplied by any third-party.

FTSE INTRADAY Bullish Flag continuation pattern?The FTSE 100 is showing bullish momentum, supported by an ongoing uptrend. Recent price action suggests a breakout above a period of sideways consolidation, indicating strong buying interest.
Key Support: 8454 – This was the previous consolidation zone and now acts as a critical level.
If the index pulls back to 8454 and holds, it may resume the uptrend with potential upside targets at:
8650 (near-term resistance)
8730, then 8825 (longer-term targets)
Bearish Scenario: A daily close below 8454 would weaken the bullish case and could lead to a decline toward:
8373 (next support)
Then 8272 and possibly 8100 if selling pressure increases
Conclusion:
The FTSE 100 remains bullish above 8454. Watch for a bounce from this level to confirm further upside. A break below would shift the outlook to bearish in the short term.
This communication is for informational purposes only and should not be viewed as any form of recommendation as to a particular course of action or as investment advice. It is not intended as an offer or solicitation for the purchase or sale of any financial instrument or as an official confirmation of any transaction. Opinions, estimates and assumptions expressed herein are made as of the date of this communication and are subject to change without notice. This communication has been prepared based upon information, including market prices, data and other information, believed to be reliable; however, Trade Nation does not warrant its completeness or accuracy. All market prices and market data contained in or attached to this communication are indicative and subject to change without notice.

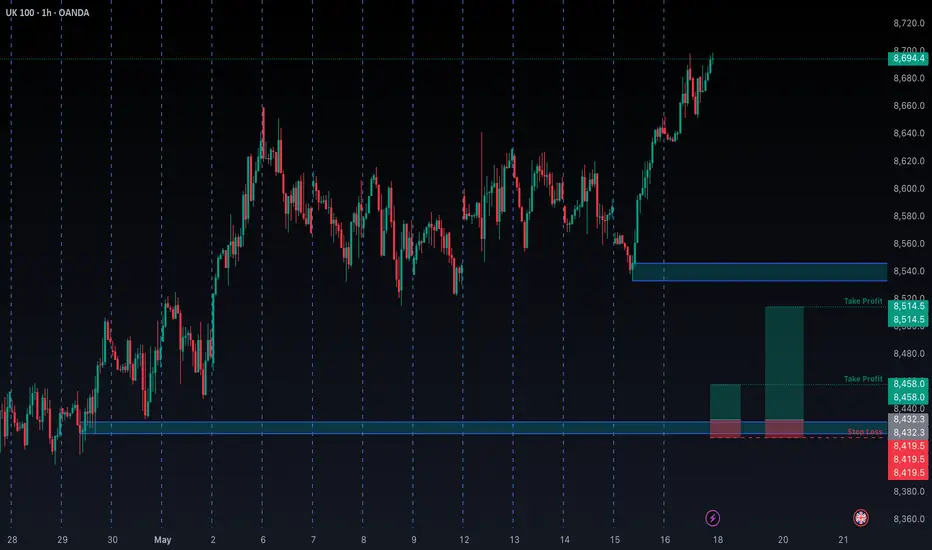
UK100 – Buy Limit Trade Setup (Intraday Idea)Expires: 09/05/2025 21:00
Trade Summary
Type: Buy Limit
Entry: 8465
Target: 8669
Stop Loss: 8394
Risk/Reward Ratio: ~2.9:1
Duration: Intraday
Technical View
Price action suggests a bottoming formation, which is typically a precursor to a bullish reversal.
Short-term pullback expected to offer a buying opportunity near the 8465 level.
Trend bias remains upward, and any dips are viewed as entry opportunities within this context.
Buying near bespoke support levels could improve risk/reward positioning.
Further upside expected with resistance at 8620, then 8915.
Key Technical Levels
Support Levels: 8390 / 8225 / 8060
Resistance Levels: 8620 / 8915 / 9290
Disclosure: I am part of Trade Nation's Influencer program and receive a monthly fee for using their TradingView charts in my analysis.

FTSE 100 H4 | Potential bullish bounceThe FTSE 100 (UK100) is falling towards an overlap support and could potentially bounce off this level to climb higher.
Buy entry is at 8,474.09 which is an overlap support that aligns close to the 23.6% Fibonacci retracement.
Stop loss is at 8,150.00 which is a level that lies underneath an overlap support.
Take profit is at 8,744.02 which is a multi-swing-high resistance.
High Risk Investment Warning
Trading Forex/CFDs on margin carries a high level of risk and may not be suitable for all investors. Leverage can work against you.
Stratos Markets Limited (tradu.com):
CFDs are complex instruments and come with a high risk of losing money rapidly due to leverage. 63% of retail investor accounts lose money when trading CFDs with this provider. You should consider whether you understand how CFDs work and whether you can afford to take the high risk of losing your money.
Stratos Europe Ltd (tradu.com):
CFDs are complex instruments and come with a high risk of losing money rapidly due to leverage. 63% of retail investor accounts lose money when trading CFDs with this provider. You should consider whether you understand how CFDs work and whether you can afford to take the high risk of losing your money.
Stratos Global LLC (tradu.com):
Losses can exceed deposits.
Please be advised that the information presented on TradingView is provided to Tradu (‘Company’, ‘we’) by a third-party provider (‘TFA Global Pte Ltd’). Please be reminded that you are solely responsible for the trading decisions on your account. There is a very high degree of risk involved in trading. Any information and/or content is intended entirely for research, educational and informational purposes only and does not constitute investment or consultation advice or investment strategy. The information is not tailored to the investment needs of any specific person and therefore does not involve a consideration of any of the investment objectives, financial situation or needs of any viewer that may receive it. Kindly also note that past performance is not a reliable indicator of future results. Actual results may differ materially from those anticipated in forward-looking or past performance statements. We assume no liability as to the accuracy or completeness of any of the information and/or content provided herein and the Company cannot be held responsible for any omission, mistake nor for any loss or damage including without limitation to any loss of profit which may arise from reliance on any information supplied by TFA Global Pte Ltd.
The speaker(s) is neither an employee, agent nor representative of Tradu and is therefore acting independently. The opinions given are their own, constitute general market commentary, and do not constitute the opinion or advice of Tradu or any form of personal or investment advice. Tradu neither endorses nor guarantees offerings of third-party speakers, nor is Tradu responsible for the content, veracity or opinions of third-party speakers, presenters or participants.

FTSE INTRADAY consolidation zone retest The FTSE 100 is showing bullish momentum, supported by an ongoing uptrend. Recent price action suggests a breakout above a period of sideways consolidation, indicating strong buying interest.
Key Support: 8454 – This was the previous consolidation zone and now acts as a critical level.
If the index pulls back to 8454 and holds, it may resume the uptrend with potential upside targets at:
8650 (near-term resistance)
8730, then 8825 (longer-term targets)
Bearish Scenario: A daily close below 8454 would weaken the bullish case and could lead to a decline toward:
8373 (next support)
Then 8272 and possibly 8100 if selling pressure increases
Conclusion:
The FTSE 100 remains bullish above 8454. Watch for a bounce from this level to confirm further upside. A break below would shift the outlook to bearish in the short term.
This communication is for informational purposes only and should not be viewed as any form of recommendation as to a particular course of action or as investment advice. It is not intended as an offer or solicitation for the purchase or sale of any financial instrument or as an official confirmation of any transaction. Opinions, estimates and assumptions expressed herein are made as of the date of this communication and are subject to change without notice. This communication has been prepared based upon information, including market prices, data and other information, believed to be reliable; however, Trade Nation does not warrant its completeness or accuracy. All market prices and market data contained in or attached to this communication are indicative and subject to change without notice.
