US2000 Short with Caution:: Fundamentally S&P, DOW, and NAS have broken the all-time high while Russell is at -20% from the previous high because RUSSELL is low cap index and they suffers when the interest rate is high -- RUSSELL is waiting for the NEXT rate cut to RUN above the existing zone (which is by the end of Jan and March. It seems that there will not be a rate cut in JAN).
PRICE ACTION
:: Monthly price (rising) above the baseline of TDI.
:: Weekly retesting of the baseline of TDI
Price reversed after an inverted hammer followed by a strong bearish close. However, Doji is followed by Hammer BUT they are not at the significant zone (high or low position of the trend) to expect the reversal.
:: Daily Price is still below the previous swing low.
Got to wait till W or divergence formation in TDI for a buying opportunity
4th attempt to break the consolidation but failed.
:: 4H at previous swing low (perfect zone to reverse and make new low)
Price at a minor trendline and should not have a sustained close above.
SK SYSTEM
After a complete sequence at 2461, the price tested the 1460-1710 B zone and has respected this zone since June 2022.
The sequence that started from Oct-2023 has completed its full sequence by closing higher than the previous three highs (accumulation price high).
After the completion of a sequence, we expect the retest to the WCL level which is the TP1 Zone;
Hence, I am looking for a SHORT opportunity as a correction move BUT if the price closes above 1987 I will look for a buy Opportunity.
TP2 doesn't seem to be appropriate as if the price has to attempt a bullish, price should not come back to the TP2 zone which is the consolidation low area.
US2000 trade ideas

US2000 H4 | Downward trend to resumeUS2000 is rising towards a pullback resistance and could potentially reverse off this level to drop towards our take-profit target.
Entry: 1,944.21
Why we like it:
There is a pullback resistance that aligns close to the 23.6% Fibonacci retracement level
Stop Loss: 1,988.39
Why we like it:
There is a pullback resistance that aligns with the 50.0% Fibonacci retracement level
Take Profit: 1,874.74
Why we like it:
There is a pullback support that aligns close to the 61.8% Fibonacci retracement level
Please be advised that the information presented on TradingView is provided to Vantage (‘Vantage Global Limited’, ‘we’) by a third-party provider (‘Everest Fortune Group’). Please be reminded that you are solely responsible for the trading decisions on your account. There is a very high degree of risk involved in trading. Any information and/or content is intended entirely for research, educational and informational purposes only and does not constitute investment or consultation advice or investment strategy. The information is not tailored to the investment needs of any specific person and therefore does not involve a consideration of any of the investment objectives, financial situation or needs of any viewer that may receive it. Kindly also note that past performance is not a reliable indicator of future results. Actual results may differ materially from those anticipated in forward-looking or past performance statements. We assume no liability as to the accuracy or completeness of any of the information and/or content provided herein and the Company cannot be held responsible for any omission, mistake nor for any loss or damage including without limitation to any loss of profit which may arise from reliance on any information supplied by Everest Fortune Group.

Will US2000 find buyers at market?US2000 - 24h expiry
Although the bears are in control, the stalling negative momentum indicates a turnaround is possible.
We are trading at oversold extremes.
This is positive for short term sentiment and we look to set longs at good risk/reward levels for a further correction higher.
Previous support located at 1924. Preferred trade is to buy on dips.
We look to Buy at 1925 (stop at 1905)
Our profit targets will be 1975 and 2010
Resistance: 2010 / 2080 / 2110
Support: 1865 / 1820 / 1775
Risk Disclaimer
The trade ideas beyond this page are for informational purposes only and do not constitute investment advice or a solicitation to trade. This information is provided by Signal Centre, a third-party unaffiliated with OANDA, and is intended for general circulation only. OANDA does not guarantee the accuracy of this information and assumes no responsibilities for the information provided by the third party. The information does not take into account the specific investment objectives, financial situation, or particular needs of any particular person. You should take into account your specific investment objectives, financial situation, and particular needs before making a commitment to trade, including seeking advice from an independent financial adviser regarding the suitability of the investment, under a separate engagement, as you deem fit.
You accept that you assume all risks in independently viewing the contents and selecting a chosen strategy.
Where the research is distributed in Singapore to a person who is not an Accredited Investor, Expert Investor or an Institutional Investor, Oanda Asia Pacific Pte Ltd (“OAP“) accepts legal responsibility for the contents of the report to such persons only to the extent required by law. Singapore customers should contact OAP at 6579 8289 for matters arising from, or in connection with, the information/research distributed.

big down side, small upside in RUTRusell 2000 maybe leading the rest of the market to the downside.
Russell has exposure to financial and energy, more so than nasdaq and large cap sp500.
MMFI- is the percentage of stocks over the 50 day moving average. Useful in indicating how broadly bullish or bearish the market is, how the crowd is leaning in sentiment.
VIX- is volatility index which measure options premium for 30 days and annualizes number, also known as fear indicator and is useful in measuring expected movement and uncertainty by traders.
While price has been rising in sp500, could RUT russell2k be signaling a turn coming in profit taking or more.
Trade Idea- bear spreads for 6 months out or more, profit taking , asset allocation rebalancing.
*Not advice, just what I'm doing and thinking for me

US2000 H4 | Potential bearish reversalUS2000 could rise towards a pullback resistance and potentially reverse off this level to drop lower.
Sell entry is at 1,987.83 which is a pullback resistance.
Stop loss is at 2,024.47 which is a pullback resistance that sits above the 61.8% Fibonacci retracement.
Take profit is at 1,923.50 which is a pullback support.
High Risk Investment Warning
Trading Forex/CFDs on margin carries a high level of risk and may not be suitable for all investors. Leverage can work against you.
Stratos Markets Limited (www.fxcm.com):
CFDs are complex instruments and come with a high risk of losing money rapidly due to leverage. 67% of retail investor accounts lose money when trading CFDs with this provider. You should consider whether you understand how CFDs work and whether you can afford to take the high risk of losing your money.
Stratos Europe Ltd, previously FXCM EU Ltd (www.fxcm.com):
CFDs are complex instruments and come with a high risk of losing money rapidly due to leverage. 72% of retail investor accounts lose money when trading CFDs with this provider. You should consider whether you understand how CFDs work and whether you can afford to take the high risk of losing your money.
Stratos Trading Pty. Limited (www.fxcm.com):
Trading FX/CFDs carries significant risks. FXCM AU (AFSL 309763), please read the Financial Services Guide, Product Disclosure Statement, Target Market Determination and Terms of Business at www.fxcm.com
Stratos Global LLC (www.fxcm.com):
Losses can exceed deposits.
Please be advised that the information presented on TradingView is provided to FXCM (‘Company’, ‘we’) by a third-party provider (‘TFA Global Pte Ltd’). Please be reminded that you are solely responsible for the trading decisions on your account. There is a very high degree of risk involved in trading. Any information and/or content is intended entirely for research, educational and informational purposes only and does not constitute investment or consultation advice or investment strategy. The information is not tailored to the investment needs of any specific person and therefore does not involve a consideration of any of the investment objectives, financial situation or needs of any viewer that may receive it. Kindly also note that past performance is not a reliable indicator of future results. Actual results may differ materially from those anticipated in forward-looking or past performance statements. We assume no liability as to the accuracy or completeness of any of the information and/or content provided herein and the Company cannot be held responsible for any omission, mistake nor for any loss or damage including without limitation to any loss of profit which may arise from reliance on any information supplied by TFA Global Pte Ltd.
The speaker(s) is neither an employee, agent nor representative of FXCM and is therefore acting independently. The opinions given are their own, constitute general market commentary, and do not constitute the opinion or advice of FXCM or any form of personal or investment advice. FXCM neither endorses nor guarantees offerings of third party speakers, nor is FXCM responsible for the content, veracity or opinions of third-party speakers, presenters or participants.

RUT 2K Fell 17.50% After the Last U.S. Credit DowngradeIf you haven`t bought the RUT 2K regional Double Bottom here:
On Tuesday, Fitch Ratings downgraded the US debt rating from the highest AAA rating to AA+, citing "a steady deterioration in standards of governance."
This downgrade occurred following last-minute negotiations among lawmakers to secure a debt ceiling deal earlier this year, which put the nation at risk of its first default.
Following a similar credit downgrade in the past, the RUT 2K Russell 2000 experienced a sharp decline of 17.50% within a three-month period. S&P, one of the three major credit rating firms, downgraded U.S. debt on Aug. 5, 2011, after another significant debt ceiling battle.
Presently, the U.S. 10-year Treasury yield has risen to 4.15%, reaching its highest level since November 2022.
Even though is not likely, a 17.50% decline will lead to a Price Target of $1630 for RUT 2K.
Looking forward to read your opinion about it.

RUT 2K Price Prediction for 2024If you haven`t bought the Double Bottom on RUT 2K:
Then you probably know that small caps haven`t participated in the 2023 market rally.
That`s why I believe investors will will for opportunities in the small cap stocks in 2024, and Russell 2000 index might offer a bigger return than the S&P this year.
My price prediction for RUT 2K is $2560 by the end of the year.

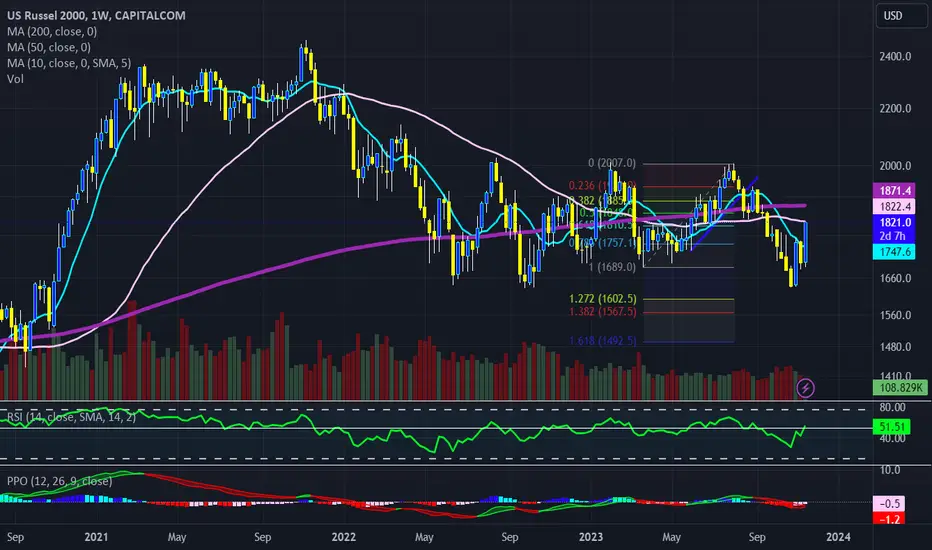
RUSSELL 2000 on a 20 month High! Is it sustainable?Russell 2000 (RUT) gave us an excellent buy entry on our last call (see chart below), as we achieved the most optimal buy near Support 2 and rallied all the way to our 2000 Target:
The Resistance Zone broke and this delivered a new 20-month High on the index, the effect of which is more accurately seen on the 1W time-frame. The question is, how sustainable can this rally be?
Well as the 1W RSI is only 3 points away from getting overbought (70.00) for the first time since March 2021, having also entered the 2 year Higher Highs Zone, it becomes less and less sustainable. In fact a less risky medium-term strategy would be to start selling and target the 1D MA50 (red trend-line). That is where we will reverse to a buy and target Resistance 1 at 2140.
-------------------------------------------------------------------------------
** Please LIKE 👍, FOLLOW ✅, SHARE 🙌 and COMMENT ✍ if you enjoy this idea! Also share your ideas and charts in the comments section below! This is best way to keep it relevant, support us, keep the content here free and allow the idea to reach as many people as possible. **
-------------------------------------------------------------------------------
💸💸💸💸💸💸
👇 👇 👇 👇 👇 👇

$RSP & $RUT performing better at the moment, vs $SPXAMEX:RSP vs AMEX:SPY
Equal weight vs regular #SP500
We can see that equal weight has been performing better
Russell 2000
TVC:RUT is no longer stuck in a rut :)
It had a fake breakout in the daily charts in August but look at it now.
That weekly is looking Nicely!
We've stated a few times that we believed these 2 would be moving better than normal averages.
We also said TVC:DJI would keep leading, it has. Another new All time high.
Another call, NASDAQ:NDX should surpass, it's more aggressive.
Russel priced in goldWhy is this so hard to accept?
US small cap stocks have been steadily losing (in real terms) since 2018.
Can even make a case the bull era for gold has started back in June 2019 against them.
The chart provides unbiased and objective evidence.
#gold

Looking for 2100 as first stop to ATH on RUTLooks like we are building a base for the next move higher. it will not be an easy ride - but aiming to target 2100 on RUT followed by ATH. Taking it week by week - since i am a day-trader will not hold till then. piece by piece - grab your money and run. On a break of the Monthly FVG - a potential pullback to the optimal trade entry should be considered. A rotation from tech more into RUT could happen or all move in tandem. History will prove me wrong in the future.

Small Cap may break above major resistance since June 2022With 3 time rate cutting in 2024, it will benefit small cap due to loan/debt interest repayment.
This will help the small cap companies.
On daily time frame, RSI is at overbought level which you may want to be caution to chase the bullish trend. Waiting for pullback to long.
Break and close above 2010 = may see 2150 follow by 2300 in year 2024.
On weekly time frame, there is still room for RSI to go even higher.

Russell 2000 B Wave Flat Correction Near Complete. I was forced to relabel my interpretation of the Russell 2000 after the July 2023 high was broken. The structure is now labeled as a regular flat primary B wave correction that is either complete, or nearly complete. The next wave down should be rather fierce, as C waves tend to be. Wave C will decline in 5 waves to meet the depth guideline near the terminus of the previous 4th wave of lessor degree. Somewhere near $971.

Small Cap may benefit from year end rallySmall cap have been trading sideway since Jun 2022 with the resistance around 2k.
With end of year rally, it may benefit small cap index.
Eying to return back to 2k resistance level.

US2000: Technical outlookLevels plotted to look out for, combined with daily and weekly MAs to be used as S/R confluences. RSI and MS are indicating a possible reversal, not a signal itself but a confluence to the shorts from S/R levels. You should also check US500 and US30 before shorting.

Russell 2000 Start of movement in second line stocksRussell 2000 Start of movement in second line stocks
The index was until the last few days very close to the pre-Covid rates
Now starting to wake up with huge potential

Strong ResistanceWe have stopped at a former triple bottom which has been tested as a resistance twice now already.
So it may become a double top now. This the more that it was a top on May 23rd already.
The Moving Average is another resistance.
On November 14th we have opened window that may want to be closed.
Mind the trading range from mid March to 20th May which you can see easily in the weekly chart. It marks the top of today as well as the possible correction level.
We can say that the index has corrected the fall from end of July until 23rd October now and is back in its previous trading range.
This range may hold till the end of the year.

RUSSELL 2000: Short term pullback possible but buy for 1910.Russell 2000 crossed again today overo the 1D MA200 and it remains to be seen if it succeeds at closing above it. After the November 15th crossing but failure to close over it, a repeat may materialize a pullback of at least -4.50%, in similar fashion as the 1D MA200 rejections of May 23rd 2023 and November 1st 2022.
Technically that's possible as on the greater picture, the index is still neutral on the 1W technical outlook (RSI = 50.610, MACD = -19.910, ADX = 34.284) sitting almost halfway of the giant consolidation/ Rectangle pattern of the past year and a half.
Consequently, we will welcome any pullback as a buy opportunity, but we are already bullish, aiming at the R1 level (TP = 1,910).
## If you like our free content follow our profile to get more daily ideas. ##
## Comments and likes are greatly appreciated. ##

Russell priced in goldThat could be it for US small caps #stocks priced in #gold...
this line lost
bull era for gold and silver

Will Rusell2000 follow SP500 and NASDAQ100?
The Russell 2000 index consists of 2,000 small-cap companies, making up the smallest segment of the Russell 3000, which covers approximately 98% of publicly traded stocks in the U.S. Every June the index is rebalanced, adding new companies or removing existing ones.
Currently, the market is focusing on the positive aspects of the data and favoring the demand side. However, the medium-term structure remains trapped in a wide sideways trend, with resistance and support levels acting as key boundaries on the chart.
The Russell 2000 index is highly sensitive to GDP growth, which the Federal Reserve actively manages to control inflation. Consequently, the path of the Russell 2000 is influenced by the trajectory of U.S. economic growth - small caps typically have weaker balance sheets, higher levels of floating debt, lower profit margins, and longer durations, which add to its vulnerability.
The Price Line overlays are Nasdaq100 and SP500.

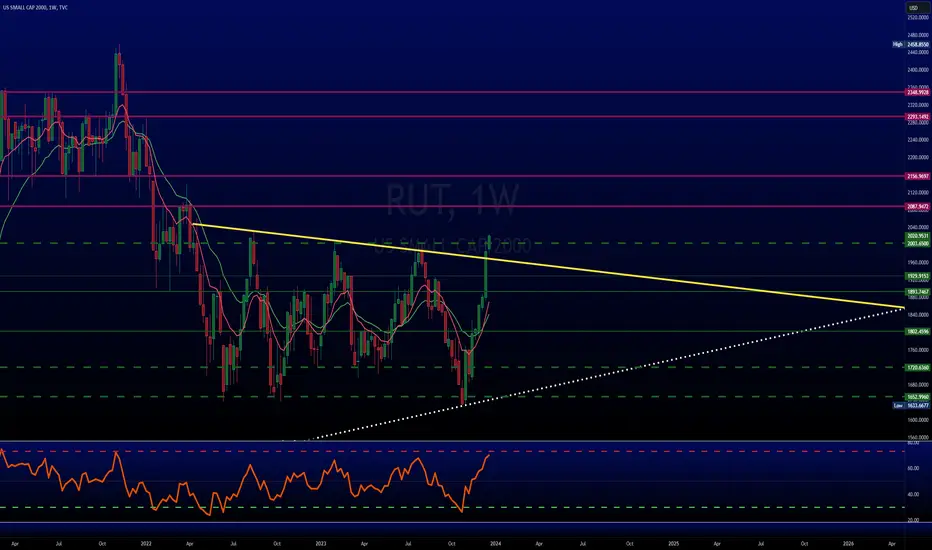
US Russell 2000 RTY ~ Ping Pong Perpetuity (Daily Chart)CAPITALCOM:RTY chart mapping/analysis.
Russell 2000 still stuck within trading range despite recent rallies across major US indices.
What's on the chart:
Ascending parallel channel (light blue) captures upward trend over multi-decade timeframe
Descending parallel channel (white) frames downward trend from upper to lower range (multi-decade) parallel channel
Horizontal lines (yellow dashed) locks in trading range (June 2022 to present)
Descending trend-line (light blue dotted) highlights pivot support points
Fibonnaci levels establishes key supply/demand zones
Short-medium term outlook:
Neutral-bearish
RTY remains in " Ping Pong Perpetuity " until breakout on either side of trading range
200DMA acting as dynamic resistance, exerting downward pressure
Bullish reversal = rally above 200DMA to switch trend & test upper trading range

SHORT RUT/RTYSHORT RUT/RTY 1820
stop 1900
target sub 1600
This rally on one fluky/flaky piece of data makes zero sense
Inflation is not going away anytime soon
Russell2000russell2000 continues laterization, possible breakout of the long-term high channel, after 2024 only
