US100 Locking as Bullish directionUS00 Structure Looking as strong Bullish Pattern,
Forecast from Mr Martin Date 02 May 2025,
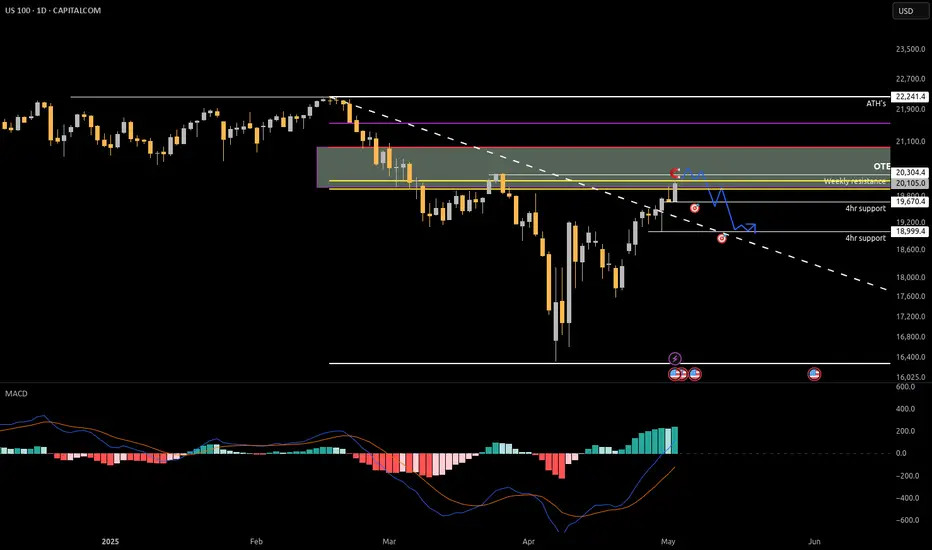
US100 Price will looking as buy side recently price will break and catch the support after push to buy side the bullish structure continue to play out the next project would be a clean rally toward the top of the channel US100 is holding its bullish structure well,
Key Level to watch
Resistance level 20,500 / 21,000
Support Levels 19,500
you can find more details in the chart of you find this idea help or learned something new then leave comments Thanks for Regarding.
USTEC trade ideas

A daily bias for 2025 Find the range of the day which has the protected high's and protected low's looks for contuniation or liquidity grab and small time trame determine if a CSID or continuation form Is taking place

US100 / NASDAQ#US100 BEST PLACE TO SELL FROM|SHORT🔴
📉US100 SIGNAL
✔️Trade Direction: short
✔️Entry Level: 20,101.6
✔️Target Level: 18,779.9
✔️Stop Loss: 20,975.6
📊RISK PROFILE
⭐️Risk level: medium
⭐️Suggested risk: 1%
⭐️Timeframe: 1D
——————

Approaching 200SMA and long-term uptrend line, pullback expected(The following is a personal opinion and not investment advice. Please exercise independent judgment before making any decisions.)
Last week, the market remained in a consolidation phase near recent highs. The current price has broken through and is approaching the 200-day moving average, while also nearing a retest of the uptrend line that began in 2023. Considering the price has been on a 9-day upward streak, there is a high probability of a significant pullback upon reaching these key resistance levels.
At present, it is difficult to categorize the overall market trend as either bullish or bearish. With ongoing uncertainty around tariff-related policies, the market appears to be in a consolidation phase rather than a sustained uptrend, lacking fundamental support for further rallies. As such, there is a higher probability that the price will fill the lower gap at 18,264.
Next week, special attention should be given to the FOMC rate decision and the press conference on Wednesday. Recent employment data has been strong, and inflation has shown signs of rising. The Fed is expected to maintain its current stance, which could trigger a market sell off. It's also possible the pullback may begin as early as Monday or Tuesday, offering opportunities for early positioning.
From a technical perspective, if the price continues to rise, it may test the area around the 200-day moving average and previous trend resistance, roughly between 20,226 and 20,400. Should this area be tested early in the week (Monday or Tuesday), I would consider initiating short positions. Light positions can be considered above the 20,000 level, as the current price range offers a relatively favorable risk-to-reward.
To the downside, a break below the 19,000 level is required first, after which there's a higher probability of filling the price gap between 18,264 and 18,583. If supported by macro news, the market may further test lower levels in the coming weeks, including 17,589, 17,278–16,946, and potentially 16,108–16,589. These levels will require further observation as developments unfold.

US100 BEST PLACE TO SELL FROM|SHORT
US100 SIGNAL
Trade Direction: short
Entry Level: 20,101.6
Target Level: 18,779.9
Stop Loss: 20,975.6
RISK PROFILE
Risk level: medium
Suggested risk: 1%
Timeframe: 12h
Disclosure: I am part of Trade Nation's Influencer program and receive a monthly fee for using their TradingView charts in my analysis.
✅LIKE AND COMMENT MY IDEAS✅

NAS100 1WTake a look at this chart! After a solid uptrend, the price broke an important ascending trendline and corrected down to the 0.5 Fibonacci level — right where a key structural support zone is (that blue area near the bottom).
From there, we’ve seen a strong bounce back upward, and now the price has reached a critical zone:
Previous resistance
The 0.618 to 0.786 Fibonacci retracement area
And most importantly, a retest (pullback) to the broken trendline
There are two possible scenarios ahead:
1. If the price breaks and holds above this resistance zone, we might see the continuation of the bullish move.
2. But if it fails to break through, the market could enter another corrective phase.
Also, keep in mind that we have the interest rate decision this week. With Trump applying repeated pressure, there’s a chance rates might be cut — which could fuel a green, bullish market.

Bearish Look for potential Reversal bearish candlestick formation upon the retest of daily supply zone.

NASDAQ-100 Head & Shoulders Breakdown?I've been tracking a potential head and shoulders pattern on the NASDAQ-100, with a neckline at 17,720. If the pattern completes and breaks down convincingly, the measured move projects a target near 13,200 — a significant potential drop.
While technical patterns aren’t guarantees, they often coincide with underlying fundamentals. In this case, there are several macroeconomic headwinds that could catalyze such a decline:
Sticky Inflation and Interest Rate Uncertainty: Despite some progress, inflation remains above the Fed’s target. A “higher for longer” rate environment continues to pressure equity valuations, especially in tech-heavy indexes like the NASDAQ-100.
Weakening Consumer and Corporate Spending: Retail sales and corporate earnings revisions have shown signs of fatigue, suggesting slowing momentum in key economic drivers.
Global Tensions and Supply Chain Risks: Ongoing geopolitical instability, including issues in the Middle East and renewed U.S.–China trade rhetoric, could reignite volatility and affect global growth assumptions.
Overvaluation and Narrow Market Breadth: A small group of mega-cap tech names have driven much of the recent rally, leaving the broader market vulnerable if leadership falters.
With technical and fundamental factors aligning, this setup is worth watching closely. A confirmed break below the neckline could be more than just a chart pattern—it may reflect a broader shift in sentiment.

US100 - Perfect Long Opportunities Unfolding?This chart illustrates a high-probability bullish setup based on a combination of market structure shifts, fair value gaps (FVGs), Fibonacci retracement confluence, and order block interaction. We are analyzing the US Tech 100 on the 1-hour timeframe, focusing on recent price action development and a potential reversal scenario forming after a corrective move.
Context and Market Structure:
Price action has been in a corrective downtrend after printing a local high near the 19,950–20,000 range. This move led to a break in short-term bullish structure as sell-side liquidity was swept. A series of bearish candles followed, confirming a shift in momentum to the downside.
However, the retracement stalled upon entering a prior area of imbalance—highlighted here as a larger fair value gap (FVG) zone. This FVG zone acted as a significant demand area, with price reacting strongly upon entry. The zone is marked with a light blue shaded rectangle and aligns with a 1-hour bullish order block.
Price created a swing low in this FVG area before forming higher lows, suggesting the possibility of a short-term reversal.
Golden Pocket & Liquidity Sweep:
A key zone of interest is the "Golden Pocket downtrend" area, which is derived from the 0.618–0.65 Fibonacci retracement levels of the last impulse down. Price previously respected this zone, leading to a rejection and continuation lower. This makes it a notable supply area. Price may revisit this zone as a target or potential reaction point on the next bullish leg.
Note how the initial reaction from the FVG brought the market back into a smaller 1H FVG, situated just beneath the 0.5 retracement level. The internal structure within this zone supports a bullish outlook due to the formation of a higher low followed by a bullish engulfing candle.
Fibonacci Confluence & Execution Levels:
The 0.618 Fibonacci retracement level of the recent move aligns closely with the midpoint of the bullish FVG, providing confluence for a potential re-entry or continuation point. This level is annotated on the chart and highlighted with a horizontal line labeled "0.618 - Entry." This suggests it may act as a magnet for price before further continuation to the upside.
The 0.786 retracement level, also plotted on the chart, indicates the deeper end of the retracement spectrum and lies just above a major structural low. This region, though aggressive, would represent a final line of defense for bullish continuation.
Projection and Price Path:
Based on the current structure and bullish reaction from the FVG zone, a potential price path is drawn on the chart. It suggests one more liquidity grab into the FVG area followed by an impulsive move to the upside.
The blue projection line outlines a potential retracement to fill the nearby FVG (which remains partially unmitigated), followed by a resumption of bullish momentum that targets a revisit to the previous high area around 19,875.
Additional Notes:
* Multiple FVGs are actively interacting in this region, giving layered confluence for demand zones.
* The reaction from the FVG zone is coupled with a bullish engulfing pattern on the 1-hour timeframe, signaling aggressive buying.
* Price remains above the internal bullish structure despite the earlier rejection from the Golden Pocket area.
Conclusion:
The chart setup represents a textbook example of FVG demand zone reaction, supported by Fibonacci confluence and market structure shifts. As price consolidates above this key FVG, a continuation to the upside becomes a strong probability if the internal structure remains intact. Traders should monitor price behavior on lower timeframes as it interacts with the 0.618 and FVG zones for confirmation of bullish continuation.

US100 – Bullish Continuation Setting Up Inside the ChannelUS100 remains firmly bullish, showing consistent strength after breaking out from the prior consolidation range in mid-April. Price action has been moving cleanly within a well-defined ascending channel, supported by strong impulsive moves followed by shallow retracements. Each pullback so far has been relatively controlled, and buyers have been stepping in aggressively from clearly defined zones, which aligns with the current risk-on sentiment across tech-heavy indices.
Consolidation Structure
We’ve now had two solid retests of prior fair value gaps (FVGs), both of which acted as demand zones and helped fuel continuation. The first pullback dropped into a previously formed imbalance, consolidated briefly, and then launched a strong bullish leg. The second did the same, creating a layered structure of bullish continuation through efficient retracements. Each of these reactions confirms that price is respecting areas where institutional orders may have been left behind, which adds confluence to the trend’s strength.
Currently, price is working on forming a third FVG within the upper half of the channel. This is developing just below recent highs and has not yet been retested, which makes it a key area of interest. If the market pulls back into that imbalance with proper structure, it could offer the next high-probability opportunity to join the trend.
Bullish Scenario
If price retraces into this newly forming FVG and holds, especially with a wick or lower timeframe rejection candle inside the zone, it could mark the start of the next impulse. The overall trend remains intact as long as we stay within the channel and each FVG continues to serve as valid support. Given the strength of the previous bounces and the orderly nature of this structure, any retest into this new FVG would likely lead to another push into fresh highs and a move toward the upper boundary of the channel.
Bearish Scenario
On the flip side, if price fails to respect this new FVG and breaks below with momentum, especially if the channel support fails at the same time, it would be a sign that buyers are losing control. In that case, we’d want to see how price interacts with the last confirmed FVG below before making any bearish assumptions. A deeper pullback into that area could still provide another long opportunity if structure holds, but any sharp momentum break through both imbalances would put the bullish trend on pause and shift focus to downside levels.
Price Target and Expectations
Assuming the bullish structure continues to play out, the next projected move would be a clean rally toward the top of the channel. There’s enough space left between current levels and the upper trendline to justify an entry on the next pullback, provided it lands inside the newly created FVG. The setup is fairly straightforward, let price come back into the imbalance, confirm with lower timeframe strength, and ride the continuation leg.
Current Stance
There’s no need to chase price here. The best scenario is waiting for a patient retest of the fresh FVG forming now. If it pulls back cleanly, holds the zone, and gives confirmation, that would be the entry. Momentum, structure, and market context are all aligned for continuation, but the trade needs to be built off a level that shows actual commitment from buyers.
Conclusion
US100 is holding its bullish structure well, forming clean legs within an ascending channel, and repeatedly respecting fair value gaps as demand zones. With a new imbalance forming beneath the most recent high, the setup is shaping up for another continuation play if price rotates back and holds. It’s a wait-and-see moment for now, but if the FVG gets tagged and buyers show up, this could be the next leg higher in an already strong trend.
___________________________________
Thanks for your support!
If you found this idea helpful or learned something new, drop a like 👍 and leave a comment, I’d love to hear your thoughts! 🚀
Make sure to follow me for more price action insights, free indicators, and trading strategies. Let’s grow and trade smarter together! 📈

Long-term bearish to 14kJust adding to the idea previously posted:
A black upward trendline shows a strong bullish trend from mid-2022 through early 2025. Recently, there’s been a significant breakdown below this trendline, which signals a substantial change in trend from bullish to bearish. On Friday, we tested and rejected this trendline, which at the same time tested a 65% (golden pocket) retracement of the recent move, indicating a possible resistance area after a strong rebound.
I expect the price not to break this level any further.
The target remains 14k and below.

Short idea Us100, sweep of weekly resistancePrice is nearing the weekly resistance after extremely bullish price, expecting price to start stalling next week as it pushes in to the golden pocket zone where we'll see a move down and some higher lows lock in.
Ill be looking for a short entry on a low volume move up on the 5 minute time frame after we've taken the external liquidity above the weekly resistance level
Don't let the Recession paralysed you !!!!Read these few articles here , here and here
If you buy into any of the above articles as the gospel truth, you may freak out and starts to sell your holdings in US as some gurus advised you to do so. Take a step back and asked - WHY ?
Is the content creator saying this out of your interests or his ? Remember, positive news seldom receive likes and sharing but negative on the other hand will receive more. That is why it is easier to spell doom, gloom and boom and have lots of people liking it !
Of the 3 main indices, the Tech stocks have already gotten out of the woods as it has been up more than 20% from the bottom. SPX and DJA are still playing catch up. Due to the tariffs, many goods produced in US and are sold in China are now seeing dwindling sales. Patriotism or "guo chao" in Chinese is the anti-US sentiments that is now hot in China. That means the locals will rather buy Anta or Li Ning sports shoes over Nike or Adidas. Same for cosmetics!
There are some technical chartists or analysts saying this is a dead cat bounce and once the price hit the support line (in purple), it will continue to sell down. Yes, it is possible though I think it is less probable.
6 months down the road when we look back and IF I am lucky and predicted correctly, there will be many people who will kick themselves for missing a nice bottom buy on 9th April (thanks to Donald Trump who tweeted it).
Timing the market is TOUGH as I had learnt my lessons . WB , the legendary guru is right - be in the market meaning invest in the market for the long haul in fundamentally strong companies with economic moat and strong cash flows, etc will reap better returns.
As usual, please DYODD

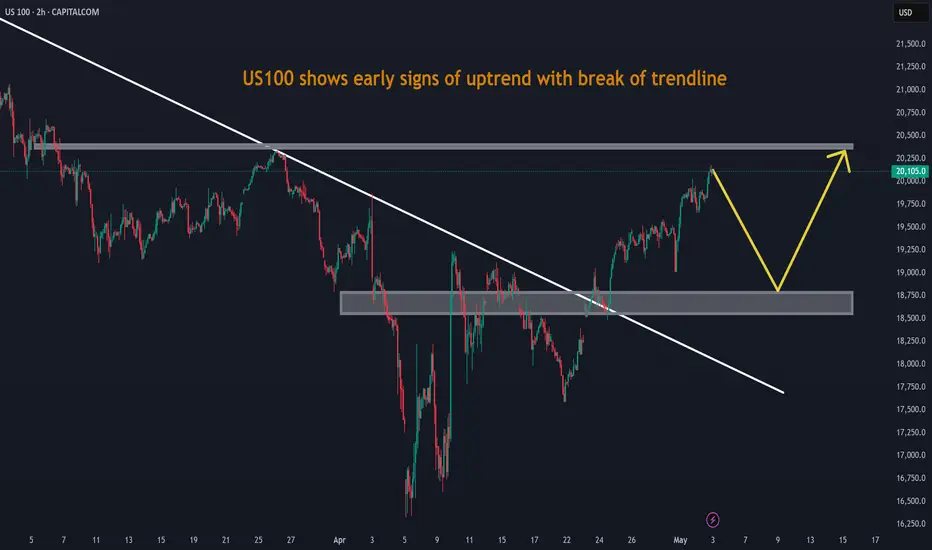
US100 shows early signs of uptrend with break of trendlineUS100 shows early signs of uptrend with break of trendline. It may retrace before upward momentum.
Technical and digital analysisWe notice that we are in an upward correction and there is an increase in momentum. We are waiting for sellers to weaken in order to buy

Next up Nasdaq = US100 buy continues.if the correction wave ended at 0.5 fibo level which is current dip next target is new high. in shorter time timezones first targets are 19900 - 20250 - 22300
