ICPUSDT 1D#ICP is moving inside a rectangle pattern and has already broken above the long-term descending trendline. It has completed a successful retest, and the price is now trading above both the daily SMA100 and the Ichimoku Cloud — a strong bullish signal.
We expect a breakout above the rectangle soon. In case that happens, the targets are:
🎯 $6.233
🎯 $7.320
🎯 $8.289
🎯 $9.258
🎯 $10.638
🎯 $12.395
⚠️ As always, use a tight stop-loss and apply proper risk management.
ICPUSDT trade ideas

ICP Closing in on Major Resistance – Eyes on Retest ZoneIf $ICP/USDT breaks above the marked resistance and successfully retests the zone, we could see a strong move to the upside.
It’s shaping up well — keep it on your radar.
DYOR, NFA

icp short tradein my opinion this is a good trade with a good r/r
hope it hit the target
consider this is my trade not your trade and i just like to share my trades with world
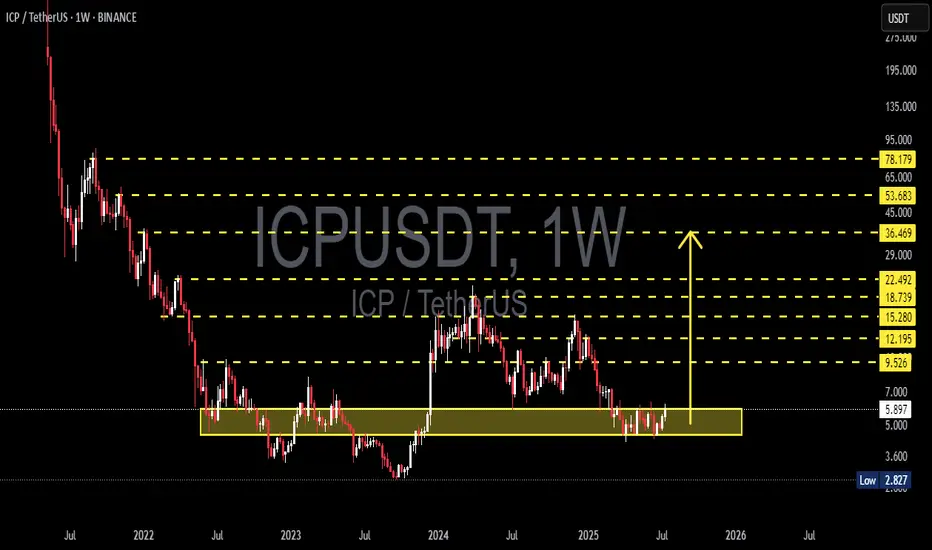
ICP/USDT Weekly Analysis: Multi-Year Accumulation Base🔍 Macro Outlook & Context:
ICP has been in a prolonged downtrend since its initial listing, dropping over 95% from its all-time high. However, since late 2022, ICP has been forming a strong and well-defined accumulation base between the $3.00 – $6.00 range.
Currently, price action and structure indicate that a potential breakout from this multi-year base is imminent. The setup is beginning to mirror a Wyckoff Accumulation Phase, where smart money accumulates quietly before launching into the next markup phase.
📐 Technical Structure & Pattern Breakdown:
✅ Accumulation Zone
Over 80 weeks of consolidation within a tight horizontal range.
This forms a strong foundation for a powerful breakout move if confirmed.
✅ Multiple Bottom Formation
Repeated failures to break below $3.50 suggest growing bullish pressure and seller exhaustion.
✅ Bullish Compression
Higher lows forming inside the range.
Resistance at $6.00 is being tested more frequently, indicating a breakout buildup.
✅ Volume Profile
Declining volume during sideways action = typical of supply exhaustion.
Surge in volume during breakout would confirm entry into markup phase.
🚀 Bullish Scenario (Primary Setup):
If price breaks and closes above $6.00 on the weekly timeframe:
Key Resistance Targets:
$9.52 → $12.19 → $15.28 → $18.73 → $22.49
Extended Bull Market Targets:
$29 → $36 → $45+
Potential ROI from base zone: +200% to +600%
Bullish Confirmation Signals:
Strong weekly candle close above $6.00
Volume breakout
RSI crossing 50 and MACD bullish crossover
🐻 Bearish Scenario (Alternative):
If the breakout fails and rejection occurs at $6.00:
Possible retracement back to lower support zones:
$4.50 → $3.00
A breakdown below $3.00 would invalidate the bullish structure and open risk for new lows.
Bearish Red Flags:
Long upper wick near resistance without volume
RSI drops back under 40
Breakdown of $3.50–$4.00 support zone
📊 Trading Strategy & Risk Management:
Entry Type Price Range
Breakout Entry $6.20–$6.50
Conservative SL $5.20
Aggressive SL $4.70
TP Range $9.5 to $22.4
Long-Term TP Up to $45+
Use scaled take-profits to secure gains gradually and reduce risk.
🧠 Market Sentiment & Psychology:
Sentiment is slowly shifting from fear to anticipation. Long-term accumulators and institutional players often target setups like this — low prices with solid structure and untapped upside. If breakout confirms, ICP could become one of the top-performing altcoins of the next cycle.
> “Accumulation is where smart money buys. Breakout is where the public chases.”
📌 Final Thoughts:
ICP/USDT is at its most critical point in over two years. A confirmed breakout from this long-standing base could be the launchpad for a multi-stage rally. This is a setup worth watching closely — or acting on with tight risk control.
#ICPUSDT #CryptoBreakout #AltcoinAnalysis #TechnicalAnalysis #WyckoffAccumulation #LongTermSetup #CryptoReversal #BullishCrypto #ICPAnalysis #AltcoinSeason #BreakoutTrade #Cryptocurrency
TradeCityPro | ICP Eyes Breakout as Altseason Speculation Grows 👋 Welcome to TradeCity Pro!
In this analysis, I want to review the ICP coin for you—one of the DePIN and AI-related coins, ranked 37 on CoinMarketCap with a market cap of 3.11 billion.
📅 Daily timeframe
As you can see on the daily timeframe, a ranging box has formed around the key support at 4.648, and price is fluctuating inside this box.
🔔 The top of the box is at 6.205, and price has touched it multiple times. It just wicked into it again and got rejected.
📈 This level has become a very important resistance. If it breaks, we can enter a long position—and it’s even suitable for a spot buy.
🛒 I already hold this coin in spot from lower entry points and don’t plan to increase my spot volume, but I’ll open a futures position if 6.205 breaks.
🔽 If Bitcoin Dominance moves downward, the 6.205 trigger will be a very good entry point. A break above 70 on the RSI will also be a strong momentum confirmation.
📊 If price gets rejected from the top of the box and drops to the 4.648 support, we can open a short position in lower timeframes. A break below 4.648 would confirm the bearish outlook.
📝 Final Thoughts
This analysis reflects our opinions and is not financial advice.
Share your thoughts in the comments, and don’t forget to share this analysis with your friends! ❤️

ICPUSDT - Long-term Spot Buy Recommendation (2025)ICPUSDT – WHAT'S YOUR AVERAGE PRICE?
Looking at the ICP chart is enough to kill your beer mood — from $200 down to $5, it’s unbearable.
Recently, ICP has gone through phases of accumulation, decline, accumulation, then more decline. But now, it still retains a large timeframe bullish structure after forming a long-term bottom.
At the current price of around $6, you can start buying. Compared to those who DCA’d along the way down, buying now is much safer — because honestly, there's not much downside left, even if the final bottom structure isn't fully confirmed yet. But we’re very close.
Scoring ICP: 2.9/3
Price: Close to ideal buy zone
Timing: Close to the right time — if you wait, just wait maximum 2 more weeks, and you’ll likely see profit from buying around $6.
Versus other coins: ICP has strong backing, so at this price, at this timing, for the near future, ICP is a solid choice.

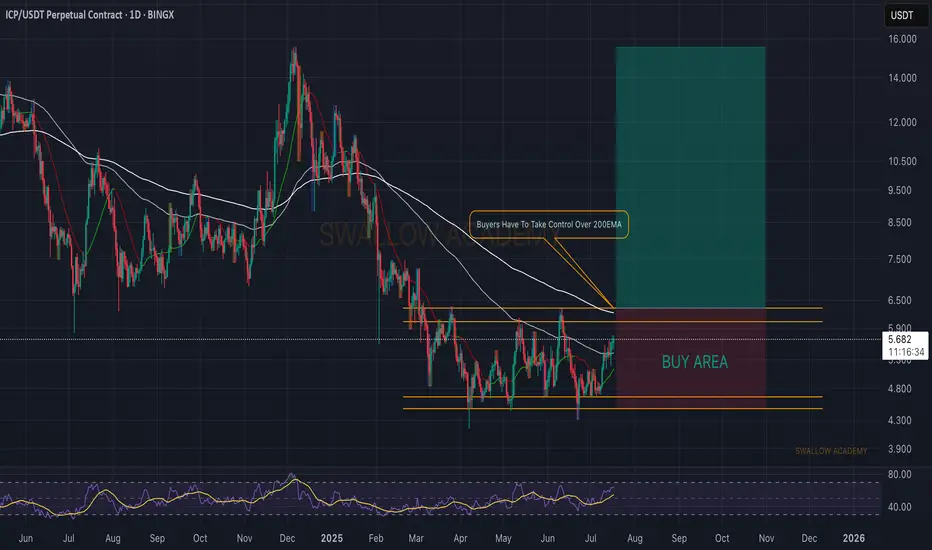
Internet Computer (ICP): Getting Ready For Potential Breakout ICP is in the sideways channel, a zone of accumulation, while being at local lows, which is an ideal zone for a buy considering the fact that markets are full of breakouts lately.
We are looking for a full-scale breakout, which then would mean the break of the 200 EMA and movement to upper zones.
Swallow Academy
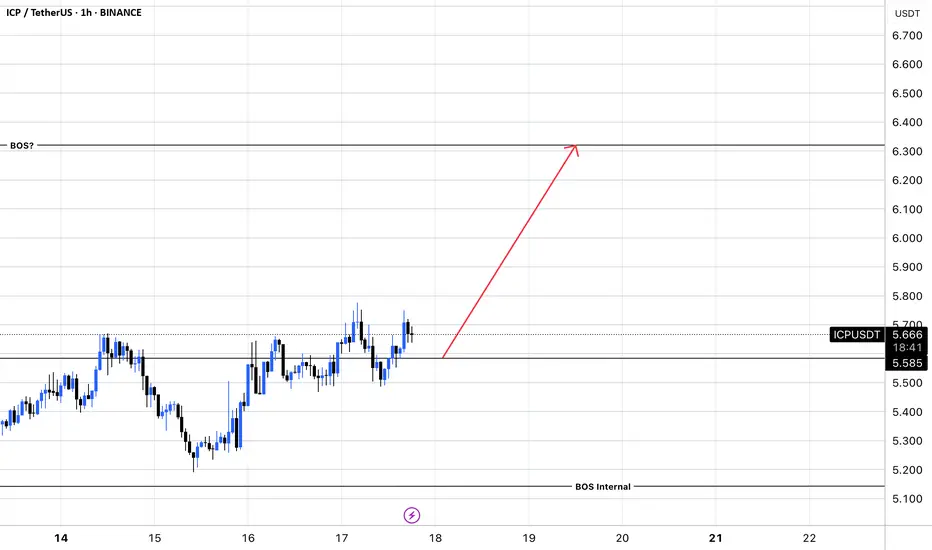
PATH IS CLEAR FOR $ICPWith the Bullish momentum ramping up on FWB:ICP , my next target will be 6.300 for partials. I will leave a runner for as long as possible.
Let me know below what your thoughts are.
ICP to mark up for a higher highBYBIT:ICPUSDT.P looks like accumulating around $5 and can hit $8 in the coming days. There needs to be an increasing momentum soon.

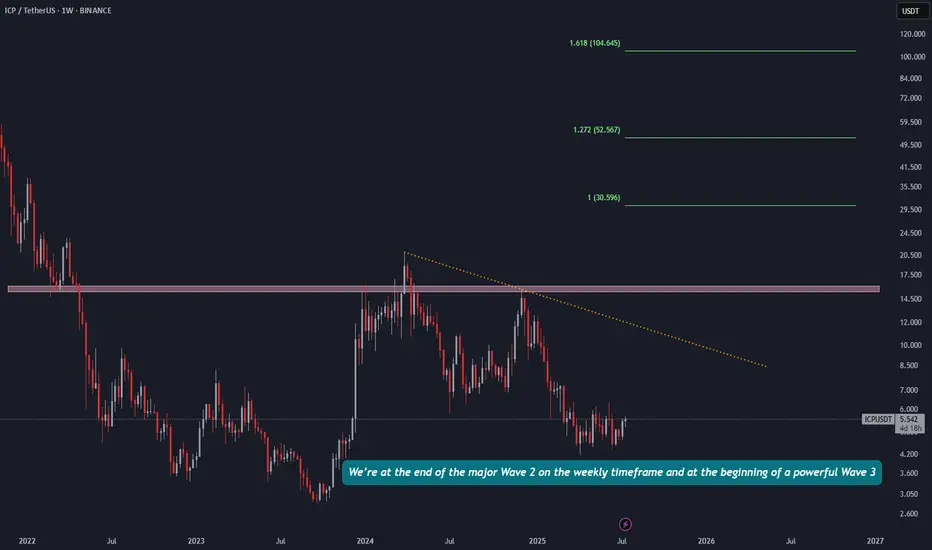
ICPUSDT elliott weekly we’re at the end of the major Wave 2 on the weekly timeframe and at the beginning of a powerful Wave 3
LFG!
July 2025 - Internet computer ICP ;-(Every other week Without Worries is asked for his thoughts on Internet Computer project. It is very clear a number of folks are invested and for a few it is the only crypto token they hold.
Disclaimer . Without Worries does not hold or trade this crypto token. My opinion is impartial.
Two questions every trader or investor must ask themselves before exposure to any asset:
What is the trend?
Support or resistance, which is it?
To not answer either or even ignore the answers; that is to ignore the facts of the chart. You’re here to make money, nothing else.
The questions are best answered on a higher time frame where possible, especially a time frame where market pivots align with the Relative Strength Index (RSI).
Question 1, what is the trend?
Start by looking left, on both Price action and RSI. The first lower high is observed in tandem with a lower high in RSI. This trend is matched in RSI as lower lows in price action and RSI break legacy support. This is clearly a downtrend.
Question 2, Support or resistance, which is it?
As before, look left. Typically best to start with higher timeframes. Support levels are identified by observing historical price charts where the asset has repeatedly stopped falling and reversed upwards. Similarly, resistance levels are identified by observing historical price action where the asset has repeatedly stopped rising and reversed downwards. These levels are often marked by previous swing highs, areas where the price has consolidated, or psychological round numbers (blue and red arrows).
It is fairly clear price action on the above chart now finds resistance on past support.
Bonus observation
With questions 1 and 2 both answered, it is clear future price action favours a bearish outlook on the macro outlook. A long term bear flag has established, now awaiting confirmation. That confirmation shall be a print of rejection from the underside of the flag, which will also be an additional lower high around $10. It is entirely possible (and is often the situation for flags to print their forecasts without confirmation!). After the confirmation price action will begin its decent towards 60 cents.
ww

ICP – Explosive Upside Ahead | EW AnalysisThis is the current outlook for ICP. I anticipate a significant impulse to the upside, with technical projections suggesting a potential move toward the $30 to $100 range, representing gains of over 700%. However, as is often the case with altcoins, caution is warranted as any break to a new low would invalidate this scenario. As long as the low holds, the focus remains on the upside, with 30 dollars as a reasonable initial target.


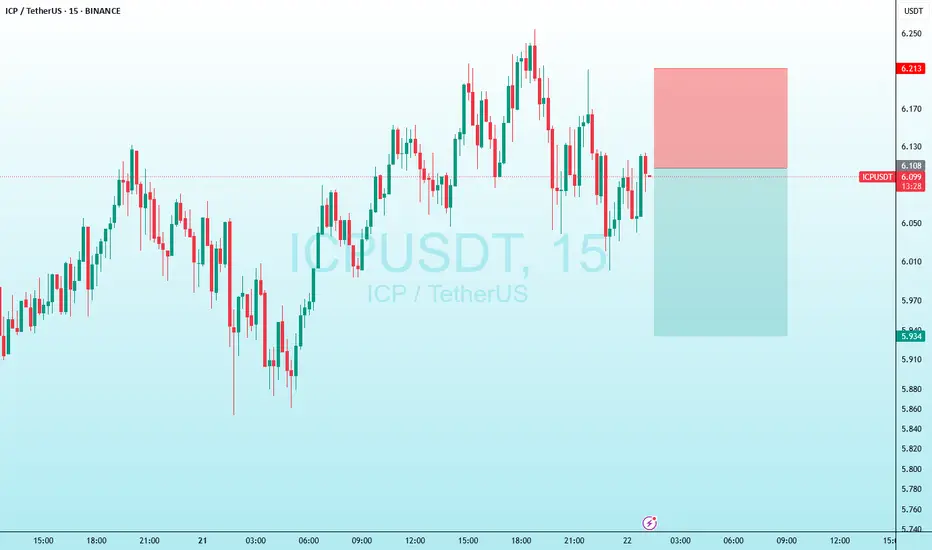
ICPUSDTICP/USDT setting up a classic fair value gap play. After a BOS and strong bullish reaction from the swing low, we're now approaching a critical imbalance zone ($5.87). A reaction here could confirm either continuation or retracement to fill inefficiencies below. Watching closely for a reaction at FVG+. Will bulls break higher or revisit demand?

icpThere is weekly demand in the region and it has potential to grow. This is just a personal opinion.

ICPUSDTCurrent Price Action: The price is currently in a corrective phase, with price interacting with significant support and demand levels, marked as OB (Order Block) and NECKLINE. These levels are crucial for potential reversals.
Key Levels to Watch:
FV+ Zone (Fair Value Gap): The upper resistance is marked by the FV+ zone, indicating a potential area of rejection or a strong bearish bias.
OB (Order Block): The price is testing a significant Order Block at the lower end, which could provide a bullish reversal if price respects this demand zone.
NECKLINE: A possible neckline of a reversal pattern, it could confirm a bullish breakout if the price sustains above it.
Fibonacci Retracements: Price is currently retracing, and key Fibonacci levels (0.382, 0.5, 0.618) are in play. A bounce off the 0.5 Fibonacci level could signal a potential upside move towards the 1.272 and 1.618 extensions, providing a target for future price action.
Trendline Support: A potential trendline (represented by the dashed line) could provide additional support for a reversal in price if it holds.
Key Price Targets:
First Target: Reaching the 0.618 Fibonacci level aligns with potential resistance at higher levels.
Further Targets: Targeting the 1.272 and 1.618 Fibonacci extensions for further upside potential.

Internet Computer (ICP): Looking For BreakoutICP is still good for upward movement, where since last time we had a smaller liquidity movement, which was in buyers' favor but got suppressed pretty quickly.
Now we are seeing it yet again. that buyers are accumulating currentlyand seems like we are going for another breakout (hopefully this time it will not be liquidity move)
Swallow Academy

Internet Computer (ICP): 21.05.2025ICP has recently formed the Break of Structure, where, after the retest, buyers seem to show some sort of fight. We are looking for further dominance from buyers here, which then would give us a good opportunity for bigger upward movement so keep your attention here.
Swallow Academy


ICPUSDT 1W AnalysisICP ~ 1W Analysis
#ICP If you still have confidence in this coin, maybe you can consider this support to start buying back from here, with a short-term target of at least 15%++

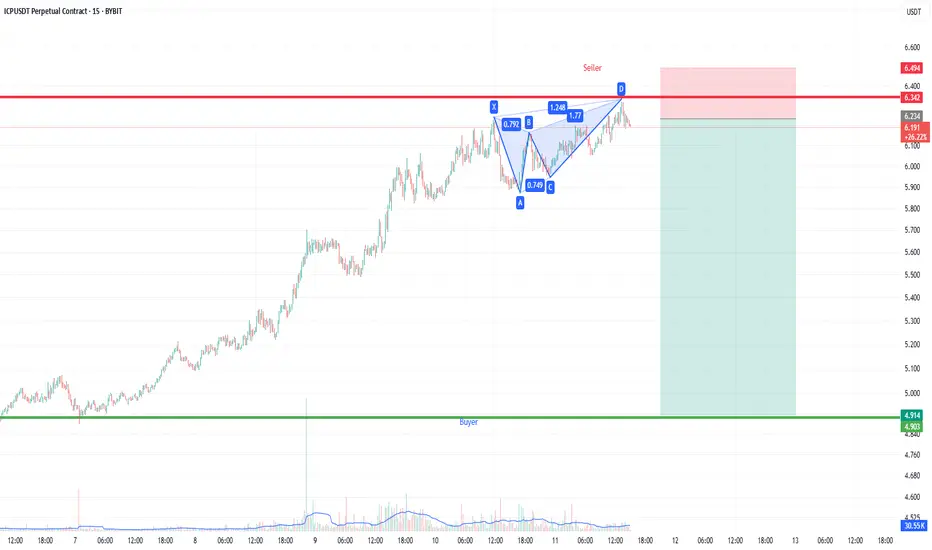
Short Term Sell Harmonic PatternIt is only my Thinking not to a Financials Advice Harmonic patten may be 80% Right 1:5 Target
ICP LONG .ICP/USDT Long idea.
The price has approached the POI and is now trading in the discount zone. The price reacts to demand zones. If we hold this zone and there is confirmation on the lower timeframe, I consider the long in the direction of 5.5+. While the structure is logical, I observe.

#ICP/USDT#ICP
The price is moving within a descending channel on the 1-hour frame, adhering well to it, and is heading towards a strong breakout and retest.
We are experiencing a rebound from the lower boundary of the descending channel, which is support at 5.85.
We are experiencing a downtrend on the RSI indicator that is about to be broken and retested, supporting the upward trend.
We are heading towards stability above the 100 Moving Average.
Entry price: 6.04
First target: 6.13
Second target: 6.28
Third target: 6.50
