July 2025 - Internet computer ICP ;-(Every other week Without Worries is asked for his thoughts on Internet Computer project. It is very clear a number of folks are invested and for a few it is the only crypto token they hold.
Disclaimer . Without Worries does not hold or trade this crypto token. My opinion is impartial.
Two questions every trader or investor must ask themselves before exposure to any asset:
What is the trend?
Support or resistance, which is it?
To not answer either or even ignore the answers; that is to ignore the facts of the chart. You’re here to make money, nothing else.
The questions are best answered on a higher time frame where possible, especially a time frame where market pivots align with the Relative Strength Index (RSI).
Question 1, what is the trend?
Start by looking left, on both Price action and RSI. The first lower high is observed in tandem with a lower high in RSI. This trend is matched in RSI as lower lows in price action and RSI break legacy support. This is clearly a downtrend.
Question 2, Support or resistance, which is it?
As before, look left. Typically best to start with higher timeframes. Support levels are identified by observing historical price charts where the asset has repeatedly stopped falling and reversed upwards. Similarly, resistance levels are identified by observing historical price action where the asset has repeatedly stopped rising and reversed downwards. These levels are often marked by previous swing highs, areas where the price has consolidated, or psychological round numbers (blue and red arrows).
It is fairly clear price action on the above chart now finds resistance on past support.
Bonus observation
With questions 1 and 2 both answered, it is clear future price action favours a bearish outlook on the macro outlook. A long term bear flag has established, now awaiting confirmation. That confirmation shall be a print of rejection from the underside of the flag, which will also be an additional lower high around $10. It is entirely possible (and is often the situation for flags to print their forecasts without confirmation!). After the confirmation price action will begin its decent towards 60 cents.
ww
ICPUSDT trade ideas

ICPUSDTICP/USDT setting up a classic fair value gap play. After a BOS and strong bullish reaction from the swing low, we're now approaching a critical imbalance zone ($5.87). A reaction here could confirm either continuation or retracement to fill inefficiencies below. Watching closely for a reaction at FVG+. Will bulls break higher or revisit demand?

icpThere is weekly demand in the region and it has potential to grow. This is just a personal opinion.

ICP – Explosive Upside Ahead | EW AnalysisThis is the current outlook for ICP. I anticipate a significant impulse to the upside, with technical projections suggesting a potential move toward the $30 to $100 range, representing gains of over 700%. However, as is often the case with altcoins, caution is warranted as any break to a new low would invalidate this scenario. As long as the low holds, the focus remains on the upside, with 30 dollars as a reasonable initial target.

ICPUSDTCurrent Price Action: The price is currently in a corrective phase, with price interacting with significant support and demand levels, marked as OB (Order Block) and NECKLINE. These levels are crucial for potential reversals.
Key Levels to Watch:
FV+ Zone (Fair Value Gap): The upper resistance is marked by the FV+ zone, indicating a potential area of rejection or a strong bearish bias.
OB (Order Block): The price is testing a significant Order Block at the lower end, which could provide a bullish reversal if price respects this demand zone.
NECKLINE: A possible neckline of a reversal pattern, it could confirm a bullish breakout if the price sustains above it.
Fibonacci Retracements: Price is currently retracing, and key Fibonacci levels (0.382, 0.5, 0.618) are in play. A bounce off the 0.5 Fibonacci level could signal a potential upside move towards the 1.272 and 1.618 extensions, providing a target for future price action.
Trendline Support: A potential trendline (represented by the dashed line) could provide additional support for a reversal in price if it holds.
Key Price Targets:
First Target: Reaching the 0.618 Fibonacci level aligns with potential resistance at higher levels.
Further Targets: Targeting the 1.272 and 1.618 Fibonacci extensions for further upside potential.


Internet Computer (ICP): Looking For BreakoutICP is still good for upward movement, where since last time we had a smaller liquidity movement, which was in buyers' favor but got suppressed pretty quickly.
Now we are seeing it yet again. that buyers are accumulating currentlyand seems like we are going for another breakout (hopefully this time it will not be liquidity move)
Swallow Academy

Internet Computer (ICP): 21.05.2025ICP has recently formed the Break of Structure, where, after the retest, buyers seem to show some sort of fight. We are looking for further dominance from buyers here, which then would give us a good opportunity for bigger upward movement so keep your attention here.
Swallow Academy


ICPUSDT 1W AnalysisICP ~ 1W Analysis
#ICP If you still have confidence in this coin, maybe you can consider this support to start buying back from here, with a short-term target of at least 15%++

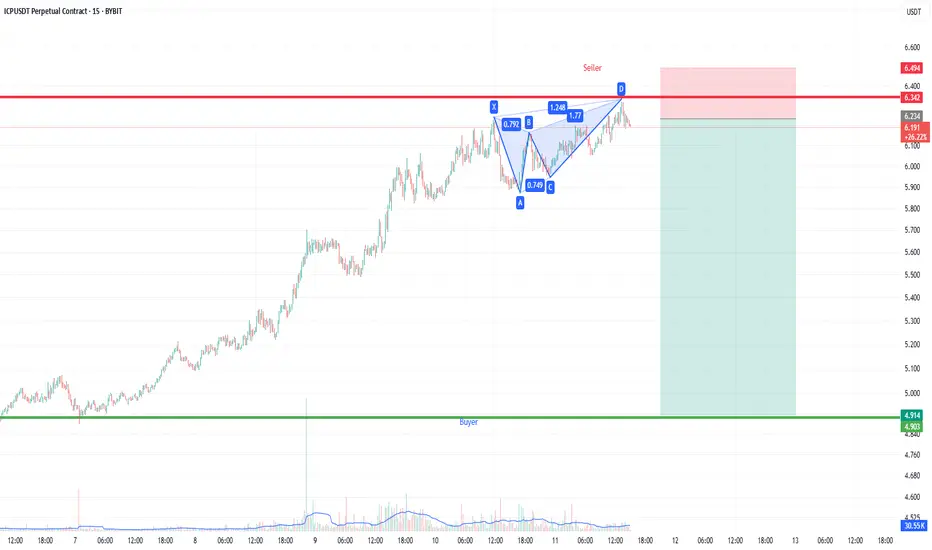
Short Term Sell Harmonic PatternIt is only my Thinking not to a Financials Advice Harmonic patten may be 80% Right 1:5 Target
ICP LONG .ICP/USDT Long idea.
The price has approached the POI and is now trading in the discount zone. The price reacts to demand zones. If we hold this zone and there is confirmation on the lower timeframe, I consider the long in the direction of 5.5+. While the structure is logical, I observe.

#ICP/USDT#ICP
The price is moving within a descending channel on the 1-hour frame, adhering well to it, and is heading towards a strong breakout and retest.
We are experiencing a rebound from the lower boundary of the descending channel, which is support at 5.85.
We are experiencing a downtrend on the RSI indicator that is about to be broken and retested, supporting the upward trend.
We are heading towards stability above the 100 Moving Average.
Entry price: 6.04
First target: 6.13
Second target: 6.28
Third target: 6.50

TradeCityPro | ICP Approaches Key Resistance with Rising Volume👋 Welcome to TradeCity Pro
In this analysis, I want to review the ICP coin for you. The Internet Computer project operates in the fields of artificial intelligence and DePIN.
⭐ The coin of this project, with the symbol ICP, has a market cap of 3.25 billion dollars and ranks 32nd on CoinMarketCap.
📅 Daily Timeframe
As you can see in the daily timeframe, there is a descending trendline visible on the chart, which has been tested multiple times. The price has broken above it and is now sitting just below the 6.205 resistance level.
🔍 In recent candles, the volume has increased significantly, which raises the likelihood of a breakout above 6.205.
🔔 If the 6.205 level is broken, ICP's bullish trend could begin. In that case, the price could move toward the 7.423 and 9.887 levels.
📊 Entering a position with the breakout of 6.205 is supported by volume confirmation, and we will get RSI momentum confirmation if it enters the overbought zone.
📉 For the bearish scenario to play out, the price must first get rejected from 6.205, and then we’ll look for confirmation of a trend reversal with a break below 4.468.
🛒 You can also use this same 6.205 trigger for a spot buy, but keep in mind that Bitcoin dominance is still in an uptrend, so in my opinion, it’s not yet the right time to buy altcoins.
✔️ The best trigger for buying any altcoin is to wait for confirmation of a trend reversal in Bitcoin dominance. Once that’s confirmed, you can start buying the altcoins you’ve selected.
📝 Final Thoughts
This analysis reflects our opinions and is not financial advice.
Share your thoughts in the comments, and don’t forget to share this analysis with your friends! ❤️

ICP: Balancing Risk and Potential💬 My Take:
The project has been overlooked for a while, but the current price structure suggests the story might not be over yet.
Price action looks like it's setting up for a potential next leg — the only question is when the trigger comes.
🎯 Conclusion:
The market isn't giving a clear signal yet — but this zone is worth watching, offering a solid risk/reward setup for those entering now.
Still, keep in mind: if the bearish scenario plays out, ICP could revisit the autumn 2023 lows. That risk must be factored into your strategy.

ICPUSDT UPDATE
Pattern: Falling Wedge Breakout
Current Price: \$5.942
Target Price: \$12.70
Target % Gain: 130.45%
Technical Analysis: ICP has broken out of a long-term falling wedge pattern on the 1D chart. Strong breakout candle with rising volume confirms bullish momentum. This breakout has the potential to initiate a major reversal.
Time Frame: 1D
Risk Management Tip: Always use proper risk management.

Internet Computer Protocol $81 Easy Target Yields 1,450% ProfitsIf you saw the Injective chart you know what happens after a correction, a classic ABC correction. What follows a correction is a bullish impulse.
A target of $81 gives us more than 1,450% profits potential for this pair, ICPUSDT (Internet Computer Protocol).
This is a project that was damaged by the SEC's decision to label it a security, remember? The SEC today is no longer the same as back in those days. It is different now. The SEC is crypto-bullish, the SEC is friendly and whatever damage was caused will be reversed, make no mistake.
Right now ICP is moving within it's long-term accumulation zone. As the name implies, a zone that is good to buy for those focused on long-term hold. Even if you are looking at the short-term or mid-term, this right now is a great entry, great timing, the best possible prices preceding the 2025 bull market phase.
It was a while back when I first saw the possibility of the bull market extending beyond late 2025. This scenario/possibility is now becoming stronger with many projects supporting this view. The chart of many stable, long-term projects are pointing to growth leading into the first half of 2026. Q1 and Q2 2026. This would definitely be the best ever.
Will the next bull market peak in late 2025 or early 2026? Make your guess. What cannot be doubted is that we are going up next. Up, up, up. Are you prepared?
Preparation comes in the form of a plan, and lots of money injected into the market. Buy like the world is about to end. Start buying and continued buying, everything you can. You will be very happy with the results, I promise.
Thank you for reading.
Namaste.

ICP to mark up for a higher highBYBIT:ICPUSDT.P looks like accumulating around $5 and can hit $8 in the coming days. There needs to be an increasing momentum soon.

ICP ROADMAPTo me the view is pretty clear.
* The purpose of my graphic drawings is purely educational.
* What i write here is not an investment advice. Please do your own research before investing in any asset.
* Never take my personal opinions as investment advice, you may lose your money.

The chart presents a technical analysis of ICP/USDT on the 2-wee
📊 Technical Overview:
Pattern Identified: A Falling Wedge breakout to the upside — a classic bullish reversal pattern after a prolonged downtrend.
Breakout Confirmation: The breakout occurred near a key support level, increasing the reliability of the move.
Current Candle: Bullish candle above the wedge, confirming breakout strength.
🎯 Potential Price Targets:
First Target: $10.866
Second Target: $14.831
(Implying a potential upside of over +180% from current levels)
📉 Stop Loss:
Positioned at $2.709, below the previous low to invalidate the setup if breached.
✅ Conclusion:
ICP has broken out of a long-term falling wedge after months of correction. The breakout suggests a strong potential for a bullish rally towards the marked targets, as long as it holds above the support region.

ICP - Perfect Long OpportunityDescription
---------------------------------------------------------------
+ ICP has started reversal inside the channel and the price is heading towards the resistance zone, this gives a bullish trade opportunity.
---------------------------------------------------------------
VectorAlgo Trade Details
------------------------------
Entry Price: 5.3
Stop Loss: 3.3
------------------------------
Target 1: 6.9
Target 2: 12.7
Target 3: 22.5
------------------------------
Timeframe: 1W
Capital Risk: 1-2% of trading amount
Leverage: 5-10x
---------------------------------------------------------------
Enhance, Trade, Grow
---------------------------------------------------------------
Feel free to share your thoughts and insights. Don't forget to like and follow us for more trading ideas and discussions.
Best Regards,
VectorAlgo

ICPUSDT 1D#ICP has broken above the falling wedge and the MA50 on the daily chart, and the retest has been successfully completed. Expect more bullish movement from here. Targets are:
🎯 $6.854
🎯 $8.506
🎯 $9.841
🎯 $11.176
⚠️ Use a tight stop-loss.

ICPUSDT 1D AnalysisICP ~ 1D Analysis
#ICP Buy gradually from here if you still have confidence in this coin with a short term target of at least 10%+ from here.
